Smart Structures and Systems, Vol. 13, No. 3 (2014) 000-000 000
DOI: http://dx.doi.org/10.12989/sss.2014.13.3.000
Recognition of rolling bearing fault patterns and sizes based on two-layer support vector regression machines Changqing Shen1,2, Dong Wang1, Yongbin Liu2, Fanrang Kong
2
and Peter W. Tse1
1
Department of Systems Engineering & Engineering Management, City University of Hong Kong, China 2 School of Engineering Science, University of Science and Technology of China, Hefei 230026, China
(Received January 15, 2013, Revised April 25, 2013, Accepted June 1, 2013) Abstract. The fault diagnosis of rolling element bearings has drawn considerable research attention in recent years because these fundamental elements frequently suffer failures that could result in unexpected machine breakdowns. Artificial intelligence algorithms such as artificial neural networks (ANNs) and support vector machines (SVMs) have been widely investigated to identify various faults. However, as the useful life of a bearing deteriorates, identifying early bearing faults and evaluating their sizes of development are necessary for timely maintenance actions to prevent accidents. This study proposes a new two-layer structure consisting of support vector regression machines (SVRMs) to recognize bearing fault patterns and track the fault sizes. The statistical parameters used to track the fault evolutions are first extracted to condense original vibration signals into a few compact features. The extracted features are then used to train the proposed two-layer SVRMs structure. Once these parameters of the proposed two-layer SVRMs structure are determined, the features extracted from other vibration signals can be used to predict the unknown bearing health conditions. The effectiveness of the proposed method is validated by experimental datasets collected from a test rig. The results demonstrate that the proposed method is highly accurate in differentiating between fault patterns and determining their fault severities. Further, comparisons are performed to show that the proposed method is better than some existing methods. Keywords: statistical parameters; bearing fault diagnosis; deterioration evaluation; a two-layer structure;
support vector regression machine
1. Introduction Rolling element bearings are key components in rotating machinery and widely used in a range of mechanical transmission systems, such as those in automobiles, power plants, and aircraft engines. Unexpected failures in the bearings can cause machine breakdowns, leading to economic losses and, even worse, human casualties. Hence, effective and feasible bearing fault diagnosis techniques are of great industrial importance in avoiding catastrophe and minimizing defective machinery downtimes. As such, this work has attracted considerable research attention (Shen et al. 2012). Bearing faults can cause violent vibrations on a machine when the movements between the components they connect lose fluency. As a result, the vibration signals collected from the
Corresponding author, Professor, E-mail:
[email protected] Copyright © 2014 Techno-Press, Ltd. http://www.techno-press.org/?journal=sss&subpage=8
ISSN: 1738-1584 (Print), 1738-1991 (Online)
Changqing Shen, Dong Wang, Yongbin Liu, Fanrang Kong and Peter W. Tse
machine comprise a great deal of fault-related information (Wang et al. 2011). Zhu et al. (2010) presented an image recognition technology for rotating machinery fault diagnosis. In addition, ensemble empirical mode decomposition (EEMD) (Huang et al. 1998) and wavelet analysis (Yan et al. 2009) are potential approaches to extracting useful signatures in both time and frequency domains (Wang et al. 2009). Signal processing-based fault diagnosis methods have been widely investigated and have proven to be effective and powerful machine fault diagnosis tools. However, for complex vibration signals, considerable expertise is required to make correct judgments regarding fault diagnosis and prognosis (Wang et al. 2011). In contrast, artificial-intelligence-based fault diagnosis methods have the potential to tackle this problem without human experience (Caesarendra et al. 2011, Gryllias et al. 2012). These methods aim to recognize different machine health conditions via the features extracted from the vibration signals. The accuracy of the identification of these conditions can be further enhanced through classifiers that exhibit good performance (Di Maio et al. 2012). Artificial neural networks (ANNs), which are developed in accordance with how the human brain processes information, have proven very effective in machine fault diagnosis. However, they have a number of drawbacks, including slow convergence and poor generalization ability. They are also unsuitable for solving problems when few samples are available for training the models (Wong et al. 2006). Vanpnik (1995) recently developed computational supervised learning approaches known as support vector machines (SVMs) based on statistical learning theory. SVMs have well-defined formulations and keep consistent with mathematical theory. Moreover, owing to their superior generalization capability, SVMs do not require a large amount of samples for training (Widodo et al. 2007). Hu et al. (2007) used SVM ensembles for bearing fault diagnosis and achieved better results compared with other approaches. Konar et al. (2011) proposed a bearing fault detection scheme for a three-phase induction motor that combined continuous wavelet transforms and SVMs. Based on the correlation between intrinsic mode functions (IMFs) and SVMs, a reliable method of pattern recognition for rolling bearing faults has also been put forward (Jiang et al. 2012). Most of the studies on bearing fault diagnosis have focused on distinguishing different fault patterns while ignoring bearing fault deterioration. In fact, the deterioration of a normal bearing into one suffering functional failure is a gradual process. The failure usually occurs when an early bearing fault grows to a severe extent (Heng et al. 2009). Maintenance actions taken too early or late are not suitable, as they result in too much or too little maintenance (Cai et al. 2012). Hence, tracking the size of a bearing’s defect is more meaningful for timely maintenance actions and could bring considerable economic benefits. The challenge of an effective bearing fault diagnosis method not only requires that the fault patterns be recognized, but also the defect sizes to evaluate a deteriorating bearing’s health status. Until now, the relevant studies have seldom reported results to this effect. Unlike the target value of a traditional SVM, which can only be used to handle a binary problem, the target value of a support vector regression machine (SVRM) is continuous. It has shown great potential in time series prediction, and thus can establish a stable nonlinear relationship between inputs and outputs (Smola et al. 2004). Most of the studies on SVRMs have aimed at making time series predictions (Jiang et al. 2012), whereas classification problems are usually addressed by a binary SVM. In a traditional SVM method, multi-class problems are usually tackled by combining a number of binary SVM classifiers. For example, the max-win strategy suffers the problem of equal votes. Considering a k class problem and given an input vector xi belonging to the class l, k (k-1)/2 binary classifiers are required to be established prior to
Recognition of rolling bearing fault patterns and sizes based on two-layer…
an unknown input vector classification. The pattern recognized by the classifier trained from the samples coming from the two other classes i and j (i, j≠l) is less meaningful, and conversely, this affects the votes for the class l. When the feature vectors extracted from the samples belonging to the same class are fed to the trained SVRM, the outputs of the trained SVRM produce small deviations from their target values. Therefore, this property is more attractive to be used for solving the multi-class problems comparing to binary SVM based classifiers. In this paper, in order to establish a systematic scheme for diagnosing early bearing fault patterns and sizes, a new two-layer structure consisting of SVRMs is proposed to accurately recognize both bearing fault patterns and sizes. Some statistical features are first extracted from the vibration signals collected from a machine under different bearing health conditions. The two-layer SVRMs are then trained with the feature vectors by defining decision-making functions based on the regression functions which have continuous outputs for the two layers. Finally, bearing fault patterns and sizes are intelligently recognized via the nonlinear models in the two layers. The proposed method is applied to the fault diagnosis and health evaluation of the bearing datasets. Compared with the fault identification ratios obtained by conventional multi-classifiers that are constructed via binary SVMs and the regressive errors of an ANN analysis, the method proposed herein exhibits a more systematic and higher degree of accuracy. The rest of this paper is outlined as follow. Section 2 briefly describes the fundamental theory of SVRMs. The proposed two layer SVRMs structure is presented in Section 3, followed by experimental verification tests using bearing datasets as stated in Section 4. A comparison study between conventional methods and the proposed scheme is investigated in section 5. Conclusions are drawn in Section 6.
2. Theoretical background of SVRMs SVRM theory is developed based on the principle of SVM and is originally used for time series prediction. Given a dataset
{xi , yi }iN1 , where xi is an input feature vector, yi is the target value,
and N is the total number of training samples. In ε- insensitive support vector regression, it aims to obtain a function f(x) which can predict the output yi within the error limit of ε. Besides, the estimation function f(x) can be as flat as possible to ensure a good generalization property and variance. This function is presented as follow
f x w x b
(1)
where w is the weight vector and b is a constant. The function can be obtained by solving the following optimization problem
min
n 1 2 w C (i i* ) 2 i 1
yi w xi b i s.t. w xi b yi i* * i , i 0
(2)
Changqing Shen, Dong Wang, Yongbin Liu, Fanrang Kong and Peter W. Tse
where i and
i*
denote the slack variable, C is a positive constant which penalizes the errors
larger than using ε- insensitive loss function given as follow
0, if , otherwise
(3)
Fig. 1 (a) shows the regression line, the upper and lower boundary lines. Fig. 1 (b) shows the ε- insensitive loss function. To solve the optimization problem provided by Eq. (2), the following Lagrange equation is required to be constructed
L
n n 1 2 C (i i* ) (ii i*i* ) 2 i 1 i 1 n
n
i ( i yi w xi b) ( yi w xi b) i 1
i 1
* i
(4)
* i
where i , i* ,i ,i* are Lagrange multipliers which have to satisfy the following constraints
i , i* ,i ,i* 0,
(5)
The partial derivatives of the Lagrange equation L with respect to the primal variables ( , b, i , i* ) have to vanish for optimality n L * b ( i i ) 0 i 1 n L ( i i* )xi 0 i 1 , L C i i 0 i L C * * 0 i i i*
(6)
By substituting Eq. (6) into Eq. (4), the dual optimization problem is given as follow
max s.t.
n n 1 n * * * x x yi ( i i* ) ( )( )( ) ( ) i i j j i j i i 2 i , j 1 i 1 i 1
n
( i 1
i
) 0 and i , 0, C * i
* i
(7)
Recognition of rolling bearing fault patterns and sizes based on two-layer…
(a)
(b)
+ε ξi
Loss function
-ε
ξi
ξ i* -ε
+ε
Fig. 1 The regression line of SVR shown in (a) and the loss function of SVR is shown in (b)
By exploiting Karush-Kuhn-Tucker (KKT) conditions (Smola et al. 2004), the computation of b is done by the following formula
yi w xi b yi w xi
for i (0, C ) for i* (0, C )
(8)
Then, by solving the optimization problem, a linear regression function is presented as follows n
f ( x) (i i* )( xi x) b
(9)
i 1
The linear regression function is not sufficient enough to process the non-linear problem. The kernel function is applied here to map the input vector into a high dimensional feature space and thus the regressive function is derived as follow n
f ( x) (i i* ) K ( xi , x) b
(10)
i 1
where K ( xi , x) ( xi ) ( x) is a symmetric positive defined kernel function given by the Mercer's theorem (Minh et al. 2006). In this paper, the popular radial basis function (RBF) is adopted and its mathematical formula is given as
K xi , x e where is a positive real number.
xi x
2 2
2
(11)
Changqing Shen, Dong Wang, Yongbin Liu, Fanrang Kong and Peter W. Tse
Start Extract statistical features from vibration signals under different bearing health conditions
Training samples
Testing samples
Train a SVR classifier
Fault pattern recognition
For each fault pattern, train SVR models for fault size ii
Fault size recognition
Fault feature extraction
The first layer: training and testing The second layer: training and testing
Rolling element bearing health status evaluation on both fault patterns and sizes
Fig. 2 Framework of the proposed two-layer SVRMs structure for identifying bearing fault patterns and sizes
3. The proposed two-layer SVRMs for bearing health evaluation The proposed two-layer structure includes two hierarchical steps: a fault pattern decision and a fault size evaluation. Each step is detailed in the following subsections. The framework of the proposed scheme is depicted in Fig. 2. 3.1 Fault feature extraction With the degradation of a bearing, violent vibrations occur increasingly in the mechanical system and are reflected in the collected vibration signals from the machine. To prevent the machine’s breakdown over time and ensure production efficiency, the real-time defect size must be monitored so that some suitable and timely action may be taken according to the defect development trend. Hence, extracting the sensitive features that reflect the actual bearing health status is an important task for the later procedure. When a bearing defect starts to develop, it results in the variations of the signal amplitudes, which cause that the distribution of the signal is different from that under the normal health condition. Besides, the signals obtained under different fault conditions may exhibit differently in the aspects of signal amplitudes, impact intervals, etc. In
Recognition of rolling bearing fault patterns and sizes based on two-layer…
order to describe different health conditions, statistical features can be used. For example, kurtosis can be used to measure whether the signal is peaked or flat relative to a normal distribution, and the variance can be used to measure the dispersion of the signal about its mean. Skewness, crest factor, clearance factor, shape factor, and impulse indicator can reflect the distribution of the signal, while square root amplitude value and absolute mean amplitude value can measure the vibration amplitudes and energy of the time domain signal. Hence, these time domain statistical features are extracted (Wang et al. 2011). For some types of bearings, such as the tapered rolling bearing whose contact angles are smaller than 90°, when it operates under a pure axial load, time domain statistical features may be approximately identical for different health conditions. In order to solve the above problem, some statistical features should be extracted from frequency domain. The spectral mean, spectral variance, and frequency center can satisfactorily measure the vibration energy, the convergence of spectrum power, the locations of the main frequency components, which have different values for different fault patterns (Lei et al. 2008). The time-domain and frequency-domain features are summarized in Table 1. Table 1 The time-domain and frequency-domain statistical features N
N
(xi x)4 i 1
Kurtosis:
( N 1)
Crest factor:
(x x) ,
4
max(| xi |) 1 N
N
i 1
, ( N 1) 3 max(| xi |) , Clearance factor: 1 N 2 ( | xi |) N i 1 Skewness:
,
x
2 i
i 1
3
i
1 N 2 xi N i 1 , Shape factor: 1 N | xi | N i 1
max(| xi |) , 1 N | xi | N i 1
Impulse indicator:
N
(x x)
2
Variance:
i 1
i
N 1
Square root amplitude value:
, 1 | xi |, N i1
1 N | xi |)2 , N i 1
K
F
N
Absolute mean amplitude value:
(
Spectral Mean:
k
k 1
,
K K
f F
K
(Fk F)2 Spectral variance:
k 1
K 1
,
Frequency center:
k 1 K
k
k
F k 1
.
k
where Fk is a frequency spectrum, K is the number of frequency spectrum lines, fk is the frequency value at the kth frequency spectrum line.
Changqing Shen, Dong Wang, Yongbin Liu, Fanrang Kong and Peter W. Tse
3.2 Using two-layer SVRMs for accurate bearing fault diagnosis As previously mentioned, the challenge of an effective bearing fault diagnosis method requires recognizing not only the fault patterns but also the defect sizes to track the bearing’s health status. Hence, it is important to take timely maintenance actions. The two-layer SVRMs structure is presented here to solve this problem. As Fig. 2 shows, the first layer aims to identify bearing fault patterns, which indicate a pattern recognition or classification problem. In this study, a new classification strategy known as the generic support vector regressive classifier is proposed. The SVR has great potential for constructing nonlinear relationships between the input vectors and output values. The fault feature vectors of samples belonging to the same class should have similar values and thus produce outputs with a small degree of variance in the SVR model. Define the class labels as 1,2,…,C for a C class problem, and construct a dataset
{xi , yi }iN1 , where x i is the input feature vector,
yi {1, 2,..., C} is the target value, and N is the total number of training samples. For a sample of the ith class, whose target value is i during the support vector regressive classifier construction, the output of the SVR model should produce a smaller deviation from i than that of a different class. According to the foregoing illustration, the tested sample belongs to the class m if m satisfies the following proposed decision-making function n
arg min m ( ( i )e m 1,2,..., M
xi X
* i
i 1
2
2
2
b)
(12)
where M denotes the condition number and X is the fault feature vector for the testing sample. After a fault pattern is decided in the first layer, the sample is then fed to its related fault size recognition model in the second layer. The second layer of a two-layer SVRMs structure focuses on recognizing the fault size based on the fault pattern recognized in the first layer. Given dataset {xi,yi}, i=1,2,…N, where xi is the input feature vector extracted from the vibration signals under different fault sizes for a certain bearing fault, yi is the actual bearing fault size and N is the total number of training samples. By solving the mathematical problem illustrated in Eq. (2), a support vector regressive model that constructs a nonlinear relationship between the signal features and related bearing fault size is trained and established for further processing. The fault size nonlinear analysis function is described as follows. n
f size ( x) (i )e i 1
* i
xi x 2
2
2
b
(13)
3.3 Two-layer SVRMs parameter selection and optimization To better train the previously introduced two-layer SVRMs, three key parameters, C,
, and
Recognition of rolling bearing fault patterns and sizes based on two-layer…
, should be properly determined. To obtain the optimal parameters, the numerical ranges of these parameters are first decided. The parameters are then iteratively selected via grid search, and the two-layer SVRMs are constructed according to the proposed method based on the SVR theory. In the first layer, the model output for the sample should be as close to its practical fault label value as possible, or it will be misclassified to the wrong fault pattern according to Eq. (12). Hence, it is hoped that in the training process of the first layer, the model outputs should be as close to their target values as possible. Similarly, the model output should be as close to it practical fault size as possible in the second layer. Consequently, to evaluate the performance of the constructed models, the normalized root mean square error (RMSE) of the predicted results based on the popular cross-validation scheme is adopted as an evaluative criterion in this study, as it is capable of evaluating the goodness of fit related to the actual bearing fault label values and sizes. Finally, the intelligent diagnosis model with the least RMSE for the outputs is applied for further analysis. The optimization strategy is presented in Fig. 3.
Training data sets (xi,yi)
Initial value of C, , and
Train two-layer SVRMs Cross-validation Grid
Calculate the RMSE
search Yes Satisfy stopping criteria?
The two-layer SVRMs based on SVR with the selected parameters
No The new parameters Fig. 3 Flow chart of the two-layer SVRMs parameter selection and optimization
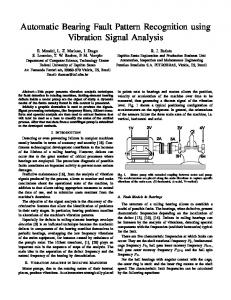
4. Validation of the proposed method To verify the effectiveness of the proposed method, the experimental bearing fault data provided by Case Western Reserve University is analyzed here (Loparo 2012). The data were collected from a test rig, as shown in Fig. 4. The experimental setup mainly included a 2 hp motor
Changqing Shen, Dong Wang, Yongbin Liu, Fanrang Kong and Peter W. Tse
(left), a torque transducer, and a dynamometer (right). The motor shaft was supported by 6205-2RS JEM SKF type bearings. The bearings’ inner race, outer race, and rolling elements were artificially seeded by a single point fault using electro-discharge machining, respectively. For the faults localized to the inner race, rolling elements, and outer race, the accelerometers were used to sample vibration signals at 12k Hz and were installed at the 12 o’clock, 12 o’clock, and 6 o’clock positions at the fan end, respectively. The data samples obtained from the different bearing health conditions are shown in Fig. 5. Two datasets of signals including health and three different fault conditions are employed here for analysis. As Table 2 shows, for each dataset, in the first layer of the two-layer SVRMs, 180 samples for each condition were acquired for training and testing, 90 samples were used for training, and the remaining 90 samples were used for testing. In the second layer, there were 30 training samples and 30 testing samples for each fault severity. In the first layer, the inner race, outer race, ball fault, and bearing health target values were artificially set at 1, 2, 3, and 4, respectively, during the training while the actual fault sizes were determined as the target values in the second layer.
Fig. 4 Description of the experimental platform 0.5
(a)
0 -0.5
0
0.1
0.2
0.3
0.4
2
0.5 (b)
Amplitude(V)
0 -2
0
0.1
0.2
0.3
0.4
5
0.5 (c)
0 -5
0
0.1
0.2
0.3
0.4
0.5
0.5 (d)
0 -0.5
0
0.1
0.2
0.3
0.4
0.5
Tims(s)
Fig. 5 Data samples obtained from different bearing health conditions: (a) the normal bearing signal, (b) the bearing inner race fault signal, (c) the bearing outer race fault signal, and (d) the bearing ball fault signal
Recognition of rolling bearing fault patterns and sizes based on two-layer… Table 2 Description of the bearing data for each dataset Health condition
Inner race fault
Outer race fault
Ball fault
Health
Defect size
Training
Testing
Target values for two-layer SVRMs
(inches)
samples
samples
The first layer
0.007
30
30
0.014
30
30
0.021
30
30
0.021
0.007
30
30
0.007
0.014
30
30
0.021
30
30
0.021
0.007
30
30
0.007
0.014
30
30
0.021
30
30
-
90
90
The second layer 0.007
1
2
3
0.014
0.014
0.014 0.021
4
-
The two bearing datasets were processed according to the flowchart of the proposed intelligent fault diagnosis scheme illustrated in Fig. 2. In the first layer of the two-layer SVRMs, the 12 statistical features introduced in Table 1 were first extracted from each sample, producing 360 feature vectors for the four bearing health conditions. With the pre-defined target values, the intelligent nonlinear model, which constructs the relationship between the feature vector and bearing fault pattern, was trained after a parameter grid search and cross-validation. C={20, 21,…, 27}, ={20, 20.1,…, 22} and ={0.01, 0.02,…, 0.1} were selected as the numerical ranges for the parameters grid search and cross-validation. Fig. 6 to Fig. 9 show the training and testing results on the bearings’ inner race, outer race, ball faults, and normal pattern recognitions for dataset one, respectively. According to the proposed decision-making function shown in Eq. (12), the sample was classified to the fault category whose pre-defined target value was nearest in linear distance to the sample predicted output value. Hence, as indicated in these figures, one sample was misclassified in the testing process for the inner race fault samples because its output value in the first layer was nearer to label 2, representing the pattern value for an outer race fault. All of the training samples were correctly attributed to the appropriate fault categories. The similar training and testing processes were conducted for dataset two. The accuracy of the bearing fault recognition for the two datasets is summarized in Table 3. It can be concluded that the proposed SVR classification method achieved a great performance in the first layer of the two-layer SVRMs. In the second layer of the two-layer SVRMs, the samples from three different fault severities collected under each condition, as shown in Table 2, were used for model training and testing. Fig. 10 shows the training and testing results for the inner race fault samples according to the proposed fault size nonlinear analysis function in Eq. (13). The predicted inner race fault size values stayed in good accordance with the actual values and training results. The maximum error for the predicted result was less than 0.003 inch.
Changqing Shen, Dong Wang, Yongbin Liu, Fanrang Kong and Peter W. Tse Actual label Predicted value
Label value
2
(a)
1.5 1 0.5 0
0
10
20
30
40 50 Sample
60
70
80
Label value
2
90
(b)
1.5 1 0.5 0
0
10
20
30
40 50 Sample
60
70
80
90
Fig. 6 The (a) training results and (b) testing results in the first layer of the two-layer SVRMs for the bearings’ inner race fault pattern recognitions using dataset one Actual label Predicted value
Label value
3
(a)
2.5 2 1.5 1
0
10
20
30
40 50 Sample
60
70
80
Label value
3
90
(b)
2.5 2 1.5 1
0
10
20
30
40 50 Sample
60
70
80
90
Fig. 7 The (a) training results and (b) testing results in the first layer of the two-layer SVRMs for the bearings’ outer race fault pattern recognitions using dataset one Actual label Predicted value
Label value
4
(a)
3.5 3 2.5 2
0
10
20
30
40 50 Sample
60
70
80
Label value
4
90
(b)
3.5 3 2.5 2
0
10
20
30
40 50 Sample
60
70
80
90
Fig. 8 The (a) training results and (b) testing results in the first layer of the two-layer SVRMs for the bearings’ ball fault pattern recognitions using dataset one
Recognition of rolling bearing fault patterns and sizes based on two-layer…
Actual label Predicted value
Label value
5
(a)
4.5 4 3.5 3
0
10
20
30
40 50 Sample
60
70
80
Label value
5
90
(b)
4.5 4 3.5 3
0
10
20
30
40 50 Sample
60
70
80
90
Fig. 9 The (a) training results and (b) testing results in the first layer of the two-layer SVRMs for the bearings’ normal pattern recognitions using dataset one
Fault size
0.025
(a)
Actual fault size Predicted fault size
0.02 0.015 0.01 0.005
0
10
20
30
40 50 Sample
60
70
80
Fault size
0.025
90
(b)
0.02 0.015 0.01 0.005
0
10
20
30
40 50 Sample
60
70
80
90
Fig. 10 The predicted inner race fault sizes for the (a) training sample results and (b) testing sample results in the second layer of the two-layer SVRMs using dataset one
Table 3 Bearing fault recognition results in the first layer of the two-layer SVRMsu Dataset Health condition Training accuracy Inner race fault 100% Outer race fault 100% Ball fault 100% Health 100% Overall accuracy 100%
I Testing accuracy 98.89% 100% 100% 100% 99.72%
Training accuracy 100% 100% 100% 100% 100%
II Testing accuracy 100% 100% 98.89% 100% 99.72%
Fig. 11 similarly illustrates the results of the outer race fault size prediction. The predicted fault size values matched well with the actual fault size values. Fig. 12 presents the results for the ball fault size prediction. As the most complicated fault
Changqing Shen, Dong Wang, Yongbin Liu, Fanrang Kong and Peter W. Tse
pattern, the ball faults exhibited more complex vibration signals for a defective ball’s stochastic motion, and thus the relationship between the feature vector and actual fault size was hard to establish precisely. However, in the second layer of the proposed two-layer SVRMs, the maximum error of the predicted fault size values kept within 0.004 inch, although the predicted fault sizes fluctuated more violently to the actual fault sizes than those of the inner race and outer race faults. As previously analyzed for dataset one, the proposed two-layer SVRMs structure acts as a systematic bearing fault diagnosis scheme that identifies both a bearing’s fault size and the fault severity. Meanwhile, through validation of the experimental bearing dataset, the proposed method achieved a satisfactory performance. The results related to the identification of the fault sizes using dataset two will be reported in Section 5 for comparison purposes. In order to shorten the length of the results obtained by the proposed method using dataset two, only the final accuracy will be reported.
Fault size
0.025
(a)
Actual fault size Predicted fault size
0.02 0.015 0.01 0.005
0
10
20
30
40 50 Sample
60
70
80
Fault size
0.025
90
(b)
0.02 0.015 0.01 0.005
0
10
20
30
40 50 Sample
60
70
80
90
Fig. 11 The predicted outer race fault sizes for the (a) training sample results and (b) testing sample results in the second layer of the two-layer SVRMs using dataset one
Fault size
0.025
(a)
Actual fault size Predicted fault size
0.02 0.015 0.01 0.005
0
10
20
30
40 50 Sample
60
70
80
Fault size
0.025
90
(b)
0.02 0.015 0.01 0.005
0
10
20
30
40 50 Sample
60
70
80
90
Fig. 12 The predicted ball fault sizes for the (a) training sample results and (b) testing sample results in the second layer of the two-layer SVRMs using dataset one
Recognition of rolling bearing fault patterns and sizes based on two-layer…
5. Comparisons with other SVM and ANN methods The proposed two-layer SVRMs structure acts as a systematic scheme for diagnosing bearing faults with high accuracy. To further prove its superiority over other methods, comparisons were conducted in the first and second layers, respectively. In the traditional SVM method, the max-win strategy is considered a powerful strategy in dealing with actual applications due to its fast training speeds and good classification accuracy relative to other strategies (Zhao et al. 2008). The feed-forward network, which is a two-layer perception and the most popular neural network, was adopted in this study for further comparison. Via the back propagation algorithm, the feed-forward network iteratively changes its weights to minimize the RMSE using the gradient search technique (Rafiee et al. 2007). This study used the sigmoid transfer function, and the number of nodes in the hidden layer was determined through a linear search method. Through trial and error using the data in these two cases, a feed-forward network was constructed when the number of nodes in the hidden layer was set as 20. Tables 4 and 5 describe the recognition accuracy obtained by the traditional SVM and ANN methods for the two datasets, respectively. According to the results listed in Tables 4 and 5, the proposed method in the first layer was more accurate than the traditional SVM and ANN methods. The ANN method was similarly used to replace the method in the second layer of the two-layer SVRMs method proposed in this study. The samples with different fault severities under each fault condition were used for ANN model training and testing. Fig. 13 to Fig. 15 show the bearing fault size prediction results obtained by the ANN method for dataset one. The second layer of the proposed two-layer SVRMs clearly performed better than the ANN method. The results shown in Fig. 13 to Fig. 15 fluctuated violently and produced larger errors than those shown in Fig. 10 to Fig. 12.
Table 4 Bearing fault recognition results obtained by the traditional SVM method Dataset Health condition Inner race fault Outer race fault Ball fault Health Overall accuracy
I Training accuracy 98.89% 100% 92.22% 92.22% 95.56%
II
Testing accuracy
Training accuracy
Testing accuracy
100% 100% 86.67% 86.67% 93.33%
96.67% 100% 93.33% 100% 97.5%
90% 86.67% 92.22% 100% 92.22%
Table 5 Bearing fault recognition results obtained by the ANN method Dataset Health condition Inner race fault Outer race fault Ball fault Health Overall accuracy
I Training accuracy 93.33% 97.78% 90% 100% 95.28%
II
Testing accuracy
Training accuracy
Testing accuracy
96.67% 100% 84.44% 100% 95.28%
90% 97.78% 93.33% 100% 95.28%
93.33% 93.33% 86.67% 100% 93.33%
Changqing Shen, Dong Wang, Yongbin Liu, Fanrang Kong and Peter W. Tse
Fault size
0.025
(a)
Actual fault size Predicted fault size
0.02 0.015 0.01 0.005
0
10
20
30
40 50 Sample
60
70
80
Fault size
0.025
90
(b)
0.02 0.015 0.01 0.005
0
10
20
30
40 50 Sample
60
70
80
90
Fig. 13 The predicted inner race fault sizes obtained by the ANN method for the (a) training samples and (b) testing samples using dataset one
Fault size
0.025
(a)
Actual fault size Predicted fault size
0.02 0.015 0.01 0.005
0
10
20
30
40 50 Sample
60
70
80
Fault size
0.025
90
(b)
0.02 0.015 0.01 0.005
0
10
20
30
40 50 Sample
60
70
80
90
Fig. 14 The predicted outer race fault sizes obtained by the ANN method for the (a) training samples and (b) testing samples using dataset one
Fault size
0.025
(a)
Actual fault size Predicted fault size
0.02 0.015 0.01 0.005
0
10
20
30
40 50 Sample
60
70
80
Fault size
0.025
90
(b)
0.02 0.015 0.01 0.005
0
10
20
30
40 50 Sample
60
70
80
90
Fig. 15 The predicted ball fault sizes obtained by the ANN method for the (a) training samples and (b) testing samples using dataset one
Recognition of rolling bearing fault patterns and sizes based on two-layer… Table 6 The maximum errors for the results obtained by the two-layer SVRMs and ANN methods Dataset
Fault pattern Methods
I II
Training Testing Training Testing
Inner race fault two-layer ANN SVRMs based 0.0003 0.0014 0.0006 0.0017 0.0007 0.0011 0.0022 0.0020
Outer race fault two-layer ANN SVRMs based 0.0003 0.0014 0.0007 0.0018 0.0003 0.0016 0.0013 0.0017
Ball fault two-layer ANN SVRMs based 0.0024 0.0039 0.0037 0.0054 0.0013 0.0022 0.0038 0.0054
Statistical indicator was used to quantify the accuracy of the second layer of the two-layer SVRMs for the two datasets, respectively. The maximum error, which evaluates the maximum deviation from the actual fault size, was defined as
Maximum error max( f actual f predicted )
(14)
As shown in Table 6, the values of these indicators obtained in the second layer of the two-layer SVRMs were better than those obtained by the ANN method in the two dataset studies. The results once again proved the superiority of the proposed method.
6. Conclusions This study proposed a new two-layer structure consisting of SVRMs. Compared with the traditional classification methods reported in many other studies, this study not only aimed to identify different bearing fault patterns, but also evaluated their deteriorating health conditions. The proposed scheme was more meaningful in practice, as the entire useful life of a bearing went through a deterioration process before its functional failure occurred. According to the aforementioned illustration, the proposed scheme involved extracting representative statistical parameters from the vibration signals, identifying the bearing health condition in the first layer, and predicting the fault size in the second layer once a fault pattern was recognized in the first layer. The proposed decision-making function for bearing fault pattern recognition in the first layer overcame the drawback of the equal votes, which occurred in the max-win strategy SVM method. In addition, the two-layer SVRMs had well-defined formulations and kept consistent with the mathematical theory. Hence, the two-layer SVRMs method was superior to the traditional SVM method and better at generalizing than the ANN method, as demonstrated by both theoretical analysis and experimental dataset validation.
Acknowledgements The work described in this paper was partly supported by a grant from the Research Grants Council of the Hong Kong Special Administrative Region, China (Project No. CityU 122011), a Natural Science Foundation of China (Grant No. 51075379) and a Natural Science Major Project of Education Department of Anhui Province (Grant No. KJ2013A010). The authors also would like to appreciate two anonymous reviewers for their constructive and valuable comments for improving this paper.
Changqing Shen, Dong Wang, Yongbin Liu, Fanrang Kong and Peter W. Tse
References Caesarendra, W., Widodo, A. and Yang, B.S. (2011), “Combination of probability approach and support vector machine towards machine health prognostics”, Probabilist. Eng. Mech., 26(2), 165-73. Cai, G.G., Chen, X.F., Li, B., Chen, B.J. and He, Z.J. (2012), “Operation reliability assessment for cutting tools by applying a proportional covariate model to condition monitoring information”, Sensors, 12(10), 12964-12987. Di Maio, F., Hu, J., Tse, P., Pecht, M., Tsui, K. and Zio, E. (2011), “Ensemble-approaches for clustering health status of oil sand pumps”, Expert Syst. Appl., 39(5), 4847-4859. Gryllias,K.C., and Antoniadis, I.A. (2012), “A support vector machine approach based on physical model training for rolling element bearing fault detection in industrial environments”, Eng. Apl. Artif. Intel., 25(2), 326-344. Heng, A., Zhang, S., Tan, C.C. and Mathew, J. (2009), “Rotating machinery prognostics: State of the art, challenges and opportunities”, Mech. Syst. Signal Pr., 23(3), 724-739. Hu, Q., He, Z.J., Zhang, Z.S. and Zi, Y.Y. (2007), “Fault diagnosis of rotating machinery based on improved wavelet package transform and SVMS ensemble”, Mech. Syst. Signal Pr., 21(2), 688-705. Huang, N.E., Shen, Z. and Long, S.R. (1998), “The empirical mode decomposition and the Hilbert spectrum for nonlinear and non-stationary time series analysis”, Proceedings of the Royal Society of London. Jiang, H. and He, W.W. (2012), “Grey relational grade in local support vector regression for financial time series prediction”, Expert Syst. Appl., 39(3), 2256-2262. Jiang, Q., Li, T., Yao, Y. and Cai, J.H. (2012), “Study of rolling bearing SVM pattern recognition based on correlation dimension of IMF”, Proceedings of the 2nd International Conference on Intelligent System Design and Engineering Application (ISDEA). Konar, P. and Chattopadhyay, P. (2011), “Bearing fault detection of induction motor using wavelet and Support Vector Machines (SVMs)”, Appl. Soft. Comput., 11(6), 4203-4211. Lei, Y.G., He, Z.J., Zi, Y.Y. and Chen, X.F. (2008), “New clustering algorithm-based fault diagnosis using compensation distance evaluation technique”, Mech. Syst. Signal Proc., 22(2), 419-435. Loparo, K.A. (2012), Case western reserve university bearing data center: http://csegroups.case.edu/bearingdatacenter/home. Minh, H.Q., Niyogi, P. and Yao, Y. (2006), “Mercer’s theorem, feature maps, and smoothing”, Proceedings of the 19th Annual Conference on Learning Theory, Pittsburgh, United states. Rafiee, J., Arvani, F., Harifi, A. and Sadeghi, M.H. (2007), “Intelligent condition monitoring of a gearbox using artificial neural network”, Mech. Syst. Signal Pr., 21(4), 1746-1754. Shen, Z.J., He, Z.J., Chen, X.F., Sun, C. and Liu, Z.W. (2012), “A monotonic degradation assessment index of rolling bearings using fuzzy support vector data description and running time”, Sensors, 12(8), 10109-10135. Smola, A.J. and Schölkopf, B. (2004), “A tutorial on support vector regression”, Stat. Comput., 14(3), 199-222. Vapnik, V.N. (1995), The nature of statistical learning theory, Springer, Berlin. Wang, D., Miao, Q. and Kang, R. (2009), “Robust health evaluation of gearbox subject to tooth failure with wavelet decomposition”, J. Sound Vib., 324(3-5), 1141-1157. Wang, D., Tse, P., Guo, W. and Miao, Q. (2011), “Support vector data description for fusion of multiple health indicators for enhancing gearbox fault diagnosis and prognosis”, Meas. Sci. Technol., 22(2), 025102. Wang, S.B., Huang, W.G. and Zhu, Z.K. (2011), “Transient modeling and parameter identification based on wavelet and correlation filtering for rotating machine fault diagnosis”, Mech. Syst. Signal Pr., 25(4), 1299-1320. Widodo, A. and Yang, B.S. (2007), “Support vector machine in machine condition monitoring and fault diagnosis”, Mech. Syst. Signal Pr., 21(6), 2560-2574. Wong, W.T., and Hsu, S.H. (2006), “Application of SVM and ANN for image retrieval”, Eur. J. Oper. Res.,
Recognition of rolling bearing fault patterns and sizes based on two-layer… 173(3), 938-950. Yan, R.Q. and Gao, R. (2009), “Base wavelet selection for bearing vibration signal analysis”, Int. J. Wavelets Multiresolut. Inf. Process., 7(4), 411-426. Zhao, S.L. and Zhang, Y.C. (2008), “SVM classifier based fault diagnosis of the satellite attitude control system”, Proceedings of the 2008 International Conference on Intelligent Computation Technology and Automation. Zhu, D.C., Feng, Y.P., Chen, Q. and Cai, J.B. (2010), “Image recognition technology in rotating machinery fault diagnosis based on artificial immune”, Smart. Struct. Syst., 6(4), 389-403.
CY