proposed method selects valid regions and estimates the degrees of rolling and pitching ...... Seoul, Korea, in 1979, and the M.S. degree in data structures and ...
IEEE TRANSACTIONS ON SYSTEMS, MAN, AND CYBERNETICS—PART B: CYBERNETICS, VOL. 38, NO. 1, FEBRUARY 2008
233
Recognizable-Image Selection for Fingerprint Recognition With a Mobile-Device Camera Dongjae Lee, Kyoungtaek Choi, Heeseung Choi, and Jaihie Kim, Member, IEEE
Abstract—This paper proposes a recognizable-image selection algorithm for fingerprint-verification systems that use a camera embedded in a mobile device. A recognizable image is defined as the fingerprint image which includes the characteristics that are sufficiently discriminating an individual from other people. While general camera systems obtain focused images by using various gradient measures to estimate high-frequency components, mobile cameras cannot acquire recognizable images in the same way because the obtained images may not be adequate for fingerprint recognition, even if they are properly focused. A recognizable image has to meet the following two conditions: First, valid region in the recognizable image should be large enough compared with other nonrecognizable images. Here, a valid region is a wellfocused part, and ridges in the region are clearly distinguishable from valleys. In order to select valid regions, this paper proposes a new focus-measurement algorithm using the secondary partial derivatives and a quality estimation utilizing the coherence and symmetry of gradient distribution. Second, rolling and pitching degrees of a finger measured from the camera plane should be within some limit for a recognizable image. The position of a core point and the contour of a finger are used to estimate the degrees of rolling and pitching. Experimental results show that our proposed method selects valid regions and estimates the degrees of rolling and pitching properly. In addition, fingerprint-verification performance is improved by detecting the recognizable images. Index Terms—Fingerprint, image selection, mobile device, pitching, pose estimation, quality estimation, rolling.
I. I NTRODUCTION
R
ECENTLY, the performance of mobile devices, such as cellular phones and personal digital assistants (PDAs), has improved dramatically. Mobile devices are now able to store large amounts of information. In addition, applications of these mobile devices have been broadened to include services requiring security functions, e-banking, e-commerce, etc. These have caused mobile-device manufacturers to install more secure authentication methods than the simple conventional personal-identification-number-based method. To satisfy these demands, some contemporary mobile devices adapt the fingerprint-verification function. These devices embed extra
Manuscript received October 12, 2006; revised April 30, 2007. This work was supported by the Korea Science and Engineering Foundation (KOSEF) through the Biometrics Engineering Research Center, Yonsei University, Korea. This paper was recommended by Associate Editor N. Ratha. D. Lee is with the Embedded S/W Center, System LSI, Samsung Electronics Company, Ltd., Gyeonggi-Do 446 711, Korea. K. Choi, H. Choi, and J. Kim are with the Biometrics Engineering Research Center, School of Electrical and Electronic Engineering, Yonsei University, Seoul 120-749, Korea. Color versions of one or more of the figures in this paper are available online at http://ieeexplore.ieee.org. Digital Object Identifier 10.1109/TSMCB.2007.908869
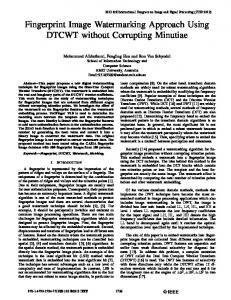
Fig. 1. Image formation geometry.
sensors to capture fingerprint images at low costs. However, additional sensor increases the cost of the mobile device because new product design and platform development are additionally required. To reduce the costs, built-in cameras can be used to obtain the fingerprint images. This approach is very attractive because additional hardware costs are unnecessary, and modern cameras that are built in mobile devices can already provide high-resolution and close-up images. Once a built-in camera is used as the input device, the acquisition of suitable images for fingerprint verification is the fundamental step. Generally, the most accurately focused images have the best quality, and autofocusing has proven to be useful in this aspect. Most autofocusing methods consist of two steps: First, a focus measurement (FM) is calculated at several different lens positions, and then, the lens is moved to the maximum focus-measurement position [1], [2]. This method is defined as the lens-moving method. The basic image formation geometry is shown in Fig. 1. The lens intercepts light rays radiated by the object point P . After refraction, these light rays converge at a point Q on the image sensor. The relationship among the object distance u, the focal distance of the lens f , and the image distance v can be described by the following Gaussian lens law: 1 1 1 = + . f u v
(1)
If the object point P is exactly focused, two conditions are satisfied: The image distance v is equal to the sensor distance s, and the image plane corresponds to the sensor plane. However, if the sensor plane is displaced from the image plane by a distance s − v, the object point P is blurred over the circular region Q� with the radius R on the sensor plane. The distribution of light energy over this circular region can be modeled
1083-4419/$25.00 © 2007 IEEE
234
Fig. 2.
IEEE TRANSACTIONS ON SYSTEMS, MAN, AND CYBERNETICS—PART B: CYBERNETICS, VOL. 38, NO. 1, FEBRUARY 2008
Rolling model. Rolling is defined as the right or left rotation of a finger.
using physical optics, and the following 2-D Gaussian function is often used to approximate this physical model [3], [4]: 2
B(x, y) = √
2
− x +y 1 2 e 2σb . 2πσb
(2)
The focused images contain more high-frequency components than the defocused images. Previous researches have proposed FMs that have used this property. The Tenengrad method estimates the gradient at each image point and simply sums all these magnitudes [5]. The sum-modified Laplacian method (SML) obtains the absolute value of each second partial derivative [6]. The sum-modulus difference method (SMD) sums the first intensity differences between the neighboring pixels along a scanned line [7]. While most algorithms are based on the sharpness functions evaluated by a gradient, there are also other approaches, for example, the wavelet [8], discrete-cosine-transform [9], median-filter [10], and absolutecentral-moment [11] approaches. However, the autofocusing algorithms present some restrictions for fingerprint-image acquisition in mobile devices; for example, users should place their fingers in correct positions to obtain suitable images. The size of the fingerprint in the image changes according to the distance between the finger and the lens. If a finger is located too far from or too close to a lens, the input image is blurred and may not be suitable for recognition. Since the location of each finger can be fixed using special tools, this problem may be solved easily. However, because the use of additional tools increases cost and enlarges the size of mobile device, the finger-moving method, not using such tools with a fixed-lens position, is more useful than the lens-moving method introduced in [1] and [2]. Although the finger-moving method is used, exterior environmental conditions can still affect the quality of the input image. Illumination greatly influences the quality, sometimes making a focused image unusable for fingerprint recognition. Consequently, the quality of input images as well as the focus conditions should be checked together. The finger producing an input image may also be rolled rotationally by left–right and/or pitched back-and-forth, as shown in Figs. 2 and 3, respectively. Low degrees of rolling or pitching may be acceptable, but high degrees make the fingerprint matching difficult because the common area between the enrolled and input fingerprint
Fig. 3.
Pitching model. Pitching is defined as a longitudinal tilting of a finger.
images is reduced. Hence, the degrees of rolling and pitching must be considered adequately when selecting a recognizable fingerprint image. In this paper, we introduce a recognizable-image selection algorithm which considers the aforementioned problems. The proposed algorithm consists of three main components: a focusmeasurement block, a quality-estimation block, and a poseestimation block. The focus-measurement block estimates the focus of the input image using the proposed variance-modifiedLaplacian of Gaussian (VMLOG) method. This method is similar to the conventional methods that use second derivatives. However, this method adapts specialized filter coefficients to ridge patterns and estimates the focus of the blocks to extract valid regions. The ridgeness of valid blocks is determined by using the quality index (QI) in the quality-estimation block. The QI uses the coherence (Coh) and symmetry (Sym) values of the gradient distribution. This measurement distinguishes focused regions from nonfocused regions and removes these nonfocused regions. The pose-estimation block estimates the degrees of pitching and rolling. The pose is estimated by using a core point and the contour of a finger. Images with a large pose variation are discarded because this decreases the size of a valid region. When the input image satisfies the focus, quality, and pose conditions, it can be classified as a recognizable image. In the following sections, we will describe the proposed image selection algorithm in detail. Section II mainly discusses the focus-measurement method. Section III presents the qualityestimation algorithm. In Section IV, we will describe how to estimate the rate of the pose. Detailed experimental results and analysis are presented in Section V, and conclusion is drawn in Section VI. II. F OCUS E STIMATION A close-up is indispensable when obtaining fingerprint images with a mobile-device camera. Focusing in close-ups is affected by the shape of the object, which is not such a critical factor in longer shots. As shown in Fig. 4, it is very difficult to place a finger, which has a deep-curved surface along a focused plane, since the depth of field (DOF) is very small in a close-up mode. The area perpendicular to the optical axis is well focused, but the curved surface becomes less focused as the slope increases. If only the well-focused area is regarded as a valid region, the usable area may be
LEE et al.: RECOGNIZABLE-IMAGE SELECTION FOR FINGERPRINT RECOGNITION
235
Fig. 5. Comparison of the normalized focus-value curves using the proposed and conventional methods: Solid line—value in finger region; dashed line—value in background region. Fig. 4.
Shape from focus.
insufficient for matching. Hence, our algorithm enlarges the valid region by including slightly defocused regions which can be divided into ridges and valleys by human inspection. To do this (unlike the conventional methods which calculate the focus of an entire image), the proposed method calculates the focus of each block and then decides whether it is valid or not. A. Focus Measurement High-frequency selection methods are generally used to measure the degree of focus [5]–[7]. These methods use first or second partial derivatives with respect to the horizontal and vertical directions. Practically, these methods are simple but effective in estimating the degree of focus. Although they consider high frequency effectively, they do not consider repeatable patterns like ridges and valleys sufficiently. This paper proposes the VMLOG method to effectively estimate the degree of focus in repeatable patterns. If I(x, y) is an input image and G(x, y) is a Gaussian filter, the modified LOG can be expressed as follows: � ∇2M [G
∗ I] = max
∂ 2 (G ∗ I) ∂ 2 (G ∗ I) , ∂x2 ∂y 2
� (3)
where ∗ is the convolution operator. To accommodate for possible variations in the size of the repeatable patterns, we used a variable spacing (step) between the pixels. The discrete approximation to the modified LOG is computed as follows: MLOGx =
N �
ωk I(x − k × step, y)
(4)
ωk I(x, y − k × step)
(5)
k=−N
MLOGy =
N � k=−N
MLOG = max{MLOGx , MLOGy }
(6)
where ω0 is positive, and the other kernels are negative. The values of the kernels and the step are decided by the intervals of the repeatable patterns. Finally, the FM is computed as the variance of the modified LOG values in a given block as follows: VMLOG = VAR{MLOG}
(7)
where VAR{} represents a variance operator. We used this FM to decide whether each block is focused or not. In our previous work [12], we compared the proposed VMLOG method with other conventional FMs using the respective normalized focus values with test sequences. Fig. 5 shows the normalized focus values of the finger and background regions. As shown in Fig. 5, the VMLOG method has the widest width at the distance between the cross points of the curves of the finger and background regions. This is because the parameters of the VMLOG method are properly set to the intervals of the repeatable line patterns. This means that the VMLOG method is more useful than other FMs because it can differentiate the finger regions from the background regions in wider object-distance ranges. This experimental result is used to determine the threshold in deciding whether each block is focused or not.
B. Blur Model The degree of blur is similar over the whole area in longshot images. However, in close-ups, the degree of blur between the object area and the background is very different. This property can be adapted to differentiate the fingerprint regions from the background regions. The degree of blur caused by the distance between the lens and an object is described in this section. u0 is the distance from the object to the lens, and v0 is the distance between the lens and the image plane when the image is focused exactly. u and v are the distances when the image is defocused. f , H, and R are the focal length, the height of any point of the object, and the radius of the
236
IEEE TRANSACTIONS ON SYSTEMS, MAN, AND CYBERNETICS—PART B: CYBERNETICS, VOL. 38, NO. 1, FEBRUARY 2008
spreads widely over the entire direction. The proposed method estimates the quality of the image blocks by using these properties. The QI consists of Coh and Sym. Coh is defined as follows [19]: (Gxx − Gyy )2 + 4G2xy . (9) Coh = Gxx + Gyy In this expression Gxx = Gyy = Fig. 6. Blur model. When u is less than u0 and greater than f , the rate of increase of blur is significant. On the other hand, the rate of increase of blur saturates as the object distance increases.
blurred region, respectively. The blur effect is modeled as follows: � � H v0 − f , u > u 0 u−f � �u (8) R= H f − v 0 , f < u < u0 . u−f u Fig. 6 is the graphical representation of (8). When an object is focused, u is equal to u0 , and R is equal to zero. When u is less than u0 and greater than f , the rate of increase of blur is significant. On the other hand, the rate of increase of blur saturates as the object distance increases. III. Q UALITY E STIMATION Although the FM estimates whether each block is focused or not, it cannot decide whether each focused block includes a fingerprint pattern. The quality-estimation process must decide whether a given block includes repeatable line patterns (like ridges and valleys) or not. There are many previous works that deal with estimating the quality of the fingerprint images. Hong et al. [13] modeled the ridge and valley patterns as sinusoidal waves and calculated amplitude, frequency, and variance to determine the quality of the fingerprint images. Yao et al. [14] computed the mean and the variance of a subblock of the fingerprint images to measure the quality. Bolle [15] proposed a method that used the ratio of the directional region to the nondirectional region. Lee et al. [16] proposed the model-based quality estimation of the fingerprint images. These methods are unsuitable for low-quality images directly obtained from the camera because those images have many noises, low contrast areas, and irregular illuminated regions. In this paper, we propose the simple and effective quality-estimation method using the characteristics of the repeatable line patterns. This method is based on the gradient distribution. Here, the gradient distribution is what represents the number of pixels with the same gradient magnitude in the plane whose x- and y-coordinates are the gradient magnitudes of x- and y-directions. As shown in Fig. 7, the gradient distribution of an ideal fingerprint is perpendicular to the direction of ridges, coherent, and symmetrical. However, the gradient distribution of the low-frequency and general images, which do not include the repeatable line patterns, is asymmetrical or
Gxy =
� � �
G2x
(10)
G2y
(11)
Gx Gy
(12)
are the estimates for the variances and crosscovariance of Gx and Gy . Here, Gx and Gy are the gradients of the x- and y-directions, respectively. Sym is defined as follows: Sym = 1 −
|Np − Nn | Np + N n
(13)
where Np is the number of gradients located above the direction line, and Nn is the number of gradients located below the direction line [Fig. 7(d)]. QI is expressed by using the aforementioned two values as follows: QI = ω1 Coh + ω2 Sym
(14)
where ω1 and ω2 are the constant weights predefined as the characteristics of the input devices. IV. P OSE E STIMATION Even if a finger is located in the focused position, the useful area for recognition can be changed by rolling and pitching of a finger. Additional devices can be used to fix the location of the finger, but they are hard to be accepted in a typical mobile device for lack of space. The input images are focused at a limited range since the DOF is very short in a close-up mode. Hence, both the recognizable area in each image and the overlapped area between images in different poses are reduced, as shown in Fig. 10. Additionally, although the overlapped common area between the images in different poses is large enough, scale variations exist in proportion to the distance between the lens and the surface of a finger. Because this degrades matching performance, the pose variations must be estimated in order to decide whether the input finger image is recognizable or not. This paper proposes methods to estimate the degrees of rolling and pitching by using a contour and a core point of a finger. A. Contour Extraction Generally, a contour is defined as the general shape or outline of an object. This paper refers to the outline of a finger as its
LEE et al.: RECOGNIZABLE-IMAGE SELECTION FOR FINGERPRINT RECOGNITION
237
Fig. 7. Example images and their gradient distributions. (a) Ideal fingerprint image. (b) Low-frequency image. (c) General image. (d)–(f) Gradient distributions of (a)–(c). Red line—ridge direction.
Fig. 8.
Finger contour extraction. (a) nth frame image. (b) n − 1th frame image. (c) SIP image. (d) SIN image. (e) DI image. (f) Foreground region.
contour. A contour can be obtained by using the difference of sequential images [17]. If this difference is calculated directly by using one threshold, the difference information may be limited. Hence, this paper uses two binary subtraction images, as shown in Fig. 8. The binary subtraction images SIP (x, y) and SIN (x, y) between the frames In (x, y) and In−1 (x, y) are obtained as follows: � SIP (x, y) = � SIN (x, y) =
1, 0,
if In (x, y) − In−1 (x, y) > TP otherwise
1, 0,
if In−1 (x, y) − In (x, y) > TN (16) otherwise.
(15)
The binary difference image DIn (x, y) is calculated as follows: � DIn (x, y) =
1, if |SIP (x, y) − SIN (x, y)| > TD 0, otherwise.
(17)
A morphological operator is used to grow the foreground regions. After that, the largest foreground region remains intact, but the other smaller foreground regions are changed into background regions through labeling and size filtering. The original background regions are reconstructed using the same process. Finally, the contour of the finger is extracted from an outer boundary of the foreground region, and the direction of
238
IEEE TRANSACTIONS ON SYSTEMS, MAN, AND CYBERNETICS—PART B: CYBERNETICS, VOL. 38, NO. 1, FEBRUARY 2008
Fig. 9. Rolling-estimation model. As the position of the core point approached to the center of each finger, the rolling rate decreased to “zero”; otherwise, the rolling rate increased to “one.”
Fig. 10. Size variation of valid region by pitching. (a) Ideal input. (b) Pitched input.
the finger is calculated through principal component analysis of the foreground region [18]. B. Core Detection Many algorithms have been proposed for the detection of singular points in fingerprint images [19]–[22]. In this paper, the Poincare index is used because the coarse position is enough to estimate the pose of each finger. We use only the upper core point for pose estimation. At the core point, the Poincare index is 1/2. The Poincare index at the pixel (i, j), which is enclosed by a digital curve with Np points, is computed as follows [22]: Poincare(i, j) =
Np −1 1 � ∆(k) 2π
if |δ(k)| < if |δ(k)| ≤ − π2 otherwise
mod
Np
(19) (20) (21)
where Px () and Py () represent the x- and y-coordinates of the closed digital curve with Np pixels. O(i, j) represents the local ridge orientation at the pixel (i, j). All core-detection procedures are executed only in valid blocks. C. Rolling Estimation Rolling is defined as the right or left rotation of a finger (Fig. 2). As shown in Fig. 9, the rolling rate can simply be estimated by using both side contours and a core point. In the figure, PC is defined as the core point. PL and PR represent the cross points where the line, which crosses the core point and is perpendicular to the direction of a finger, meets the contour of the finger. DL denotes the distance between PC and PL , whereas DR denotes the distance between PC and PR . By using these notations, the rolling rate (Rrate ) can be represented as follows: Rrate =
As the position of the core point approaches to the center of each finger, the rolling rate decreases to “zero”; otherwise, the rolling rate increases to “one.” D. Pitching Estimation
π 2
δ(k) = O (Px (k � ), Py (k � ))−O (Px (k), Py (k)) k � = (k + 1)
Pitching-estimation model.
(18)
k=0
δ(k), ∆(k) = π + δ(k), π − δ(k),
Fig. 11.
|DL − DR | . DL + DR
(22)
Pitching is defined as the longitudinal tilting of a finger (Fig. 3). When a finger is pitched, the range of the object distance, which is the distance between the lens and the object point, is broadened while the DOF is fixed as usual (Fig. 10). Therefore, as the pitching rate increases, the valid region is reduced, and the input image can be classified as an unrecognizable image. Although the pitching rate is small enough to obtain a large valid region, the input image is not always recognizable. If a core point is located near the edge of the valid region or not located in the valid region, the image has a bad influence on matching. Therefore, to obtain a recognizable image, the following two conditions must be satisfied simultaneously: First, the pitching rate must be small enough to obtain a large valid region. Second, a core point must be located in the valid region and far from the edge of the valid region. The pitching rate (Prate ) can be approximated as follows: Prate = N −
DU + DB DL + DR
(23)
where N is greater than the ratio of the finger’s width and the vertical length of the valid region. DU and DB represent the distances between the core point and each boundary line (LU and LB ), as shown in Fig. 11. LU and LB represent the upper and lower boundary lines of the valid region, respectively. They are determined when the width of the valid region is larger than half the width of the finger. As the distance between the
LEE et al.: RECOGNIZABLE-IMAGE SELECTION FOR FINGERPRINT RECOGNITION
239
Fig. 12. Sample images of SDB-I. The state and the object distance of each image are as follows. (a) The defocused image at 25 mm, (b) the defocused image at 30 mm, (c) the slightly defocused image at 35 mm, (d) the well-focused image at 40 mm, (e) the slightly defocused image at 45 mm, and (f) the defocused image at 50 mm.
two boundary lines decreases, the Prate increases, whereas it decreases if the distance increases. The position of the core point can be estimated by using the sum and the difference between DU and DB as follows: PPOS =
|DU − DB | . DU + DB
(24)
As the core point approaches the vertical center of the valid region, the PPOS decreases. Conversely, the PPOS increases if a core point is located far from the vertical center of the valid region. V. E XPERIMENTAL R ESULTS A development board for a PDA and a megapixel camera were used to test the proposed algorithm. The PDA board included an ARM 920T core processor and contained 64 MB of main memory. In addition, a point light source was used to reduce the effect of exterior illuminations. The size of the obtained images was 640 × 512 pixels. The focal length f was 5.25, and the lens position was manually adjusted to focus each finger. The sensor distance v0 was set to 6 mm, whereas the image distance u0 was set to 42 mm. A. Databases We created four fingerprint databases; each database was collected for different purposes, and the size of each database was also different. All databases were collected from indoor office environment. For the FM and the quality-estimation experiment, Samsung database I (SDB-I) was collected by changing the object distance. It consists of 60 image sequences, and sample images are shown in Fig. 12. The thumb and the forefinger of both hands (four fingers in total) of 15 volunteers were acquired. Each image sequence was obtained while a finger moved from 20 to 55 mm at intervals of 5 mm.
For the pose estimation, the SDB-II and the SBD-III were collected. Each database consists of 30 image sequences, respectively, and sample images are shown in Fig. 13. The thumb and the forefinger of the left hands (two fingers in total) of 15 volunteers were acquired. The SDB-II was collected while the fingers were rolling, whereas the SDB-III was obtained while the fingers were pitching. The SDB-IV was collected to evaluate the verification performance. It consists of 1200 fingerprint images from 60 different fingers with ten fingerprint-image pairs for each finger. The thumb and the forefinger of both hands (four fingers in total) of 15 volunteers were acquired. Before image capturing, all volunteers were trained to obtain recognizable images during a given length of time. Each volunteer moved his or her finger back and forth until the proposed image selection algorithm captured an image pair. Each image pair was captured when the RVI was greater than the TVI . In addition, the captured images were not restricted by the rolling and pitching angles. The average capture time was 1.27 s.
B. FM and Quality Estimation The proposed algorithm was evaluated using the SDB-I. The experiment consisted of two steps: valid block selection and recognizable-image selection. For valid block selection, we chose well-focused images from each image sequence. Each block in the selected images was manually categorized as a valid block or an invalid block. If the ridges and the valleys in a block were distinguishable by human inspection, the block was classified as a valid block; otherwise, the block was regarded as invalid. To evaluate the FM and the QI, we compared the manually classified results with the outputs of the FM and the QI. There were two types of errors: a type I error that misjudged a valid block as an invalid block and a type II error that misjudged an invalid block as a valid block. Table I shows the error rates of each case.
240
IEEE TRANSACTIONS ON SYSTEMS, MAN, AND CYBERNETICS—PART B: CYBERNETICS, VOL. 38, NO. 1, FEBRUARY 2008
Fig. 13. Sample images of SDB-II and SDB-III. (a)–(h) Rolling images. (i)–(p) Pitching images. TABLE I ERROR RATE OF THE VALID BLOCK SELECTION
decreased. When the total error rate was at a minimum, the threshold values for the FM and the QI were decided and used to judge whether the test block was a valid block or not. For the recognizable-image selection, we used the ratio of valid blocks to finger blocks as follows:
RVI = When using the FM, the rate of the type II errors was comparatively high because the misjudged blocks were located in regions which had sudden intensity changes like the boundary area between the finger and background regions, the surroundings of illuminators, and some objects which had a distinguishable intensity from the surroundings. When using the QI, the rate of the type I errors was comparatively high because the blocks, which had a low quality, had an asymmetric gradient distribution and a low coherence value. In this experiment, we set the weights for Coh and Sym to 0.5 empirically. We executed one more experiment using the FM and the QI with the same weight. Compared with the average error, both types I and II errors decreased, and the total error rate also
NVB × 100. NFB
(25)
where NFB represents the number of foreground blocks. A foreground block refers to a block located in the foreground region, as shown in Fig. 8(f). NFB is obtained by using the proposed contour-extraction process. NVB stands for the number of valid blocks. A valid block refers to a block that passed the previous FM and QI experiments. The variation of RVI by the object distance is shown in Fig. 14. When RVI is about 40%, the size of the valid region is similar to that of the FVC2002 DB1 images. Hence, we set the threshold (TVI ) for RVI to 40%. By using this threshold, the object-distance range in obtaining the recognizable images is determined as between 36 and 49 mm.
LEE et al.: RECOGNIZABLE-IMAGE SELECTION FOR FINGERPRINT RECOGNITION
241
TABLE III EXPERIMENTAL RESULTS OF THE PITCHING ESTIMATION
Fig. 14. Ratio of the valid blocks by the object distance. TABLE II EXPERIMENTAL RESULTS OF THE ROLLING ESTIMATION
C. Pose Estimation The pose-estimation algorithm was tested by using the SDB-II and the SBD-III. With the rolling estimation, we evaluated the rolling rate (Rrate ), the RVI , and the core-detection rate (Rcore ) by changing the rolling angle. The Rrate was only calculated when the core was detected. The experimental results are shown in Table II. The RVI was not largely affected by the rolling angle, but the Rcore decreased rapidly as the rolling angle increased. This is because the depth of the side region of the finger increases, and the focused region decreases rapidly. When the rolling angle was greater than 40◦ or lower than −40◦ , the Rrate was not reliable because the Rcore was very low. Based on the aforementioned experiments, the threshold (Troll ) for the Rrate was determined to be 0.5. With the pitching estimation, we evaluated the pitching rate (Prate ), the core position (PPOS ), the RVI , and the coredetection rate (Rcore ) by changing the pitching angle. The Prate and the PPOS were only calculated when the core was detected. As the pitching angle increased, the increments of Prate and PPOS were enlarged because the depth range of the finger expanded and the size of the focused region was reduced abruptly. Experimental results are shown in Table III. When the variance of the pitching angle was greater than 30◦ , the Rcore and the RVI decreased dramatically. Since the RVI was also less than TVI , those images were classified as invalid images. According to these experimental results, we regarded 1.2 as the threshold (Tp.rate ) for the Prate and used 0.35 as the threshold (Tp.pos ) for the PPOS .
Fig. 15. Performance comparison with the receiver operating characteristic (ROC) curves. No rejection (�), reject overpitched images (�), reject overrolled images (×), and reject overrolled and overpitched images (�).
D. Verification Performance We executed a set of experiments, adapting the proposed algorithms to evaluate the verification performance. In addition, we used the enhancement algorithm in [23], the minutia extraction algorithm in [13], the matching algorithm in [24], and the SDB-IV. We compared the verification performances after the proposed algorithms were applied one by one. The Rrate was applied to the first evaluation. The Prate and the PPOS were applied to the second evaluation. In the third evaluation, all the features were applied. In these experiments, we used the thresholds which were determined during the previous experiments. Experimental results are shown in Fig. 15 and Table IV. The total number of genuine tests (when no rejections occurred) was ((10 × 9)/2) × 60 = 2700. The total number of false acceptance tests (when no rejections occurred) was ((60 × 59)/2) × 10 × 10 = 177 000. In terms of verification performance, the equal error rate (EER) was relatively low because the SDB-IV images were obtained after the FM and QI tests. In the experimental results with rejections, the proposed pose-estimation algorithm improved the verification performance by rejecting unrecognizable images which were largely rolled or pitched. These results show that the proposed algorithm is useful when selecting a recognizable image from the input images and rejecting the unrecognizable images efficiently.
242
IEEE TRANSACTIONS ON SYSTEMS, MAN, AND CYBERNETICS—PART B: CYBERNETICS, VOL. 38, NO. 1, FEBRUARY 2008
TABLE IV VERIFICATION PERFORMANCE: EER AND REJECTION RATE (Rreject ) BY THE POSE ESTIMATION
An analysis of the rejected images shows that overpitching occurred more frequently than overrolling (shown in Table IV). VI. C ONCLUSION This paper proposed the recognizable-image selection algorithm for a fingerprint verification system which used a mobile-device camera. The FM, the QI, and the pose estimation were used to select a recognizable image. The FM and the QI estimated whether an input image included a valid region which was large enough to be compared with the other fingerprint images. The pose estimation evaluated the rolling and pitching rates using the position of the core point and the contour of a finger. In advance, we determined the thresholds for these features through a set of experiments. To verify the usefulness of these features, we performed an analysis for the verification performance. Experimental results showed that the proposed algorithm improved the verification performance by rejecting the unrecognizable images efficiently. This paper also contributed to the progress of the touchless image acquisition method. In the conventional fingerprint image acquisition methods, a finger must be placed on the sensor. Hence, when a finger presses the sensor, an input image is deformed by pressure strength, traction, and torsion. This deformation drops down the verification performance. On the contrary, the touchless image acquisition method has the following advantages: no fingerprint deformation, no latent prints, easy and accurate enrollment, superior image quality, and improved matching performances. For these reasons, the touchless image acquisition methods have been studied actively, and some commercial products for image acquisition are available in the markets [25]–[28]. Although the currently studied touchless image acquisition method has many advantages, it is unsuitable for the mobile device because the tool for fixing a finger is necessary. This paper offers the recognizable-image selection method and makes it possible to do the fingerprint verification using the mobile-device camera without the tool for fixing a finger and an additional fingerprint sensor. During the experiments, we thought that some works should be studied further in order to be used in real life. The first thing was related to the user interface. Although a finger image was shown in the screen of a test board, new users needed time to place their fingers in the proper position because a gap existed between the finger and the lens, and also, additional tools for fixing a finger were not used. Hence, we used two knacks to reduce image acquisition time and to improve convenience. First, the screen showed not only a finger image but also displayed the quality of an input image. Second, we instructed the users to place their fingers in front of the lens closely at the
beginning and then slowly move their fingers in the opposite direction from the lens. After these, the image acquisition time was reduced rapidly. However, to be used in real life, it is necessary to study more convenient user interface methods. The second thing was that our system always requires a point light source. In typical cases, a recognizable fingerprint image could not be captured without a light source because of the sensibility of the camera and the effect of exterior illuminations. This is also the same for the ordinary optical touch sensors for fingerprint recognition. Therefore, to increase the capture rate of the recognizable images, studies about the wavelength range and the intensity of the light source are necessary to enhance performance. Finally, the conventional matching algorithm could not sufficiently handle the pose and scale variations that exist in mobile-device environments. Hence, the matching algorithm, which is invariant to the pose and scale variations, should be studied further in order to improve performance. R EFERENCES [1] K. Ooi, K. Izumi, M. Nozali, and I. Takeda, “An advanced auto-focus system for video camera using quasi condition reasoning,” IEEE Trans. Consum. Electron., vol. 36, no. 3, pp. 526–529, Aug. 1990. [2] J. H. Lee, K. S. Kim, B. D. Nam, J. C. Lee, Y. M. Kwon, and H. G. Kim, “Implementation of a passive automatic focusing algorithm for digital still camera,” IEEE Trans. Consum. Electron., vol. 41, no. 3, pp. 449–454, Aug. 1995. [3] A. Pentland, “A new sense for depth of field,” IEEE Trans. Pattern Anal. Mach. Intell., vol. PAMI-9, no. 4, pp. 523–531, Jul. 1987. [4] M. Subbarao, Machine Vision for Inspection and Measurement—Efficient Depth Recovery Through Inverse Optics. New York: Academic, 1989. [5] J. M. Tenenbaum, “Accommodation in computer vision,” “Ph.D. dissertation,” Stanford Univ., Stanford, CA, 1970. [6] S. K. Nayar and Y. Nakagawa, “Shape from focus,” IEEE Trans. Pattern Anal. Mach. Intell., vol. 16, no. 8, pp. 824–831, Aug. 1994. [7] R. A. Jarvis, “Focus optimization criteria for computer image processing,” Microscope, vol. 24, no. 2, pp. 163–180, 1976. [8] J. Widjaja and S. Jutamulia, “Wavelet transformbased autofocus camera systems,” in Proc. IEEE Asia-Pacific Conf. Circuits Syst., 1998, pp. 49–51. [9] M. Charft et al., “Focusing criterion,” Electron. Lett., vol. 27, no. 14, pp. 1233–1235, Jul. 1991. [10] K. Choi, J. Lee, and S. Ko, “New autofocusing technique using the frequency selective weighted median filter for video cameras,” IEEE Trans. Consum. Electron., vol. 45, no. 3, pp. 820–827, Aug. 1999. [11] M. V. Shirvaikar, “An optimal measure for camera focus and exposure,” in Proc. 36th Southeastern Symp. Syst. Theory, 2004, pp. 472–475. [12] D. Lee, W. Jang, D. Park, S. Kim, and J. Kim, “A real-time image selection algorithm: Fingerprint recognition using mobile devices with embedded camera,” in Proc. 4th IEEE Workshop Autom. Identification Advanced Technol., Oct. 2005, pp. 166–170. [13] L. Hong, Y. Wan, and A. K. Jain, “Fingerprint image enhancement: Algorithm and performance evaluation,” IEEE Trans. Pattern Anal. Mach. Intell., vol. 20, no. 8, pp. 777–789, Aug. 1998. [14] M. Y.-S. Yao, S. Pankanti, N. Haas, N. Ratha, and R. M. Bolle, “Quantifying quality: A case study in fingerprints,” in Proc. Workshop AutoID, Mar. 2002, pp. 126–131. [15] R. M. Bolle et al., “System and method for determining the quality of fingerprint images,” U.S. Patent 5,963,656, U.S. Pat. Off., Washington, DC, Oct. 5, 1999. [16] S. Lee, C. Lee, and J. Kim, “Model-based quality estimation of fingerprint images,” in Proc. ICB, 2006, vol. 3832, pp. 229–235. [17] R. Jain, R. Kasturi, and B. G. Schunck, Machine Vision. New York: McGraw-Hill, 1995. [18] R. C. Gonzalez and R. E. Woods, Digital Image Processing. Englewood Cliffs, NJ: Prentice-Hall, 2002. [19] A. M. Bazen and S. H. Gerez, “Systematic methods for the computation of the directional fields and singular points of fingerprints,” IEEE Trans. Pattern Anal. Mach. Intell., vol. 24, no. 7, pp. 905–919, Jul. 2002. [20] M. Kawagoe and A. Tojo, “Fingerprint pattern classification,” Pattern Recognit., vol. 17, no. 3, pp. 295–303, 1984.
LEE et al.: RECOGNIZABLE-IMAGE SELECTION FOR FINGERPRINT RECOGNITION
[21] V. S. Srinivasan and N. N. Murthy, “Detection of singular points in fingerprint images,” Pattern Recognit., vol. 25, no. 2, pp. 139–153, Feb. 1992. [22] A. K. Jain, S. Prabhakar, and L. Hong, “Multichannel approach to fingerprint classification,” IEEE Trans. Pattern Anal. Mach. Intell., vol. 21, no. 4, pp. 348–359, Apr. 1999. [23] W. Jang, D. Park, D. Lee, and S. Kim, Fingerprint Image Enhancement Based on a Half Gabor Filter, vol. 3832. New York: Springer-Verlag, 2006, pp. 258–264. [24] D. Lee, K. Choi, and J. Kim, “A robust fingerprint matching algorithm using local alignment,” in Proc. Int. Conf. Pattern Recog., Aug. 2002, vol. 3, pp. 803–806. [25] Y. Song, C. Lee, and J. Kim, “A new scheme for touchless fingerprint recognition system,” in Proc. Int. Symp. Intell. Signal Process. Commun. Syst., Nov. 2004, pp. 524–527. [26] TBS Touchless Fingerprint Sensor. [Online]. Available: http://www. tbsinc.com [27] G. Parziale, E. Diaz-Santana, and R. Hauke, The surround imagerTM: A multi-camera touchless device to acquire 3D rolled-equivalent fingerprints, vol. 3832. New York: Springer-Verlag, 2006, pp. 244–250. [28] Touchless Fingerprint Sensor. [Online]. Available: http://www.tst-ag.de/
Dongjae Lee received the B.S. and M.S. degrees in electrical and electronic engineering from Yonsei University, Seoul, Korea, in 1997 and 1999, respectively, where he is currently working toward the Ph.D. degree in electrical and electronic engineering. He is currently working as a Senior Engineer with the Embedded S/W Center, System LSI, Samsung Electronics Company, Ltd., Gyeonggi-Do. His research interests include biometrics, image processing, computer vision, and pattern recognition.
243
Kyoungtaek Choi received the B.S. degree in electrical and electronics engineering from Chung-ang University, Seoul, Korea, in 2001, and the M.S. degree in electrical and electronic engineering from Yonsei University, Seoul, in 2003, where he has been working toward the Ph.D. degree in electrical and electronic engineering since 2003. Since 2002, he has been a Research Member with the Biometrics Engineering Research Center, School of Electrical and Electronic Engineering, Yonsei University. His research interests include computer vision, biometrics, image processing, and pattern recognition.
Heeseung Choi received the B.S. and M.S. degrees in electrical and electronic engineering from Yonsei University, Seoul, Korea, in 2004 and 2006, respectively, where he is currently working toward the Ph.D. degree in electrical and electronic engineering. He has been a Research Member with the Biometrics Engineering Research Center, School of Electrical and Electronic Engineering, Yonsei University. His research interests include computer vision, biometrics, image processing, and pattern recognition.
Jaihie Kim (S’81–M’84) received the B.S. degree in electronic engineering from Yonsei University, Seoul, Korea, in 1979, and the M.S. degree in data structures and the Ph.D. degree in artificial intelligence from Case Western Reserve University, Cleveland, OH, in 1982 and 1984, respectively. Since 1984, he has been a Professor with the School of Electrical and Electronic Engineering, Yonsei University, where he is currently the Director of the Biometrics Engineering Research Center. His research areas include biometrics, computer vision, and pattern recognition. Prof. Kim is currently the Chairman of the Korean Biometric Association and the President-Elect of the Korean Institute of Electronic Engineers.