On the other hand, software development engineers have to .... software development engineer, and each item as each .... Lean Software Developmentï¼LSDï¼.
Recommendation of Software Technologies Based on Collaborative Filtering
Tomohiro Akinaga, Naoki Ohsugi, Masateru Tsunoda, Takeshi Kakimoto, Akito Monden, Ken-ichi Matsumoto Graduate School of Information Science, Nara Institute of Science and Technology 8916-5 Takayama, Ikoma, Nara 630-0192, Japan +81 743 72 5312 { tomohi-a, naoki-o, masate-t, takesi-k, akito-m, matumoto } @is.naist.jp
Abstract Software engineers have to select some appropriate development technologies to use in the work; however, engineers sometimes cannot find the appropriate technologies because there are vast amount of options today. To solve this problem, we propose a software technology recommendation method based on Collaborative Filtering (CF). In the proposed method, at first, questionnaires are collected from concerned engineers about their technical interest. Next, similarities between an active engineer who gets recommendation and the other engineers are calculated according to the technical interests. Then, some similar engineers are selected for the active engineer. At last, some technologies are recommended which attract the similar engineers. An experimental evaluation showed that the proposed method can make accurate recommendations than that of a naïve (non-CF) method. Keywords: information retrieval, similarity computation algorithms, recommender systems, education
1.
Introduction
Today, there are vast amount of software development technologies. A report of Thomson Corporation said that there are 4,700,000 software technologies patented in the world in 2002 [11]. In addition to them, there are many unpatented software technologies, such as Capability Maturity Model for Software (SW-CMM) [8] and eXtreme Programming (XP) [1]. Many new technologies are developed every day, so number of them must increase. On the other hand, software development engineers have to select some appropriate development technologies to use in the work. There are two main reasons. First, al-
though each technology has possibility to improve development productivity and software quality, its effectiveness depends on context. For example, SW-CMM is a famous software process model used to construct capability for improving the process. This model is more helpful for large organizations than small ones [2]. Therefore, effectiveness of an agile method like XP is higher than SW-CMM for engineers who work in small company. Second, the engineers have not enough time to learn many technologies. Engineers spend a considerable amount of time on work about developing software products, such as discussing, designing, coding and testing. In the 2004’s report, Japanese Ministry of Economy, Trade and Industry (METI) said that embedded software engineers spent 160 hours or more for the work per a month; on the other hand, they could use only 200 hours or less for learning per a year [4]. However, engineers sometimes cannot find the appropriate technologies because the number of the technologies is too large. The engineers are unaware of some effective technologies because the technologies are hidden with vast amount of the others. Some lucky engineers may find some names of previously unknown technologies with journals, websites or search engines; yet they have to gather additional information of the found technologies because they do not know effectiveness of the technologies. Finally, they can find some effective technologies if their efforts paid off. Or, all of the found technologies may be useless if things turn out bad. In order to solve this problem, we propose a recommendation method which helps engineers to find technologies which seem to be suitable for their work. Our recommendation method is based on collaborative filtering (CF) [5], [7], [10]. CF is considered a powerful infor-
t1
t2
…
tj
…
tb
…
tn
u1
r1,1
r1,2
…
r1,j
…
r1,b
…
r1,n
u2
r2,1
r2,2
…
r2,j
…
r2,b
…
r2,n
…
…
…
ui
ri,1
ri,2
…
…
…
ua
ra,1
ra,2
…
…
…
um
rm,1
rm,2
Fig. 1.
… …
ri,j
…
ra,j
…
… …
rm,j
ri,b
…
ri,n
…
… …
…
…
ra,b
… …
ra,n …
… …
rm,b
…
rm,n
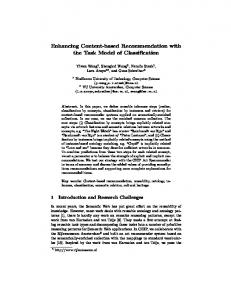
m×n table used for recommendation
mation filtering method, and has been used in recommender systems that estimate end-users’ preferable items (books, movies, tunes, etc). The system based on CF assumes that, “if users had similar evaluation to same items, they would also have similar evaluation to another items”, and the system recommends items which are highly evaluated by similar users. In our proposed method, we assume “if engineers had similar interest to same technologies, they would also have similar interest to another items”. In order to recommend useful technologies, we inquired the engineers’ interest levels for known technologies and summarized it as dataset. Using the dataset, our method automatically selects users similar to the active engineer who needs recommendation of technologies. Similar user has similar tendency of interests for technologies. Then, our method recommends technologies which similar users are interested in but are not known to the active engineer. In what follows, section 2 explains the details of Collaborative Filtering. Section 3 describes recommendation procedure and algorithms of our proposed method. Section 4 shows an experiment to evaluate the recommendation accuracy of proposed method. In the end, section 5 discusses the conclusion and future work.
et al. proposed a basic CF algorithm known as a user-based method. User-based method makes recommendations with the following procedure: 1. After using items (Usenet articles, books, movies, etc.), users explicitly assign numeric ratings to the items. 2. A recommender system correlates the ratings in order to determine which user’s ratings are most similar to other ones. 3. The system predicts how much users will like new items, based on the ratings of similar users. 4. If these new items seem to be liked, the system recommends them to the user. Sarwar et al. [10] proposed another basic CF algorithm called item-based method. Item-based method can make recommendation with extremely sparse dataset whose ratio of rated items to whole items is only 1%. Item-based method makes recommendations with executing 2’ and 3’ instead of 2 and 3 in the above procedure respectively: 2’. A recommender system correlates the ratings in order to determine which item’s ratings are most similar to other item’s. 3’. The system predicts how much users will like new items, based on the ratings of similar items already rated by the users. Intuitively, an idea of the item-based method can be represented as a popular sentence of Amazon.com’s recommendations “Customers who bought this book also bought...”. In our proposed method, we regard each user as each software development engineer, and each item as each software development technology. We assume “if engineers had similar interest to same technologies, they would also have similar interest to another items”. We use user-based method and item-based method to recommend technologies.
3. 2.
Collaborative Filtering
Collaborative Filtering (CF) is one of the key techniques for implementing a recommender system that recommends to a user a set of candidate items which may be preferable or useful to the user. For example, Resnick et al. [9] developed GroupLens system which recommends interesting Usenet articles to users. It draws on a simple idea; people who agreed in their subjective evaluation of past articles are likely to agree again in the future. Resnick
Recommendation Method
In our method, we use the database in form of m×n matrix as shown in Fig. 1 where ui∈{u1, u2, ..., um} denotes i-th engineer, tj∈{t1, t2, ..., tn} denotes j-th technology, and ri,j∈{r1,1, r1,2, ..., rm,n} denotes rating of interest which an engineer ui has for a technology tj. Rating of technology is indicated with “not interested” (1) ,…, “very interested” (4) and larger number denotes grater interest. When an engineer does not know a technology, ri,j is set missing value.
In our recommendation method, two collaborative filtering method, user-based method and item-based method is used to recommend technologies. Recommendation with user-based method is made as follows: 1. The similarity between the active engineer ua and other engineer ui is calculated by equation (1).
∑ (r
a, j
sim (u a , u i ) =
) (
− t j × ri , j − t j
j∈T a ∩ T i
∑ (r
− tj
a, j
j∈T a ∩ T i
)
∑ (r
2
i, j
)
is calculated by equation (4).
rˆa , b =
− tj
)
2
rˆa ,b =
j∈ R a ∩ R i
)
a
+ ua
, ui )
(2)
i∈k − neighbors
In this equation, k-neighbors is a set of k engineers (similar engineers) who rates technology tb and have high similarity to the active engineer ua. Since the size of k-neighbors k affects recommendation accuracy, we varied k and adopt it which gave the highest accuracy in an experimental evaluation. ui denotes average value of rating which engineer ui has. 3. Predicted value is computed for all technologies which active engineer ua does not rate. Technologies are recommended to the active engineer, ranked by their predicted rating. Recommendation with item-based method is made as follows: 1. For a technology tb which are not rated by active engineer ua, the similarity between the technology tb and other technologies tj is calculated by equation (3). sim (t b , t j ) =
∑ (r
i ,b
i∈U b ∩ U
∑ (r
i ,b
i∈U a ∩ U
j
) (
− u i × ri , j − u i
j
− ui
)
2
j
(4)
j
3.
4.
In this equation, k-nearestTechs is a set of k technologies (similar technologies) which are rated by the active user ua and have high similarity to the technology tb. Predicted value is computed for all technologies which active engineer ua does not rate. Technologies are recommended to the active engineer, ranked by their predicted rating.
Experimental Evaluation
4.1 Dataset
− u i × sim (u a , u i )
∑ sim (u
b
(1)
(i.e. the rating of the active engineer ua for the development technology tb) is calculated by equation (2). i ,b i∈k − neighbors
∑ r × sim (t , t ) ∑ sim (t , t )
a, j j ∈ k − nearestTec hs
j ∈ k − nearestTec hs
value of ratings for technology tj. Using the similarity, rˆa ,b , the predicted value of ra,b
∑ (r
who rate technology tb and tj. Using the similarity, rˆa ,b , the predicted value of ra,b
b
In this equation, Ta and Ti denote a set of technologies which ua and ui has rated. t j denotes average 2.
2.
∑ (r
i,j
i∈U b ∩ U
)
− ui
)
2
(3)
j
In this equation, Ub and Uj denote a set of engineers
In the experiment, we made a dataset from questionnaire of 77 people which consist of 29 engineers who engage in software development, 37 graduate students who major in information science, and 11 academic researchers who research software engineering. When answering the questionnaire, an engineer answered whether he knows each technology or not. We regarded the technology is known when an engineer can explain the outline of the technology. When he knew the technology, he rated it based on his interest with 4 grades. Each grade is not interested (1), a little interested (2), interested (3), and very interested (4). Table 1 shows software development technologies written on the questionnaire and engineers’ responses. In Table 1, the column of known shows the percentage of engineer who knows each technology, and the column of interested shows the percentage of engineer who rated the technology as more than 3. For example, 97.4% of engineers know Visual Basic, and 25.3% of them are interested in it (i.e. they are rated it as 3 or 4).
4.2 Evaluation Criteria We used 5 criteria (mean absolute error, recall, precision, F1 value, and NDPM) to evaluate recommendation accuracy of the proposed method. These are often used to evaluate accuracy of CF based system [6]. Except for mean absolute error, the higher these values are, the more accurate evaluated method is. Mean absolute error (MAE) is the average of absolute
Table 1.Software development technologies written in questionnaire and engineers’ responses
Software Development Technology
Known
Interested
(%)
(%)
Software Development Technology
Known
Interested
(%)
(%)
eXtreme Programming(XP)
85.7
57.6
Pascal
92.2
12.7
SCRUM
29.9
39.1
Perl
97.4
33.3
Lean Software Development(LSD)
33.8
30.8
Ruby
88.3
32.4
Adaptive Software Development(ASD)
23.4
33.3
Python
63.6
14.3
Crystal Family
14.3
36.4
LISP
77.9
16.7
Future Driven Development(FDD)
24.7
31.6
COBOL
90.9
15.7
eXtreme Modeling(XM)
20.8
31.3
Function Point Method
88.3
50.0
RUP
72.7
41.1
COCOMO
77.9
43.3
ISO9000
83.1
31.3
COCOMOII
70.1
55.6
SW-CMM
84.4
47.7
Agile COCOMO
27.3
47.6
CMMI
84.4
52.3
Goal Question Metric(GQM)
59.7
54.3
Personal Software Process(PSP)
75.3
60.3
eXtensible Markup Language(XML)
100.0
74.0
Team Software Process(TSP)
57.1
52.3
Simple Object Access Protocol (SOAP)
75.3
41.4
UML
100.0
80.5
Web Service
98.7
50.0
PMBOK
61.0
57.4
Service Oriented Architecture (SOA)
70.1
42.6
SWEBOK
57.1
52.3
Structured design
94.8
58.9
Java
98.7
77.6
Object Oriented Design
98.7
73.7
Enterprise Java Beans(EJB)
81.8
44.4
Total Quality Control(TQC)
49.4
52.6
Java Server Pages(JSP)
81.8
42.9
Total Quality Management(TQM)
45.5
51.4
Active Server Pages(ASP)
70.1
25.9
Statistical Quality Control(SQC)
41.6
53.1
PHP Hypertext Preprocessor(PHP)
79.2
32.8
J2SE SDK
83.1
62.5
Common Gateway Interface(CGI)
90.9
37.1
Windows API
88.3
44.1
C/C++
100.0
62.3
Microsoft Foundation Classes(MFC)
64.9
34.0
.NET
96.1
37.8
Visual Component Library(VCL)
33.8
19.2
Visual Basic(VB)
97.4
25.3
Qt
29.9
30.4
K Desktop Environment (KDE)
50.6
28.2
error. Absolute error is defined as follows: Absolute Error = Actual Value - Predicted Value
(5)
Precision is a ratio of appropriately recommended technologies to entire recommended technologies, formally defined as (6), where Nr is the number of entire recommended technologies, and Na is the number of appropriately recommended technologies. We regarded Nr is the number of technologies whose predicted rate is more than a certain threshold., and Na is the number of technologies which is actually rated more than 3 and whose predicted rate is more than a certain threshold.
Precision =
Na Nr
(6)
Recall is a ratio of appropriately recommended tech-
nologies to entire technologies actually rated more than 3 by the engineer ui, formally defined as (7), where Nu is the number of entire technologies actually rated more than 3 by the engineer ui, and Na is the number of appropriately recommended technologies.
Recall =
Na Nu
(7)
F1 value is a combined criterion of recall and precision, formally defined as (8).
F1 =
2 × Precision × Recall Precision + Recall
(8)
NDPM is an evaluation metrics to measure the system performance. NDPM is calculated by comparing the difference between “order of items in ideal recommendation
100%
Table 2. Criteria at peak F1 value
80%
User-based
MAE
Recall
Precision
0.72
0.62
74%
70%
Item-Based
0.76
0.56
85%
69%
Average-Based
0.65
0.73
88%
52%
Precision
F1 Value
60% 40% 20% 0%
for the user” and “order of items in system’s recommendation for the user”. The lower number of NDPM denotes that system provides better recommendation. NDPM is formally defined as (9)…(11). ndpm(Pa , Ra ) =
∑ ∑ dpm( p
aj
, p ak , raj , rak )
j∈Pa U Ra k∈Pa U Ra
∑
∑ dpmNormalizer ( paj , pak )
(9)
j∈Pa U Ra k∈Pa U Ra
where 0 dpm ( paj , pak , raj , rak ) = 1 2
(
dpmNormalizer paj , pak
( paj > pak ) ∧ (raj > rak ) ∨ ( paj < pak ) ∧ (raj < rak ) ( ) ( ) p p r r ≠ ∧ = aj ak aj ak ( paj > paj ) ∧ (raj < rak ) ∨ ( paj < paj ) ∧ (raj > rak )
)
( (
1 paj = pak = 2 paj ≠pak
) )
(10)
0%
20%
User-based
Fig. 2.
40% 60% Recall Item-based
80%
100%
Average-based
The relation between recall and precision
cross-validation): 1. i-th engineer ui is regarded as the active engineer, and removed from the dataset. 2. ri,j is regarded as unknown, and predicted rating is computed. 3. Repeat Step 2 for all j. 4. Repeat Step 1, 2, 3 for all i. We also computed recommendation scores using a naïve (non-CF) method called average-based method to compare with proposed methods. In the average-based method, the predicted rating rˆa ,b is formally defined as (12), where N is total number of entire engineers. m
(11)
The numerator of the equation (9) is the sum of results of the function dpm on the set of ideal recommendation Pa and the set of actual predicted recommendation Ra. We assume that predicted ratings raj of the active engineer for
technologies j that are ( j ∈ Pa ) ∧ ( j ∉ Ra ) , and ideal ratings paj of the active engineer for technology j that
are ( j ∉ Pa ) ∧ ( j ∈ Ra ) , are 0. The denominator of the equation (9) normalizes the numerator to the range [0, 1].
4.3 Experimental Procedure In the experiment, we evaluated both the user-based method and the item-based method. First, we made a dataset from engineers’ rating of interest. Rating of a technology unknown to an engineer (i.e. not rated) was treated missing value. Next, we tried several CF computation algorithms and adopted the most accurate algorithms. Then, we conducted an experiment as follows (leave-one-out
∑r
i ,b
rˆa ,b =
i =1
N
(12)
4.4 Experimental Result We conducted pre-examination to set the neighborhood size, and set k as 6 for both user-based method and item-based method, since recommendation accuracy became the highest. We changed threshold to find the highest F1 value. The highest F1 value in the experiment is shown at Table 2. Other criteria at Table 2 are calculated when F1 value is the highest. Fig. 2 shows the relation between recall and precision, written with changing threshold. From Table 2, we see that item-based method has the highest F1 value and the lowest MAE of three methods. Average-based method has the lowest F1 value and the highest MAE. At Table 2, user-based method has the highest precision and average-based method has the highest recall. But at Fig. 2, the line of item-based method is almost upper position,
1.00
Also, we will implement the system based on the proposed method, and examine actual users’ evaluation for the system.
0.90 0.80 0.70
References
0.60 0.50 0.40
0.43
0.30
0.39
0.41
item base
arithmetic average
0.20 0.10 0.00 user base
Fig. 3.
Boxplots of NDPM of each method
and the line of average-based method is almost lower position. Therefore, from Table 2 and Fig. 2 we conclude that item-based method is the most accurate and average-based method is the most inaccurate. Fig. 3 shows boxplots of NDPM of each method. From the figure, we see that item-based method made the most appropriate recommendation, but user-based method made the most inappropriate recommendation. This result indicates that user-based method is not appropriate for recommendation of technology. Therefore, user-based method is more suitable for finding similar engineers than recommending useful technologies. The limitation of our experiment is that the dataset used in the experiment is a part of whole technologies. In our future work, we should make a questionnaire included more technologies and inquire more engineers to make larger dataset and confirm experimental result. In our experiment, inquired technologies are known to many engineers. However, a new technology would be rated by little engineers. We should investigate the relationship between recommendation accuracy and a number of ratings.
5.
Conclusion
In this paper, we proposed a recommendation method based on Collaborative filtering using the engineers’ interest levels for technologies. An experimental evaluation showed that the recommendation accuracy of the proposed method was higher than that of a naïve (non-CF) method. Our future work is to enlarge our dataset and to conduct an experiment using it to confirm our conclusions.
[1] K. Beck, “Extreme Programming Explained: Embrace Change,” Addison-Wesley, New York, 1999. [2] B. Boehm, and R. Turner, “Balancing Agility and Discipline: A Guide for the Perplexed,” Addison-Wesley, 2003. [3] J. S. Breese, D. Heckerman, and C. Kadie, “Empirical Analysis of Predictive Algorithms for Collaborative Filtering,” Proc. of the 14th Conference on Uncertainty in Artificial Intelligence, pp.43-52, 1998. [4] Embedded Software Development Capability Promotion Committee, “Survey of Embedded Software Development Industry Status in FY2004,” Ministry of Economy, Trade and Industry, 2004 (in Japanese). [5] D. Goldberg, D. Nichols, B. M. Oki, and D. Terry, “Using Collaborative Filtering to Weave an Information Tapestry,” Comm. of the ACM, Vol.35, No.12, pp.61-70, 1992. [6] J. Herlocker, J.A. Konstan, L.G. Terveen, and J.T. Riedl, “Evaluating collaborative filtering recommender systems,” ACM Transactions on Information Systems (TOIS), Vol.22 , No.1, pp.5-53, 2004. [7] N. Ohsugi M. Tsunoda, A. Monden, and K. Matsumoto, “Applying Collaborative Filtering for Effort Estimation with Process Metrics,” Proc. of the 5th Int’l Conf. on Product Focused Soft. Process Improvement, Springer, Berlin Heidelberg, pp.274-286, 2004. [8] M. Paulk, B. Curtis, M. Chrissis, and C. Weber, “Capability Maturity Model for Software (Version 1.1),” CMU/SEI-93-TR-024, 1993. [9] P. Resnick, N. Iacovou, M. Suchak, P. Bergstrom, and J. Riedl, ”GroupLens: An Open Architecture for Collaborative Filtering of Netnews,” Proc. ACM Conf. on Computer Supported Cooperative Work (CSCW’94), pp.175-186, Chapel Hill, North Carolina, U.S.A, Oct. 1994. [10] B. M. Sarwar, G. Karypis, J. A. Konstan, and J.T. Riedl, “Item-Based Collaborative Filtering Recommendation Algorithms,” Proc. 10th International World Wide Web Conference (WWW10), pp. 285-295, Hong Kong, May, 2001. [11] Thomson Corporation, “Thomson Derwent Patent Focus Report 2002-3,” http://scientific.thomson.com/, 2003.