Recommending Source Code for Use in Rapid Software Prototypes Collin McMillan Negar Hariri Denys Poshyvanyk College of William and Mary DePaul University College of William and Mary Williamsburg, VA 23185 Chicago, IL 60604 Williamsburg, VA 23185
[email protected] [email protected] [email protected]
Abstract—Rapid prototypes are often developed early in the software development process in order to help project stakeholders explore ideas for possible features, and to discover, analyze, and specify requirements for the project. As prototypes are typically thrown-away following the initial analysis phase, it is imperative for them to be created quickly with little cost and effort. Tool support for finding and reusing components from open-source repositories offers a major opportunity to reduce this manual effort. In this paper, we present a system for rapid prototyping that facilitates software reuse by mining feature descriptions and source code from open-source repositories. Our system identifies and recommends features and associated source code modules that are relevant to the software product under development. The modules are selected such that they implement as many of the desired features as possible while exhibiting the lowest possible levels of external coupling. We conducted a user study to evaluate our approach and the results indicated that our proposed system returned packages that implemented more features and were considered more relevant than the state-of-the-art approach. Keywords-software prototyping; domain analysis; recommender systems
I. I NTRODUCTION Rapid prototyping is a software development activity in which programmers build a prototype of a software product by iteratively proposing, reviewing, and demonstrating the features of that product [22]. It is designed to help project stakeholders explore the features they would like to include in a product, and to interact with the prototype in order to discover and specify requirements. As prototypes are generally thrown-away, they must be built quickly and inexpensively, and must provide the flexibility to easily add or remove features. Other factors, such as efficiency or portability, are less important as the prototype may not even share the same programming language or hardware platform as the final product [22]. Therefore, it is essential to minimize the manual effort involved in building prototypes, and to maximize automation and source code reuse. As such, tool support for automatically locating and reusing features from open-source repositories offers a tremendous opportunity for reducing this manual effort [22]. Rapid prototyping is often divided into a horizontal and a vertical phase [25]. In the horizontal phase, domain analysts identify an initial set of candidate features for implementation in the product. These features, which are often cursorily
Jane Cleland-Huang and Bamshad Mobasher DePaul University Chicago, IL 60604 {jhuang,mobasher}@cs.depaul.edu
defined, are presented to the stakeholders for discussion, feedback, and refinement. This activity is often supported by domain analysis tools and techniques which identify features that are common across similar or competitive software systems [12], [15], [11]. However, such approaches provide only limited information about the implementation of those features. In contrast, during the vertical phase of rapid prototyping, developers build full functionality for a selection of features identified during the horizontal phase. This provides a much richer user experience, in which project stakeholders can run the software and interact with the features in order to decide on specific use cases and to identify potential problems. To reduce programming effort and shorten time-to-market, programmers can find and reuse existing solutions for their prototypes. Source code search engines have been developed to locate implementations that are highly-relevant to a feature specified by a programmer (e.g., via a natural-language query) [20], [24]. However, although these engines are effective for locating single features, they are not designed for the more complex, yet common case, in which a prototype will incorporate a set of interacting features. As a result, existing search engines often return packages that match only a small subset of the desired features, and developers have to invest considerable effort to integrate features from several different packages and projects. Under these circumstances, the cost and effort required for a programmer to comprehend and integrate the returned source code can significantly reduce the benefits of reuse [16]. In this paper we present a novel recommender system for supporting rapid prototyping. Our system directly addresses several shortcomings of existing techniques and tools, by integrating the horizontal and vertical phases of rapid prototyping. Our approach first recommends features, and then locates and recommends relevant source code. We utilize a hybrid set of algorithms based on PageRank [17], set coverage, and Coupling Between Objects (CBO) [9] in order to maximize the coverage of features while proposing a set of packages that minimize the integration effort involved in building a prototype. We implemented the recommender system and have conducted a cross-validation user study with 31 participants to compare the effectiveness of our approach against that of
1
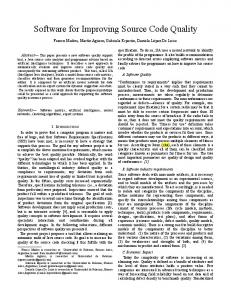
Module Extractor
Modules
Dependency Extractor
4
Module dependencies
Source Code Source Code Search Engine used to identify feature/module relationships
Software Repositories
3 Module Feature Matrix
Documentation
Feature Description Extractor
2 Feature Descriptions
6 Matched features
Feature Recommender 5
Figure 1.
8 Confirmed features Horizontal Prototyping: Feature Recommendations
Product description
Vertical Prototyping: Module Recommendations
Module 10 recommendations
7 Feature recommendations and feedback.
Overview of the architecture of our approach.
a state-of-the-art search engine, Portfolio [24]. During the study, users entered product descriptions and selected features recommended by our system. The users then evaluated the packages recommended by each of the approaches. The results from the study showed that our approach returned more of the desired features per recommendation than Portfolio, that a greater proportion of the source code was relevant to the product description, and that users spent less time evaluating the results from our approach. Our recommender and user study data are online for public use1 . II. OVERVIEW Before describing the specific details of the underlying algorithms, we provide an architectural overview of our approach. As depicted in in Figure 1, there are ten primary steps. Steps (1) and (2) focus on extracting features and modules from one or more software repositories. First, the Module Extractor retrieves software modules from one or more repositories (1). These modules are collections of source code related to a particular application or functionality, such as C# namespaces or Java packages; in this paper, we focus on Java packages. Next, the Feature Extractor discovers the set of features implemented in the repositories (2). Each feature describes a common function of the software, such as “email spam detection”. These features are discovered by analyzing the written specifications of applications in the repositories. Further details are provided in Section III. In order to formulate package recommendations, it is necessary to understand the relationships between features and modules, and also the dependencies between modules. Steps (3) and (4) therefore focus on discovering these relationships. In step (3) a source code search engine is used to identify modules that contain specific features and to 1 http://www.cs.wm.edu/semeru/prefab
Module Recommender
9 Module recommendations
produce a Module × Feature Matrix that is used as input to the Feature and Module Recommenders. In step (4) Module Dependencies are extracted through examining the source code. Further details are provided in Section III. A user then initiates a request for a recommendation by describing the required functionality of the product they intend to prototype (5). This description is parsed and then elements of the description are matched to features known by the recommender system (6). If matching features are found, they are presented to the user who is asked to confirm or reject their relevance (7). The feature recommender then generates additional feature recommendations and these are also presented to the user for feedback. These recommendations support the horizontal phase of rapid prototyping. A more complete description is provided in Section IV. Our approach also supports the vertical phase of rapid prototyping. In this phase, the selected features are sent to the Module Recommender (8), and a series of computations are performed in order to generate a set of module recommendations designed to provide high feature coverage and low external coupling (9). A detailed explanation of this process is provided in Section V. The recommended modules are then presented to the user (10). We illustrate this process from the users’ perspective with a simple scenario showing both feature and module recommendations for the rapid prototyping of a “MIDI music player.” As depicted in Figure 2(a), the product description was initially matched to features labeled “Music plays in the background” and “Sound supported”, and once these features were accepted by the user, the feature recommender suggested three additional features. All recommendations were accepted by the user. The module recommender then proposed the three packages shown on the right hand side of Figure 2(b). The projects from which the packages originate are displayed on the left. The GUI allows the user to see a
(a) Feature Recommendation and Selection
(b) Module Recommendation Figure 2.
Example of Rapid Prototyping in which the user entered the product description “MIDI music player.”
description of the project as well as browse the Java classes and source code inside the package. III. M INING P RODUCT AND F EATURE DATA In order to construct the recommender environment, two different types of data are extracted from the software repositories. First, the feature recommender requires rich textual descriptions of features to provide meaningful and descriptive information to software developers, and second, the module recommender requires high quality source code for effective rapid prototyping. Although both of these artifact types could in theory be extracted from a single repository, in practice different repositories contain different types of artifacts. This difference created the additional requirement that there be significant overlap between the features contained in each repository. A. Feature Descriptions Feature descriptions were extracted from applications in Softpedia2 . Although SoftPedia is not a source code repository; it does provide a repository of product descriptions that include marketing-like summaries and bullet-point lists of features. In the remainder of the paper we, therefore, refer to it as a repository. In general, feature descriptions are mined from product documentation. In the case of Softpedia, we extracted individual sentences from the product summary information and bulleted lists describing features 2 http://www.softpedia.com/
from 117,265 products, categorized under 21 of Softpedia’s predefined categories and 159 sub categories. Together these formed a set of 493,347 feature descriptors [11]. Many feature descriptors describe similar functionality. For example a product that “monitors CPU usage in realtime” likely provides similar functionality to one that claims to “show information about CPU usage.” Our approach therefore clusters feature descriptors in order to discover a set of meaningful features. We utilized the incremental diffusive clustering algorithm (IDC) and feature naming approach described in our prior work [11]. IDC takes an iterative approach. In each iteration the SPK-Means clustering algorithm is used to cluster the feature descriptors, and then to identify and retain the “best” cluster based on the cohesiveness and size of the cluster. This cluster’s dominant terms are then identified and removed from all feature descriptors in order to allow latent topics to emerge in subsequent clustering iterations. The clustering is repeated until no further meaningful terms remain. All identified clusters represent a single feature, and the feature is named by identifying the most representative descriptor for the cluster. Using this approach, the Softpedia data produced a set of 1,135 features. B. Source Code Modules Source code modules were extracted from 13,701 Java applications downloaded from Sourceforge3 . The modules 3 http://www.sourceforge.net/
contained 241,655 Java packages and 400 million lines of code. The large size and public accessibility of both Sourceforge and Softpedia repositories suggests a large overlap in their domains, meaning that many of the features discovered through analyzing the Softpedia documentation, are implemented in Sourceforge applications. C. Relating Features to Modules A module is considered related to a feature if that module implements the feature. In order to discover these relations, we used the Portfolio search engine [24]. Portfolio takes a natural-language query as input and locates chains of function invocations relevant to that query. For this paper, we modified Portfolio to locate Java packages, and instantiated it over the source code modules we mined from Sourceforge. Then, we used the 1,135 features identified by our IDC algorithm as queries for Portfolio. The Module × Feature matrix is a matrix where the rows are the modules, the columns are the features, and the cells indicate whether Portfolio detected that feature as implemented by the package. IV. F EATURE R ECOMMENDATION When the user provides a description of the product to be prototyped, the feature recommendation algorithm constructs an initial profile of the product by using the cosine similarity metric to match parts of the description to relevant features in our model. We established a threshold score of 0.6 in order for the product to be matched to a feature in keeping with previous practice [11]. As previously explained, these features are presented to the user in order to confirm that the matching has been performed correctly. Given the feature set of the new product, our feature recommender module identifies similar products and uses their feature profiles to make predictions about the existence of other relevant features in the new product. In our prior work we used a Product × Feature matrix, based on features found in the Softpedia products, in order to generate recommendations [11]. The objective of the recommender system was to suggest features to include in a product. In contrast, the recommender system described in this paper is designed to recommend actual source code packages. Therefore, although we utilize the algorithm defined in our previous work to recommend features [11], we use a Product × Feature matrix mined from the open-source repositories. One benefit of this approach is that recommendations are based on the actual co-occurrence of features in implemented source code, as opposed to the more abstract and incomplete descriptions of features provided by the Softpedia product descriptions. Given the Module × Feature matrix generated by the source code search engine, the feature recommender module merges the rows representing modules originating from a single product to form a binary Product × Feature matrix, M := (mi, j )P×F , where P represents the number of products mined from Sourceforge (13,701), F is the number
of features mined from Softpedia (1,135), and mi, j is 1 if and only if the feature j is implemented in product i. A. Recommending Additional Features Next, our feature recommender module generates an additional set of feature recommendations, which are presented to the user. This is accomplished using the k-Nearest Neighbor (kNN) algorithm. This method has been shown to be efficient for recommending features and requirements [7]. For the purpose of feature recommendation, the similarity of the new product and each of the existing products in the Product × Feature matrix, M, is computed and the top k (20) most similar products are selected as neighbors of the new product. The binary equivalent of cosine similarity is used to compute the similarity of the new product p with each existing product n as follows: |Fp ∩ Fn | similarity(p, n) = p |Fp | · |Fn |
(1)
where Fp denotes the set of features of product p [32]. After forming the neighborhoods, features are recommended to the new product using an approach based on Schafer’s technique [28] to predict the likelihood of feature f being relevant to product p as follows: pred(p, f ) =
∑n∈nbr(p) similarity(p, n) · mn, f ∑n∈nbr(p) similarity(p, n)
(2)
where n ∈ nbr(p) represents a neighbor of p, and mn, f is an entry in the binary matrix M indicating whether product n contains feature f . In general, prediction scores will be computed for each candidate feature, and the features with highest predictions will be recommended. B. Evaluating Feature Recommender To statistically evaluate the performance of the feature recommender based on the integration of Softpedia and Sourceforge data, we performed a standard leave-one-out cross validation experiment. Given the Product × Feature matrix, M, at each run of the experiment, a random feature is removed from one of the products and the recommendation algorithm is executed. The results are then analyzed to see if the recommender was able to recommend back the removed feature. The Hit Ratio measures the likelihood that the removed feature is recommended as part of the top N recommendations. In order to calculate the hit ratio, for each test product p, a feature f is randomly removed from the product profile and N recommendations are generated using the remaining features. If feature f is contained in the recommendation list, then the hit ratio for p is 1.0, otherwise, it is 0.0. The hit ratio of the recommendation algorithm is calculated by averaging over the hit ratio values of all the test products. Figure 3 compares the hit ratio values of our feature recommender and a random recommender for different values of N. The results show that there was a sharp
0.25
kNN
Hit Ratio
0.2
random
0.15
0.1
0.05
0 0
5
10
15
20
25
30
35
40
45
50
Number of Recommendations Figure 3.
Hit ratio comparison for kNN and Random Recommender
improvement over the random case for the early recommendations, meaning that targeted features were recommended towards the top of the list of recommendations, and that the feature recommender was effective. V. M ODULE R ECOMMENDATION The module recommender takes as input the list of features agreed upon by the user as a result of the feature recommendation process and produces a list of recommended packages for use in creating the desired rapid prototype. A. Recommender Goals Our recommendation algorithm is designed to optimize the following goals in order to minimize the cost and effort of reusing existing packages in a rapid prototype. 1) Coverage: The recommended packages should provide coverage of as many targeted features as possible. 2) Minimize number of recommended projects: The overhead involved in downloading, installing, and integrating packages from many different projects makes it preferable to construct a rapid prototype using packages drawn from as few projects as possible. Our algorithm, therefore, attempts to minimize the number of projects from which the recommended packages are drawn. 3) Minimize the external coupling of recommended packages: High external coupling decreases developer comprehension of the package, increases the effort needed to execute code in the package, and makes it difficult and costly to reuse the packages. B. Package Coupling Costs Before describing our module recommender algorithm we present our technique for computing package coupling costs. These costs are measured using the Coupling Between Objects (CBO) metric [9], in which a coupling cost is defined for each package. The total coupling cost for the
package depends upon both direct and indirect couplings of that package to other packages; however, the dependency chain of coupling costs between packages makes the cost calculation problem nontrivial. In the following section, we explain how to calculate individual coupling costs, and then to extend this metric to account for the common case in which multiple packages are selected from a single project. The dependency information between packages can be modeled as a weighted directed graph G = (V, E) with each vertex v ∈ V representing a package and each directed edge e ∈ E representing the dependency of one package to another. An edge ei, j from node vi to node v j exists if and only if one or more classes in package vi use one or more classes in package v j . The weight, wi, j , on the edge ei, j , represents the CBO between the two endpoints and is defined as the fraction of classes in vi that use at least one class in v j. Calculating the coupling cost for packages can be seen as assigning real weights to vertices in the graph, such that the weight of each vertex is a function of the weights on the outgoing edges as well as the weights assigned to all of its outgoing neighbors. In this paper, a variation of the PageRank algorithm [17] is used to compute the vertices weights. The PageRank algorithm was first developed to support the hyperlink analysis of web pages, such that each page in the web graph is assigned a numerical weight, between 0 and 1, known as its PageRank, which represents the relative importance of the page. The PageRank is then used by the search engine to sort and rank the results for a given query. The PageRank algorithm is commonly referred to as the “random surfer model”. When a random surfer reaches a page with n outgoing links, he or she will take any of the outgoing links or will jump to a random page in the graph. The PageRank score for each page depends on the number of times it has been visited. More formally, in a directed weighted graph the PageRank score of an arbitrary vertex vi is iteratively computed as in Equation 3 until the algorithm converges: PageRank(vi ) =
1−d +d ∗ N v
w ji ∗ PageRank(v j ) ∑vk ∈Out(v j ) w jk ∈In(v )
∑
j
i
(3) where d is a damping factor that ranges between 0.0 and 1.0. If the damping factor is set to one, then pages that have no outgoing external links will act as rank sinks and absorb all of the rank in the system. For this reason, the formula is adjusted so that with some probability, the surfer jumps to a random node in the graph. In the original PageRank algorithm, the score of each node in the graph depends on all its incoming edges. Our problem is different in the sense that the coupling cost of a package depends on the cost of all the packages that it is using and hence depends on all the outgoing edges. Therefore, in order to apply the PageRank method, all the
we considered two computationally inexpensive cost estimation techniques. The first approach sums the individual costs of all useful packages in the project and has a tendency for overestimation; while the second approach underestimates costs by using the cost from the package that exhibits the highest coupling values. An initial analysis showed that the second approach produced better results and so it was adopted for all the remaining experiments described in this paper. Figure 4.
Partial reversed package graph for an example project
edges in the package graph G were first reversed and then the PageRank scores were computed for the reversed graph. The calculated PageRank scores are an indication of the relative connectivity level of each package to other packages and so are used as the coupling cost values. C. Project Coupling Costs Given a set of features, a project can contain useful packages that implement desired features, plus some additional utility packages that provide essential services to the useful packages, but which do not directly implement any of the desired features. The coupling cost associated with each project depends on the combined external coupling of the set of useful packages to their utility packages. In order to accurately compute this cost, all of the useful packages are merged together in the graph through removing internal edges that connect the useful packages, and then replacing external edges, i.e., edges between utility packages and useful packages, with edges to or from the merged package. In the case that a utility package is connected to more than one useful package through outgoing edges, all these edges are merged into a single edge and the weight of this newly formed edge is computed as the sum of all outgoing edges to the useful packages. Similarly, all the incoming edges from the set of useful packages to the utility package are replaced with a single edge connecting the merged package to the utility package. After merging all useful packages, the PageRank scores are recalculated and the project coupling cost for the set of given features is computed as the PageRank score of the merged package. Figure 4 provides an illustrative example. On the left hand side of the diagram, the reversed package graph depicts a set of features, F = { f1 , f2 , f3 , f4 }, for which the package set UP = {p1 , p2 , p3 } are useful and they are connected to other packages that do not implement any of the desired features. On the right-hand side of Figure 4, the graph is shown after the useful packages are merged. Unfortunately this approach can be computationally expensive, as PageRank scores need to be recalculated each time a user issues a new recommendation request. Therefore
D. Package Recommendations Package recommendations are, therefore, made as follows. Given a set of features F = { f1 , ..., fn } , our code search engine finds the set of all relevant packages, PK = {pk1 , ..., pkn } and relevant projects PR = {pr1 , ..., prm } where each pki is part of a project in PR. As a single feature can be implemented in different packages across various projects, the challenge is to find the optimal set of packages with respect to the objectives and constraints mentioned in section V-A. By simplifying the problem to find the minimum number of projects that cover all the features, our problem can be seen as equivalent to the set cover optimization problem which has been shown to be NP-complete [34]. Furthermore, if the problem were to find the minimum coupling cost combination of projects that cover all the features, then it would be another variation of set cover optimization and NP-complete. The greedy algorithm has previously been used to provide a good approximation of a near-optimal solution [34]. We, therefore, adopted this approach. Our method, as described in Algorithm 1, iteratively selects the best project at each step and then selects all of the packages in this project which implement a targeted feature. This process continues until all the targeted features are covered or there are no more candidate projects to choose from. Our criterion for selecting the best project is based on the average cost per feature, computed by determining the project coupling cost as described in section V-C, divided by the number of targeted features implemented by the project. Algorithm 1 Greedy set-cover algorithm selectedPackages ← 0/ selectedPro jects ← 0/ while F 6= 0/ do best ← getBestPro ject(PR) selectedPro jects ← selectedPro jects ∪ best selectedPackages ← selectedPackages∪ use f ulPackages(best, F) F ← F − coveredFeatures(best, F) end while VI. E VALUATION In addition to the quantitative study reported in Section IV-B of this paper, we also conducted a qualitative assess-
ment designed to compare the efficacy of our approach against the current state-of-the-art approach. This kind of assessment relies on expert human judgement and is an accepted practice for evaluating recommendations [23]. A. State-of-the-Art Comparison The current state-of-the-art technique for locating source code that is relevant to a given feature utilizes a source code search engine. For purposes of this study we, therefore, compared our approach against the Portfolio search engine, which has been shown to outperform Google Code Search and Koders in studies where developers search for source code relevant to features they need to implement [24]. We replaced the Package Recommender from our approach with Portfolio by concatenating the text descriptions of the features selected by the user into a single query. This concatenation simulates the case where programmers search for code relevant to multiple features by entering those features into a search engine as a single query. The Java packages recommended by Portfolio were then presented to the user using the same interface we designed for our approach. In this way the user interface was identical across the user study regardless of whether the underlying recommendations were made by our approach or by the search engine. B. Research Questions The ultimate goal of our rapid prototyping system is to support vertical prototyping through recommending relevant source code packages. Our approach is designed to maximize the number of features covered by the returned source code, while minimizing the amount of source code returned that does not directly implement features. Therefore, our study was designed to address the following research questions (RQs): RQ1 Are the recommendations from our approach more relevant to the original product description than the recommendations from the state-of-the-art approach? RQ2 Does our approach recommend fewer false positives than the state-of-the-art approach? RQ3 Does our approach provide better feature coverage than the state-of-the-art approach? RQ4 Do users require less time to understand the recommendations from our approach than from the state-of-the-art approach? RQ1 is designed to evaluate the recommendations from our approach in terms of overall relevance to the original product description given by the user. This addresses the possibility that the recommended source code is relevant to the features selected, but not relevant to the query entered by the user. RQ2 is designed to evaluate whether the recommended source code implements the selected features. Each source code package that is returned should implement one or more of the previously specified features, and our
Table II T HE CROSS - VALIDATION DESIGN OF OUR USER STUDY. D IFFERENT PARTICIPANTS USED DIFFERENT TASKS WITH DIFFERENT APPROACHS .
Experiment 1 2
Group A B A B
Approach Our Approach State-of-the-Art State-of-the-Art Our Approach
Task Set T1 T2 T3 T4
approach attempts to maximize the number of selected features implemented per package. RQ3 is designed to evaluate feature coverage. Finally, a stated goal of our approach is to reduce manual prototyping effort by minimizing the external coupling of the recommended source code, as well as the amount of that source code. We designed RQ4 to evaluate the effort in terms of time required to understand the recommendations. C. Cross-Validation Design of the User Study A cross-validation design was used in which experts compared the results from our approach to the results from a state-of-the-art approach. A cross-validation design is important because it limits potential threats to validity such as fatigue, bias towards tasks, and bias due to unrelated factors (e.g., user interfaces). Table II shows an outline of the experimental design. The study was split into two experiments, each lasting one hour. The participants were randomly placed into two equally sized groups, A and B. The approaches and tasks were rotated among the groups such that different participants used different tasks on different approaches. Also, the participants were prevented from knowing whether they were evaluating our approach or the state-of-the-art approach to avoid introducting bias. During the study our approach was denoted as the Green approach and the state-of-the-art approach as Orange. The approaches shared the same interface and participants saw only the color denotations. 1) Participants: 31 computer science students were recruited from the College of William & Mary to participate in our user study. Twenty-eight were graduate students, while three were undergraduates. The participants had an average of 4.8 years programming experience and 3.4 years experience with Java. Fourteen reported professional programming experience in various industries. 2) Tasks: The experiments were designed around a set of 12 different tasks. These tasks were roughly equal in difficulty, as determined by a vote of the authors, and represented a range of potential prototyping tasks. The following is an example task from the user study. A complete listing of the tasks and other case study materials may be downloaded from our online appendix. Build a video player with adjustable bitrate and other video and audio paramters. Your program
Table I S UMMARY OF RESULTS FROM THE USER STUDY SHOWING RELEVANCE (R), PRECISION (P), COVERAGE (C), AND TIME REQUIRED IN MINUTES (T ). T HE COLUMN S AMPLES IS THE NUMBER OF RECOMMENDED PACKAGES FOR R AND C, THE NUMBER OF QUERIES FOR P, AND THE NUMBER OF QUERIES THAT USERS RECORDED THEIR TIMES FOR T . ANOVA RESULTS ARE F , Fcritical , AND p1 . S TUDENT ’ S T- TEST RESULTS ARE t, tcritical , AND p2 . H
Var
H1
R
H2
P
H3
C
H4
T
Approach Our Approach State-of-the-Art Our Approach State-of-the-Art Our Approach State-of-the-Art Our Approach State-of-the-Art
Samples 331 673 128 96 331 673 91 62
Min 1 1 0 0 0 0 1 6
Max 4 4 1 1 1 1 38 46
Median 2 1 0.50 0.33 0.20 0 10 20
should support multiple video formats and display the video inside a resizable GUI window. In each experiment, a participant was assigned one of the two approaches and a set of tasks. The participant had to formulate a query by defining a set of keywords that represented at least some of the features needed for the task at hand. The participant then entered the query into the GUI and selected features relevant to the query. The system then returned a set of recommended packages. The participants were asked to evaluate the results according to the relevance of the recommended packages, and through specifying which packages implemented each of the targeted features. D. Metrics and Statistical Tests The following metrics were collected during the study. 1) Relevance: The relevance of a recommended package was evaluated by the participants on a four-point Likert score, rated as an integer from one to four, where four is highly-relevant, three is relevant, two is largely irrelevant, and one means completely irrelevant. The relevance metric was used to answer RQ1 . 2) Precision: Precision is the percent recommendations which implement at least one of the targeted features. Precision will be high when the number of false positives (packages that implement no features) is low; precision is intended to help us answer RQ2 . 3) Coverage: Coverage measures the number of features implemented by a recommended package, and is used to |FI | answer RQ3 . Coverage is defined as |F , where FI is the set S| of features implemented by a given package, and FS is the set of features selected by the user. Coverage is high when the recommended packages implement a large portion of the features selected by the user. 4) ANOVA: One-way ANOVA and the Student’s t-test [31] were used to evaluate the statistical significance of differences in relevance, precision, and coverage. ANOVA is a parametric test that assumes a normally-distributed sample. According to the law of large numbers, the central limit theorem applies when the sample size is greater than 30
µ 2.1 1.7 0.59 0.43 0.29 0.21 11.5 20.2
F
Fcritical
p1
t
tcritical
p2
Decision
25.6
3.85
5e-7
5.06
1.96