near their maximum and harvest costs near their seasonal low. The actual ... Fruit production, harvesting, and juice processing define the ... meets customer quality specifications and production needs, the ... Growers are paid for the total pound-solids they deliver to a .... could also stand to gain from mechanical harvesters.
Proc. Fla. State Hort. Soc. 120:45–50. 2007.
Reconciling Grower and Processor Objectives When Deciding to Harvest Juice Oranges JACOB SEARCY1, FRITZ ROKA2*, and THOMAS SPREEN3 1
University of Florida, IFAS, Food and Resource Economics Department, 1097 McCarty Hall B, P.O. Box 110240, Gainesville, FL 32611-0240 University of Florida, IFAS, Southwest REC, Immokalee, P.O. Box 110240, Gainesville, FL 32611-0240
2
University of Florida, IFAS, Food and Resource Economics Department, 1167 McCarty Hall A, P.O. Box 110240, Gainesville, FL 32611-0240
3
ADDITIONAL INDEX WORDS. mechanical harvesting, citrus processing, fruit quality Growers of processed oranges attempt to maximize on tree returns by harvesting fruit when pounds-solids per acre near their maximum and harvest costs near their seasonal low. The actual harvest date for a specific block, however, is set in conjunction with processor objectives. Processors attempt to maximize returns by scheduling fruit inputs to fill plant production capacity, minimize processing and storage costs, and maintain quality parameters. Operational capacity and inventory management decisions within each processing firm govern allowable harvest and processing schedules that strive to meet optimal plant operation goals. Overlaying both grower and processor objectives are the capacity limitations and cost of hand-harvest crews. Recent developments in mechanical harvest systems have the potential to improve harvest labor productivity, allowing increased freedoms during harvest and increasing in the daily capacities. This paper discusses the grower’s optimal harvest window, the processor’s optimal production window, and the implications of maximizing the combined returns of both growers and processors.
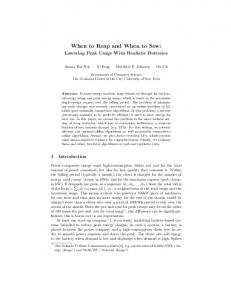
Oranges grown in Florida are utilized primarily for orange juice production. Approximately 96% of the state’s oranges were processed during the 2005–06 season, with about 35% of processed oranges going to frozen concentrate (FCOJ) and 64% to the production of “not-from-concentrate” (NFC) juice (Florida Citrus Commission, 2007). The Florida citrus processing sector currently consists of about 20 processing facilities that purchase fruit from several hundred growers in central and southern regions of the state (U.S. International Trade Commission, 2006). Fruit production, harvesting, and juice processing define the principal sectors of the Florida citrus juice industry. In Figure 1, the linkages among these sectors and the transformation of fruit into juice products are depicted. During the growing season, fruit quality, as measured by sugar content, acid levels, and juice volume, constantly changes. Once the fruit is picked, quality parameters and juice volume begin to deteriorate and the fruit must be processed as soon as possible. To a large extent, harvesting schedules are set with the goal of processing fruit within 24 h after harvest. Pasteurized juice can be concentrated by evaporating about 75% of its water or held as NFC juice (United Nations Food and Agricultural Organization, 2001). If the freshly extracted NFC juice meets customer quality specifications and production needs, the juice can be transferred directly into a consumable package, with little or no additional juice blending necessary, and shipped to a retail location. For the most part, however, both FCOJ and NFC are stored in refrigerated bulk tanks. Storage is necessary for two reasons. First, storage expands the 8- to 9-month fruit harvesting and processing window to a 12-month juice distribution delivery *Corresponding author; email: fmroka@ufl.edu; phone 239-658-3400
Proc. Fla. State Hort. Soc. 120: 2007.
schedule. Second, storage allows for juice blending. Blending of some combination of stored, freshly processed, and purchased juice is common to ensure uniform juice quality throughout the year. Early season fruit tends to be lower in sugar content and higher in acid levels than fruit harvested later in the season, so blending is used to minimize these normal variations. Problem Statement The harvest date for any particular citrus block is a key decision with profit implications for both growers and processors. The objective of this paper is to outline the respective economic incentives of growers and processors and discuss how those incentives could lead to divergent “ideal” harvesting schedules. Even though the bulk of harvesting within the Florida industry is coordinated through third-party contractors, harvesting and transportation costs are paid by growers. Hence, for purposes of this paper, harvesting is considered a grower activity. Under the current system of industry coordination, Florida growers and processors for the most part are independent decisionmakers. Unlike in the Brazilian juice industry, where processors control an increasing amount of fruit production (Barros, 2005), Florida processors have little or no interest in grove ownership (Griffiths, 2005). As independent decision-makers, growers and processors react to different economic incentives. Grower Perspective Growers are paid for the total pound-solids they deliver to a processing plant. A grower’s “ideal” harvest window is dependent upon three variables; pound-solids per box, total fruit yield, and 45
Fig. 1: Flow of Fruit and Juice Movement
Grove
Fruit and PS Changes
Harvest Fruit Loss
Processing Plant
OJ not stored in bulk tank and loss
Storage Storage
OJ Deliveries from Processing Plant
Imported or domestically purchased OJ Blend Tank
Bottling Plant, Retailer, or Wholesaler
Fig. Pound-solids Fig. 1. Flow of fruit and2: juice movement.
change for all Valencia oranges, averages from 1936 – 1938
(Harding, 1940) 6.5
6
Pounds Solids per Box
5.5
5
2
y = -9E-05x + 0.0359x + 1.6074
4.5
4
3.5
3 50
100
150
200
250
300
350
Time (days from Aug. 31)
Fig. 2. Pound-solids change for all Valencia oranges, averages from 1936 to 1938 (Harding, 1940).
harvest costs. Sugar concentrations, as measured by pound-solids, steadily increase and then decrease over the course of the harvest season. Figure 2 presents an example of a ‘Valencia’ block that reaches maximum pound-solids during mid to late March (Harding, 1940). After this date, pound solids per box slowly decrease through the remainder of the harvest season. The exact timing and magnitude of this maximum will vary based on season, region, and biological characteristics of the grove, but every grove will 46
follow the same general trend. Also affecting a grower’s ideal harvest window is fruit drop, which tends to increase as fruit hangs in a tree beyond its maturation point (Fig. 3), thus decreasing overall fruit yield. Lastly, harvest costs, as measured by pick and roadside costs, tend to hold steady through the season until late May and then increase as the harvest season extends into June (Fig. 4). Harvest costs increase as migrant workers, the primary constituents in the harvest labor supply, travel north to Proc. Fla. State Hort. Soc. 120: 2007.
Fig. 3: Percent Fruit Droppage of tagged fruit in 1937-1938, assumed to be monthly drop rates (Harding, 1940) 100
90
80
Percentage Fruit Drop
70
60
50
y = 0.2389x - 41.484 40
30
20
10
0 50
75
100
125
150
175
200
225
250
275
300
325
350
Time (days from Aug. 31)
Fig. 4: Pick and Roadside Harvest Rates for Valencias from a Sample Harvesting Company for 2003-04 Season (data collected by Barbara Hyman through personal interviews with harvesters, 2004).
Fig. 3. Percent fruit droppage of tagged fruit in 1937–38, assumed to be monthly drop rates (Harding, 1940).
$2.50
Harvest Cost Per Box
$2.00
$1.50
$1.00
$0.50 May 15, 2004
$0.00 2/23
3/14
4/3
4/23
5/13
6/2
6/22
7/12
Date of Harvest
Fig. 4. Pick and roadside harvest rates for Valencias from a sample harvesting company for the 2003–04 season (data collected by Barbara Hyman through personal interviews with harvesters, 2004).
follow agricultural crops during the summer months. In addition, harsher (more humid) working conditions and generally lower per acre ‘Valencia’ crop yields contribute to drive up harvest costs after mid May. If a grower were to control his or her harvesting schedule, the “ideal” harvest schedule may look somewhat like the grower’s preferred schedule in Fig. 5, where harvest is concentrated for both late season and early season fruit around their respective peaks in pound-solids production. Two factors work against the Proc. Fla. State Hort. Soc. 120: 2007.
grower from realizing this “ideal” harvest schedule—availability of manual labor and processors’ scheduling criteria. Under a manual harvest method, daily harvest labor productivity is limited by the availability and physical capacity of the workers. If an average harvester can pick 10 boxes per hour, it would require more than 44,000 people working 60 h per week for a month to harvest 100 million boxes of oranges. A temporary workforce of this size is not available; therefore the harvest period expands to allow complete harvest of all mature fruit. 47
Figure 5: Hypothetical Preferred Annual Harvest and Processing Schedules, including utilization 0.5
0.45
0.4
% of Total Production
0.35
0.3
0.25
0.2
0.15
0.1
0.05
0 S
O
N
Utilization
D
J
F
10 month
M
6 month
A
M
4 month
J
J
A
Grower
Fig. 5. Hypothetical preferred annual harvest and processing dchedules, including utilization.
Processor Perspective More important than labor availability, the harvest schedule is determined by the needs and harvesting criteria of juice processors. Whereas a grower is focused on pound-solids production, a processor has to manage for broader criteria of fruit quality parameters, such as acid levels, juice color, and off-flavors. In addition, a processor’s quality standards are influenced by the final product—FCOJ or NFC juice. Whenever possible, NFC processors by-pass storage by running freshly pasteurized juice, often blended with some previously stored juice, directly to a retail package. Hence, quality standards on incoming fruit for NFC tend to be narrower. Aside from total crop volume and fruit quality considerations, the daily volume of fruit a processor handles is a function of the fruit extraction and juice storage capacities. Processing equipment and storage tanks are significant capital investments and, once purchased, become “fixed-costs” to the processor. A processor, however, has some managerial latitude. One management plan may be to operate juice extractors over a short, but intense, period of time. Another plan would be to reduce daily intensity of juice extraction and extend the duration of the extraction period over more months. If a processor expects to produce a given quantity of juice over the course of a season, operating juice extractors over a shorter time period should achieve some cost efficiencies since that portion of fixed capital would be operated at full capacity and then shut down for the remainder of the season. A shorter extraction period, however, would require an increase in storage capacity. As mentioned previously, some storage is necessary to bridge the time-limited window of fruit availability with a 12-month juice distribution schedule. Compressing the harvest period from 9 to 4 months would require an increase of storage capacity to accomplish storage from 3 to 8 months. By extending the fruit harvesting season to 9, and possibly 10 months, 48
storage costs could be lessened. Now, however, unit costs of fruit extraction could increase if plants are operating well under capacity for extended periods. Figure 5 illustrates hypothetical examples of 4-, 6-, and 10month processing schedules. An FCOJ processor does not have the same storage costs concern as a NFC processor since concentrate requires about one-sixth the storage volume of single-strength orange juice. Thus, an FCOJ processor may opt to extract juice over a more limited time interval to capture more pound-solid production from the groves. Alternatively, an NFC processor may prefer a 10-month processing schedule to allow more direct shipments of fresh juice and minimize bulk tank storage. Overlaying both grower and processor objectives are the limited availability and productivity of hand-harvest labor, which can restrict daily harvest capacity. Hand harvesting has been used since the first commercial citrus grove was planted in Florida and has thus played an integral part in industry coordination and development. The current logistical system of transportation, processing, fruit and juice handling, and storage has evolved around the hand-harvesting model. The current harvest model does not easily allow for spikes in the harvest rate without increases in wage rates. Conversely, extended gaps in harvest periods during the season may not be possible because laborers require steady employment through the season. Even short pauses in harvest can result in workers seeking employment elsewhere. Historically, the limitations of hand harvesting has received less attention because labor was relatively cheap and hand-harvesting crews were the only viable harvest option. The increasing cost and uncertainty of labor, coupled with continued improvements to mechanical citrus harvesters, have opened the possibilities of redesigning more cost-efficient harvest and processing logistics. The actual harvesting schedule within the citrus industry exists as a set of compromises to accommodate grower and processor incentives, as well as the physical harvesting and physical plant Proc. Fla. State Hort. Soc. 120: 2007.
Fig. 6: 2005-06 Florida Citrus Industry Processing Intensity; monthly percentage of total season production (Florida Citrus Commission, 2007) 50%
45%
40%
% of Total Production
35%
30%
25%
20%
15%
10%
5%
0% S
O
N
D
J
F
M
A
M
J
J
A
Fig. 6. The 2005–06 Florida citrus industry processing intensity; monthly percentage of total season production (Florida Citrus Commission, 2007).
constraints. Figure 6 shows the actual percentages of total fruit production that were processed each month during the 2005–06 season (Florida Citrus Commission, 2007). Processing volumes during the 2005–06 season peaked in January for early fruit and in April for late fruit. New Technology—Mechanical Harvesting Mechanical harvesting has the potential to significantly reduce harvest costs. Trunk and canopy shakers, in current commercial operation, can improve labor productivity by 10-fold (Brown, 2005). If these systems were to be utilized throughout the harvest season and at their operational capacity, harvest costs are projected to decrease by as much as 75% of current hand-harvesting costs, depending on the grove and seasonal conditions (Brown, 2005). Criteria for mechanical harvesting success will be measured by the amount net harvest costs can be reduced. Therefore, it is important not only to analyze the cost efficiencies of the harvesting operation, but also to analyze any effects mechanical harvesting can play within the processing sector. A key assumption in the cost efficiency of mechanical harvesting systems is sufficient trailer allocations. Under the current logistical model of harvest scheduling and trailer allocation, daily fruit volume to a processor is disbursed across a wide geographic area. The full adoption of mechanical harvesting will concentrate daily load allocations to fewer harvesting sites. The possible effect on overall fruit quality is unclear. On one hand, faster, more concentrated harvesting may allow groves to be harvested closer to their pound-solids maximum, thus increasing total pound-solids delivered to the processing plants. On the other hand, fewer daily harvesting sites may limit the amount of “in-field” blending of acid levels and juice color that could be achieved if a processor tracks fruit quality parameters prior to harvest. Adoption of mechanical harvesting by the Florida citrus industry has the potential to remove some of the constraints that restrict current industry operations. A 4-month processing schedule, with a 2-month down period between early and midseason, and late season fruit, becomes more feasible with mechanical harvesters Proc. Fla. State Hort. Soc. 120: 2007.
rather than with hand labor. Restarting the harvest after 2 months of not operating requires only machine availability and retaining a smaller, more skilled work force. Resuming harvest with hand crews after such a shutdown would not be economically feasible under current labor market conditions. A processor operating under a 10-month production schedule could also stand to gain from mechanical harvesters. A small number of mechanical harvesting systems could supply a steady supply of fruit to the processing plant throughout the year. Harvesting a consistent quantity of fruit monthly from November through May could be feasible, reducing the chance of labor issues slowing the harvest. Technological improvements such as new fruit varieties, abscission chemicals, and harvesting equipment, should increase the availability of mechanical harvesters for the entire season. Redesigning the Harvest Scheduling Model The introduction of mechanical harvesting affords the citrus industry an opportunity to rethink, perhaps redesign, the way fruit is moved from groves to and through processing plants. The questions below highlight the important economic trade-offs that need to be analyzed to estimate costs and benefits associated with mechanical harvesting. 1. To what extent does pound-solids accumulation within fruit match with desired juice color and acid level? 2. How do cost efficiencies of harvest and processing equipment vary with changes in the intensity of daily use? 3. How do the costs of juice storage change as the length of the harvest season changes? Historically, the adoption of mechanical harvesters in agriculture has followed one of two paths. The cotton harvester is an example of a traditional invention created by a single designer and slowly adopted by the industry. At the other extreme is the mechanical tomato harvester, where its development and introduction were more complex and required a systems-wide development approach. Engineers, horticulturists, agronomists, and irrigation specialists came together with growers and proces49
sors to develop a plan of action to quickly combat the increasing harvest costs (Rasmussen, 1968). The successful industry-wide adoption of mechanical citrus harvesters in Florida will require a continued systems development approach. The future focus of this research will be to estimate economic consequences arising from coordination problems between growers and processors as mechanical citrus harvesters begin to play a major role in the harvesting the Florida juice orange crop. Literature Cited Barros, S. 2005. Brazil Citrus Annual 2005. USDA Foreign Agr. Serv., GAIN Rpt. No. BR5026. Brown, G.K. 2005. New mechanical harvesters for the Florida citrus juice industry. HortTechnology 15(4):69–72.
50
Florida Citrus Commission. 2007. Florida Citrus Processors Association 2005–2006 Season Processor Reports Statistical Survey. accessed at on 2 Apr. 2007. Griffiths, J.T. and W. Mansfield. 2005. Citrus Oral History Project. Globalization Res. Ctr., Univ. of South Florida, 28 Apr. 2005. Harding, P.L., J.R. Winston, and D.F. Fisher. 1940. Seasonal changes in Florida oranges. USDA Tech. Bul. No. 753. Hyman, Barbara. 2004. Unpublished data from personal interviews with selected citrus harvesters during the 2003–04 season. Rasmussen, Wayne D. 1968. Advancements in american agriculture: The mechanical tomato harvester as a case study. Technol. Culture 9(4):531–543. United Nations Food and Agricultural Organization. 2001. Principles and practices of small- and medium-scale fruit juice processing. FAO Agr. Serv. Bul. 146. U.S. International Trade Commission. 2006. Certain orange juice from Brazil. Publ. 3838. Investigation No. 731-TA-1089.
Proc. Fla. State Hort. Soc. 120: 2007.