Machine Vision and Applications (2003) 14: 35–41 Digital Object Identifier (DOI) 10.1007/s00138-002-0099-5
Machine Vision and Applications © Springer-Verlag 2003
Reconstructing a textured CAD model of an urban environment using vehicle-borne laser range scanners and line cameras Huijing Zhao, Ryosuke Shibasaki Center for Spatial Information Science, University of Tokyo, 4-6-1 Komaba, Meguro-ku, Tokyo 153-8505, Japan; e-mail:
[email protected]
Abstract. In this paper, a novel method is presented for generating a textured CAD model of an outdoor urban environment using a vehicle-borne sensor system. In data measurement, three single-row laser range scanners and six line cameras are mounted on a measurement vehicle, which has been equipped with a GPS/INS/Odometer-based navigation system. Laser range and line images are measured as the vehicle moves forward. They are synchronized with the navigation system so they can be geo-referenced to a world coordinate system. Generation of the CAD model is conducted in two steps. A geometric model is first generated using the geo-referenced laser range data, where urban features, such as buildings, ground surfaces, and trees are extracted in a hierarchical way. Different urban features are represented using different geometric primitives, such as a planar face, a triangulated irregular network (TIN), and a triangle. The texture of the urban features is generated by projecting and resampling line images onto the geometric model. An outdoor experiment is conducted, and a textured CAD model of a real urban environment is reconstructed in a full automatic mode. Keywords: 3D modeling – Urban outdoor – Mobile system – Laser range scanner – Line camera
1 Introduction Up to now, many research groups in the photogrammetry community have been devoted to the analysis of aerial-based imageries for the reconstruction of 3-D urban objects [3, 6]. Normally, aerial survey can cover a relatively wide area but fail to capture details of urban objects, such as sidewalls (facades) of buildings. On the other hand, most of the existing systems in the computer-vision field have been demonstrated at small scales, using simple objects, under controlled light conditions [2,7,12]. With the development of the automobile-navigation system, the 3-D Geographic Information System (GIS), and applications using virtual and augmented reality, details of urban outdoor objects are found to be of importance, as user view points are involved on the ground, not in the air. An efficient Correspondence to: H. Zhao
reconstruction method is required that exploits ground-based survey techniques on a large scale, for complicated and unexpected object geometries, under uncontrolled light conditions. 1.1 Related works Several systems aimed at generating 3-D models of the real world have been developed during the last few years. According to the major data source being used for reconstructing object geometry, the systems can be broadly divided into two groups. One is called an image-based approach. The other is called a range-based approach. In the first group, 3-D models of urban scenes are reconstructed, using still or moving images. Image-based approaches are also called indirect approaches, since object geometries have to be extracted automatically or with human assistance, using stereo or motion techniques. Debevec et al. [4] presented an interactive method for modeling and rendering architectural scenes from sparse sets of still photographs, where large architectural environments can be modeled with far fewer photographs than using other fully automated image-based approaches. Bosse et al. [1] developed a prototype system of automatically reconstructing textured geometric CAD models of urban environments using spherical mosaic images, where the camera’s position and orientation of each spherical image is first initialized using positioning sensors, then refined through image matching. Geometric representation is extracted, either using feature correspondence or by identifying vertical facades. Uehara and Zen [14] proposed a method for creating textured 3-D maps from existing 2-D maps, using motion techniques, where a video camera is mounted on a calibrated vehicle, and the image streams that are captured are geo-referenced onto the existing 2-D map using GPS data. Through the above research efforts, it has been demonstrated that an image-based approach can be used in reconstructing 3-D models of urban outdoor environments. Whereas, the difficulties in reliable stereo matching, distortion from limited resolution and unstable geometry of CCD cameras are the major obstacles to reconstructing a 3-D model of complicated environment with the necessary accuracy and robustness. In the group of range-based approaches, 3-D models of urban scenes are reconstructed using range data. Range-based
36
H. Zhao, R. Shibasaki.: Reconstructing a textured CAD model of an urban environment using laser scanners and line cameras
approaches are also called direct approaches, since object geometry can be directly measured using range scanners. In recent years, with the development of eye-safe laser range scanners, reconstructing relatively large objects in an urban environment using range data has become technically feasible. Sequeira, et al. [11] and El-Hakim et al. [5] developed systems of reconstructing rather large-scale indoor environments. Stamos and Allen [13], and Zhao and Shibasaki [15] aimed at generating 3-D models of urban outdoor objects. In these systems, since range scanners are mounted on stationary platforms, they are also called stationary system. Range images produced by the systems are, typically, rectangular grids of range distances (or 3-D coordinates after conversion) from the sensors to the objects being scanned. Objects are measured from a number of view points to reduce occlusions where location and direction of view points are unknown or roughly obtained using GPS, gyro sensors, and/or other navigation systems. Range data obtained in different view points is registered and integrated; then a completed model of the urban environment is reconstructed. There are several drawbacks to stationary systems. First, in data acquisition, successive range views have to keep a degree of overlay so that location and direction of view points can be traced (or refined) by registering range data. Planning for viewpoints and directions in data acquisition becomes difficult when measuring large and complicated scenes, since a balance between the degree of overlay and the number of viewpoints has to be decided according to both the target objects and the registration method. Second, there is still no registration method that can succeed in automatically registering range data of all kinds. When the number of range views increases, registration while keeping necessary accuracy becomes difficult. Thus, it is very important to update stationary systems to moving-platform ones (called vehicle-borne systems) for reconstructing 3-D models of large real scenes.
of geo-referencing each kind of data source. We then present the method for geometric model reconstruction and texture mapping. An outdoor experiment is conducted in a real urban environment, The Kirigaoka apartment complex, where the measurement vehicle runs a course of about 1.5 km, at a speed of 20∼40 km/h. A textured CAD model, including the urban features, such as buildings, trees, roads, etc., along the measurement route, is generated in a fully-automated mode. The experiment results and discussions are subsequently presented. 3 Sensor system and geo-referencing of data outputs The sensor system consists of three different kinds of sensors, each for a specific purpose. They are the laser range scanners (sensors for measuring object geometry), the line cameras (sensors for capturing object texture), and the GeoMaster (the moving platform). 3.1 Laser range scanner – sensor for measuring object geometry Single-row laser range scanners, LD-As (Fig. 1a), produced by IBEO Lasertechnik, are used in the sensor system. In one scanning (a range scan line), the LD-A profiles 600 range points of the surroundings on the scanning plane within 300◦ . A blind area of 60◦ exists, due to the hardware configuration (Fig. 1b). The LD-A has a maximum range distance of 100 m and an average error of 3 cm. The frequency of the LD-A is 20 Hz, implying that it profiles 20 range scan lines per second. Figure 1c shows a piece of range image, where each column corresponds to a range scan line, and range scan lines are aligned in the order of the measurement sequence. 3.2 Line camera – sensor for capturing object texture
2 Outline of the research In the sensor system developed by Konno et al. [9], three single-row laser range scanners and six line cameras are mounted on a measure vehicle (GeoMaster), which has been equipped with a GPS/INS/Odometer-based navigation system. The sensor system outputs three kinds of data sources: laser range points, line images, and navigation data. Either laser range points or line images are in the sensor’s local coordinate system at the moments of measurement. They are synchronized with the navigation data using the sensor’s local clock. This research contributes to a method of reconstructing textured 3-D models of urban outdoor environments by fusing the data outputs of the sensor system. It has two procedures. A geometrical surface model is first generated, using the integrated model of laser range points, where all laser range points in the sensor’s local coordinate system at the moments of measurement are geo-referenced to a world coordinate system, using both the navigation data and the calibration parameters of the sensor system. Texture data is then generated by projecting line images onto the geometric model, where line images are geo-referenced to a world coordinate system in the same way as that of laser range points. In the following, we will first briefly describe the hardware system and a way
Line cameras are implemented in the sensor system. Each has an 8 mm F4 fish-eye lens with a vision field of 180◦ on it
Fig. 1a–c. Laser range finder (LD-A) and examples of range data: a configuration of LD-A, b range points in a scan line, c a piece of range image
H. Zhao, R. Shibasaki.: Reconstructing textured CAD model of urban environment using laser scanner and line cameras
37
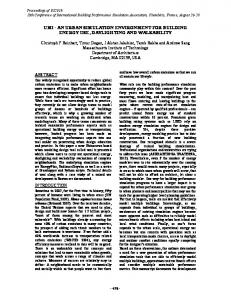
Fig. 2. Line camera and an example of a line-image strip
(Fig. 2a). In each snapshot, a single-row image (line image) of 1 × 2048 pixels, is captured on the scanning plane. Among the 2048 pixels, about 224 pixels (≈ 20◦ ) on each side are discarded, due to high lens distortions. Line images are captured at a rate of 80 Hz by each line camera. Figure 2 shows a strip of line images, where each column corresponds to the valid pixels of a line image.
Fig. 3a,b. Sensor system: a sensor alignment, b measurement vehicle (GeoMaster)
3.3 GeoMaster – moving platform The measurement vehicle, the GeoMaster (Fig. 3b) is equipped with a highly accurate GPS/INS/Odometer-based navigation system, the HISS [9]. A method for improving the accuracy of the navigation system in a highly dense urban area is addressed in [16]. In this paper, we assume the navigation error of the moving platform is small enough. 3.4 Sensor alignment Three LD-As and six line cameras are mounted on the roof of GeoMaster, as shown in Fig. 3a. The LD-As and the line cameras are installed with their scanning planes at different angles to reduce occlusion. In this research, all exterior calibration parameters (relative angles and distances) between the sensors’ local coordinate systems are obtained through physical measurement; all interior calibration parameters (e.g., focus length) are obtained from the maker or sensors’ specifications. For data measurement, all sensors keep recording data sources as the vehicle moves ahead. When the GeoMaster moves at a speed of 20 km/h, line images are captured at intervals of about 6.9 cm by each line camera, range scan lines are profiled at intervals of about 27.8 cm by each LD-A, and navigation data (location and direction of the vehicle at the local coordinate system of HISS) are measured at intervals of 20 cm. Navigation data is associated with each line image and range scan line through linear interpolation, using the sensors’ local clocks. 3.5 Geo-referencing data sources Figure 4 shows the conceptual figures of geo-referencing range scan lines and line images in each sensor’s local coordinate system at the moment of measurement to a world coordinate system. According to the navigation data associated with each range scan line and line image, a transformation matrix Thg
Fig. 4a,b. Conceptual figures of geo-referencing data sources: a geo-referencing of range-scan line, b geo-referencing of line image
from the coordinate system of HISS to a world coordinate system is calculated, where the origin of HISS is at the center of the GPS antenna. On the other hand, a transformation matrix Tlh from the coordinate system of the LD-A and a transformation matrix Tch from the coordinate system of the line camera to the coordinate system of HISS are calculated, based on the exterior calibration parameters. Both Thg , Tlh , and Tch are in homogenous notations. In the case of the LD-A, a right-hand coordinate system is defined with its origin at the center of the laser head. The laser head of the LD-A does a clockwise rotation with its starting angle downward. The Z-axis and Xaxis are defined composing the scanning plane, at the angles of 180◦ and 270◦ from the starting angle. A range point with a range distance of r at an angle of α is geo-referenced to the
38
H. Zhao, R. Shibasaki.: Reconstructing a textured CAD model of an urban environment using laser scanners and line cameras
Fig. 5. Data and processing flows of geometric modeling
world coordinate system as follows: (x, y, z, 1)T = Thg Tlh (−r sin α, 0, −r cos α, 1)T .
(1)
In the case of the line camera, a right-hand coordinate system is defined with its origin at its projection center. Zaxis is defined upward from the line camera, and Y -axis is opposite the projection axis. The focus length, f , of the line camera as well as a formula defining the relationship between the index of image pixel, h, and its projection angle, ω, towards the projection axis is obtained from the sensor’s specification. ω = 2 × arcsin((h − o)/2/f ),
(2)
where o is the image center, which is obtained by doing a physical measurement using sample images. Using Formula 2, the projection vector of image pixel, h, is geo-referenced to the world coordinate system as follows: (x, y, z, 0)T = Thg Tch (0, − cos ω, sin ω, 0)T
(3)
4 Creating a geometric model The goal of geometric modeling is to generate a surface representation of urban features with small a data size for use in commercial applications. In the present research, urban features are reconstructed in three levels. They are buildings, trees, and ground surfaces, where buildings are further divided into vertical and nonvertical building surfaces. Geometric modeling is conducted in two interrelated procedures: the classification of range points and geometric feature extraction. Figure 5 is an overview of the data and processing flows. Range points are classified by first segmenting each range scan line into line segments, then grouping the range points using a hierarchical procedure based on the following simple and intuitive rules.
1. A range point belonging to a vertical line segment of range scan line might be the measurement of vertical building surface. 2. A range point belonging to a horizontal line segment at the ground elevation might be the measurement of road surface. Relative elevation from the origin of the LD-A to the nearest ground surface is almost constant. It has been calculated previously in calibration stage. 3. A range point belonging to a nonvertical line segment and above the ground elevation might be the measurement of nonvertical building surface. 4. The range point of a tree always has a high distribution variance among the neighboring range points of successive range scan lines. 5. An isolated range point has low reliability. Segmentation of range scan lines is conducted in two dimensions. The coordinate system is defined consistent with the one in Fig. 4a, where Y -axis is omitted. The method presented in [10] is applied in this research to extract line segments from range scan lines. Figure 6 shows three examples of line segment extraction. As a result of line segment extraction, range points are broadly divided into four groups: the measurement of vertical building surfaces, ground surfaces, nonvertical building surfaces, and others (trees). However, misclassification exists in practice. For example, many line segments are extracted in the measurement of trees (Fig. 6b); whereas, they are not objects that are characterized as linear features. The above classification result is used as a starting point of the subsequent procedures in geometric modeling, through which geometric characteristics of range measurements are tested and verified. Geometric extraction of vertical building surfaces, ground surfaces, nonvertical building surfaces, and trees is conducted in a subsequent way, as shown in Fig. 5, using the corresponding group of range points. On the other hand, classification
H. Zhao, R. Shibasaki.: Reconstructing textured CAD model of urban environment using laser scanner and line cameras
39
Fig. 7a,b. Extracting geometric features: a a Z-image of all range points, b extracting vertical planar faces using Z-image, c classification result
Fig. 6. Segmentation of range scan lines
of range points is validated and refined, using the extracted geometric features. For example, the range points near to a vertical planar face are classified as the measurement of vertical building surfaces. On the other hand, the range points belonging to vertical line segments might be discarded if no vertical planar face is extracted from the range points. In the extractions of vertical building surfaces, the Z-image is used, which has been defined and demonstrated with efficiency in an urban outdoor area in [15], so that a 3-D extraction is converted to a 2-D problem. Line segments are first extracted from the Z-image of the range points belonging to the group of vertical building surfaces (Fig. 7a, b). Line segments are then recovered to vertical polygons, using the corresponding range points to define boundaries (Fig. 8b). As for the extraction of ground surfaces, range points are projected onto a regularly tessellated horizontal plane, and an elevation map of the ground surface is generated, using the minimal Z-value of the range points in each grid cell. A TIN model is constructed on the elevation map to represent the surface geometry (Fig. 8a). Nonvertical building surfaces are extracted, using an existing 3-D approach, the USF segmentation algorithm. A detailed technical explanation can be found in [8]. After extracting the building and ground surface, the left set of range points are mixed data of trees, parking cars, utility poles, irregular points, etc. One of the major differences between trees and the others is that the measurement of trees always yields a large cluster of range points. The Z-image of the left set of range points is generated. The range points that correspond to isolated or small clusters of image features in the Z-image are removed. Triangular cells are used to model trees, where each range point of the measurement of trees is amplified into a small triangle. The shape of the triangle is decided in a random way, whereas, surface normal is pointing to the center of the range scan line, and distances from each vertex to the range point are limited in a given range (Fig. 8a). 5 Texture mapping Figure 9 explains the principle of line image measurement, where trajectory of the line camera #5, i.e., positions and principle axes (Fig. 9a), the corresponding strip of line images (Fig. 9b). Distortion in the strip of line images is obvious. It is caused by the change of relative distance and direction from
Fig. 8a,b. Modeling geometric features: a ground surface in TIN model, b a perspective view of the geometric model
Fig. 9a,b. Texture mapping onto the geometric model: a positions and principle axes of line camera, b the strip of line images, c texture mapping using geo-referenced line images
the line camera to the objects. In order to correct the distortions and generate a texture of direct proportion to each object, line images are resampled as follows. 1. The texture of each building surface is generated, using the data from the line camera that is both close and has a large incident angle to the planar face. It is conducted as follows: Project and resample the line images of each line camera on the planar face separately, where the projection vector of each line image pixel is calculated using Formula 3. The texture that is made of the maximal line-image pixels is selected. 2. The texture of the TIN-based ground surface is generated in two steps. First, project and resample the line images of all line cameras on a horizontal plane at almost the same elevation level as the ground surface, where image pixels of line cameras #2 and #5 have higher priorities and will not be covered by those of other line cameras. Second, project each vertex of the TIN model along the direction of range beams to the horizontal plane to create a connection between the TIN-model and the texture image. 3. The texture of trees is generated using synthetic colors, since the projection of line images onto the range points of trees is not reliable, due to occlusions. An example of texture mapping onto a geometric model of Fig. 8b is shown in Fig. 9c.
40
H. Zhao, R. Shibasaki.: Reconstructing a textured CAD model of an urban environment using laser scanners and line cameras
Fig. 10. A map of the testing site
6 Experimental results and discussion An experiment was conducted in a real urban outdoor environment, Kirigaoka apartment complex in Tokyo. The measurement vehicle ran a course of about 1600 m at a speed of 20∼40 km/h. A map of the testing site and the vehicle trajectory is shown in Fig. 10. Over 7000 range scan lines and 30,000 line images were measured by each LD-A and line camera, respectively, as the vehicle moved forward. As an example, the range image measured by LD-A #2 and the strips of line images captured by line cameras #2 and #5 are shown in Fig. 11. It can be seen that except for distortions, buildings, trees, as well as other urban facilities, were captured clearly by each kind of data source with rather high resolution. The arrows in Fig. 11 denote the same objects that were measured in different data sources. All range scan lines and line images were geo-referenced, using the calibration parameters and navigation data. As has been addressed before, the major purpose of exploiting multiple LD-As and line cameras is to reduce occlusion. It is demonstrated in Fig. 12. Figure 12a–c show the range points measured by LD-As #1, #2, and #3, respectively. It can be found that by a single LD-A, only a part of the building surfaces that have large incident angles with laser beams were measured. Figure 12d shows the integrated range points of three LD-As, from which all the building surfaces observable from the road were extracted with more reliability. Perspective views of the extracted surfaces are shown in Fig. 12e, f. A textured CAD model of the Kirigaoka apartment complex was reconstructed by first extracting geometric urban features using the integrated model of range points. In this experiment, there were a total of 7,613,502 range points from the LD-A measurements (Fig. 13a). As shown in Fig. 13b, 155 pieces of vertical building surfaces were extracted. Texture mapping was subsequently conducted, using the geo-referenced line images. Two perspective views of the textured CAD model are shown in Fig. 13c, d, with their view points on the ground and from the air, respectively. All the processes were conducted in a Windows PC with a Pentium III Processor, CPU 500MHz, RAM 256MB. Time cost of the total processing was 3∼4 hours. 7 Conclusion In this paper, a novel method is presented for efficiently generating textured CAD model of urban outdoor environments
Fig. 11. An example of range and line images measured in an urban environment
Fig. 12. Reducing occlusion using multiple laser range and line images: a range points by LD-A #1, b range points by LD-A #2, c range points by LD-A #3, d integrated model of range points, e geometric surface model, f texture surface model
Fig. 13. Perspective views of the textured CAD model of Kirigaoka apartment complex: a integrated range points, b geometric surface model, c textured surface model (viewpoint from the air), d textured surface model (viewpoint on the ground)
using vehicle-borne laser range scanners and line cameras. Both laser range scanners and line cameras are synchronized with a GPS/INS/Odometer-based navigation system, so that the range and line images that are measured by different devices can be geo-referenced onto a world coordinate system. Generating a textured CAD model of urban outdoor environments is conducted in two procedures, where range data are first used to generate a geometric model of urban features and
H. Zhao, R. Shibasaki.: Reconstructing textured CAD model of urban environment using laser scanner and line cameras
then line images are projected and resampled on the geometric model. Through an experiment, it is demonstrated that an urban outdoor environment can be reconstructed with high automation and efficiency. On the other hand, many lessons are learned through the system development. 1. Although laser scanners and line cameras can be aligned to any moving platforms [16], to achieve the same objective, reducing the positioning and calibration errors, especially those from the vibration of the moving platform, is the key issue of the system. It is one of the major difficulties that preventing the success in many further data processing. For example, in this research, line images of different line cameras are not fused to the level of image pixels for two reasons: (a) Due to the positioning and calibration errors, projection vectors of the same line camera have better consistency than those of different line cameras. (b) Brightness and contrast parameters of line images are affected by camera orientations, sunlight, surrounding objects, etc. It is difficult to correct the image pixels of different line cameras automatically to the same level of brightness and contrast without accurate positioning and calibration parameters to solve corresponding problems. 2. There are so many kinds of objects in urban outdoor environments. Do we really need accurate models of all kinds? For example, a tree is one of the major kinds of objects in urban outdoor environments. It occupies almost one-third of the range data, and blocks the texture of many vertical building surfaces in the above experiment. Is it necessary for us to model it as it is in the high expense of computation cost and data size? To what extent is a generalization of the tree acceptable for an application in the sense of speed, accuracy and visualization? Besides trees, there are parked cars, telegraph poles, electric wires, traffic signals, etc., which are also required to be classified and modeled in different strategies. A systematic scheme of classification and model generation of different kinds of urban features is required. Acknowledgements. The authors would like to express their appreciation to Asia Air Survey Co. Ltd. for their long-term cooperation.
References 1. Bosse M, De Couto D, Teller S (2000) Eyes of argus. Georeferenced imagery in urban environments. GPS World, April, pp 20–30 2. Chen Y, Medioni G (1992) Object modelling by registration of multiple range images. Image Vision Comput 10(3):145–155 3. Collins R, Hanson A, Riseman E (1994) Site model acquisition under the UMass RADIUS project. ARPA Image Understanding Workshop, November, pp 351–358 4. Debevec PE, Taylor CJ, Malik J (1996) Modeling and rendering architecture from photographs: A hybrid geometry- and imagebased approach. In: Proceedings of the ACM SIGGRAPH 96, pp 11–20 5. El-Hakim SF, Brenner C, Roth G (1998)A multi-sensor approach to creating accurate virtual environments. JSPRS J Photogram Rem Sens 53:379–391
41
6. Gruen A (1998) TOBAGO – a semi-automated approach for the generation of 3-D building models, ISPRS J Photogram Rem Sens 53(2):108–118 7. Higuchi K, Hebert M, Ikeuchi K (1995) Building 3-D models from unregistered range images. Graph Mod Image Process 57(4):315–333 8. Hoover A, et al (1996) An experimental comparison of range image segmentation algorithms. IEEE Trans PAMI 18(7):1–17 9. Konno T, et al (2000) A new approach to mobile mapping for automated reconstruction of urban 3D model. In: Proceedings of the International Workshop on Urban Multi-Media/3D Mapping (CD-ROM) 10. Rosin PL, West GAW (1995) Nonparametric segmentation of curves into various representations. IEEE Trans PAMI 17(12):1140–1153 11. Sequeira V, et al (1999) Automated reconstruction of 3D models from real environments. ISPRS J Photogram Rem Sens 54:1–22 12. Shum H, Ikeuchi K, Reddy R (1994) Virtual reality modeling from a sequence of range images. In: Proceedings of the IEEE/RSJ International Conference on Intelligent Robots and Systems, pp 703–710 13. Stamos I, Allen PK (2000) 3-D model construction using range and image data. In: Proceedings of the IEEE Conference on Computer Vision and Pattern Recognition (CVPR), Hilton Head, S.C., pp 531–536 14. Uehara M, Zen H (2000) From digital map to 3D map: Creating 3D map by motion stereo utilizing 2D map. In: Proceedings of the IAPR Workshop on Machine Vision Applications (MVA’2000), Tokyo, 28–30 November, pp 592–595 15. Zhao H, Shibasaki R (2000) Reconstruction of textured urban 3D model by ground-based laser range and CCD images. In: IEICE Trans Inf Syst E83-D(7):1429–1440 16. Zhao H, Shibasaki R (2001) High accurate positioning and mapping in urban area using laser range scanner. In: Proceedings of the IEEE Intelligent Vehicles Symposium, Dearborn, Mich., 4 October, pp 125–132 Huijing Zhao obtained B.S. in computer science in 1991 from Peking University, China. From 1991 to 1994, she was recruited by Peking University in a project of developing a GIS platform. She obtained Ph.D in civil engineering in 1999 from the University of Tokyo, Japan. She is now doing post-doctoral research in Center for Spatial Information Science, the University of Tokyo, Japan. Her research interest covers image sensing, computer vision and spatial data acquisition for GIS. Ryosuke Shibasaki obtained M.S. in civil engineering in 1982 from the University of Tokyo. From 1982 to 1988, he worked in Public Works Research Institute, Ministry of Construction. From 1988 to 1991, he was an associate professor of civil engineering department, the University of Tokyo. In 1991, he moved to Institute of Industrial Science, the University of Tokyo. In 1998, he was promoted a professor, Center for Spatial Information Science, the University of Tokyo. His research interest covers 3D data acquisition for GIS, conceptual modeling for spatial objects and agent-based micro simulation in GIS environment.