G
E
O
S
C
I
E
N
C
E
A
U
S
T
R
A
L
I
A
P O S T- C R U I S E R E P O RT
Geomorphology, Sedimentology and Stratigraphy of Submarine Canyons on the SW Australian Slope RV Southern Surveyor, September – October 2005
Record
Andrew D. Heap, Jonathan Edwards, Leharne Fountain, Michele Spinnocia, Michael Hughes, Emma Mathews, Jonathan Griffin, Irina Borissova, Jane Blevin, Cameron Mitchell and Andrew Krassay
2008/16
A P P LY I N G G E O S C I E N C E TO AU ST R A L I A’ S M O ST I M P O RTA N T C H A L L E N G E S
Geoscience Australia Record 2008/16
Geoscience Australia Survey SS08/2005 Post-survey Report
Geomorphology, Sedimentology and Stratigraphy of Submarine Canyons on the SW Australian Slope
RV Southern Surveyor
September – October 2005 Andrew D. Heap, Jonathan Edwards, Leharne Fountain, Michele Spinnocia, Michael Hughes, Emma Mathews, Jonathan Griffin, Irina Borissova, Jane Blevin, Cameron Mitchell and Andrew Krassay Geoscience Australia, GPO Box 378, Canberra, ACT 2601
Department of Resources, Energy and Tourism Minister for Resources, Energy and Tourism: The Hon. Martin Ferguson, AM MP Secretary: Dr Peter Boxall, AO
Geoscience Australia Chief Executive Officer: Dr Neil Williams, PSM © Commonwealth of Australia 2008 This work is copyright. Apart from any fair dealings for the purposes of study, research, criticism or review, as permitted under the Copyright Act 1968, no part may be reproduced by any process without written permission. Copyright is the responsibility of the Chief Executive Officer, Geoscience Australia. Requests and enquiries should be directed to the Chief Executive Officer, Geoscience Australia, GPO Box 378, Canberra City, ACT 2601, Australia. ISSN: 1448‐2177 ISBN: 978‐1‐921498‐13‐8 Hardcopy ISBN: 978‐1‐921498‐14‐5 CD-ROM GeoCat No. 66341 Bibliographic reference: Heap, A.D., Edwards, J., Fountain, L., Spinnocia, M., Hughes, M., Mathews, E., Griffin, J., Borissova, I., Blevin J., Mitchell, C., and Krassay, A., (2008). Geomorphology, Sedimentology and Stratigraphy of Submarine Canyons on the SW Australian Slope – post survey report. Geoscience Australia, Record 2008/16, 138pp. Correspondence for feedback: Sales Centre Geoscience Australia GPO Box 378 Canberra ACT 2601
[email protected]
Geoscience Australia has tried to make the information in this product as accurate as possible. However, it does not guarantee that the information is totally accurate or complete. Therefore, you should not rely solely on this information when making a commercial decision.
ii
Contents
Page
List of Figures ...................................................................................................... vi List of Tables ....................................................................................................... ix Executive Summary............................................................................................ xi 1. Introduction ...................................................................................................... 1 1.1. Background................................................................................................................. 1 1.1.1. Submarine Canyons and Biological Hotspots ...................................................... 2 1.2. Study Area .................................................................................................................. 3 1.2.1. Submarine Canyon Geomorphology..................................................................... 3 1.2.2. Shelf Geomorphology and Sedimentology ............................................................ 5 1.2.3. Oceanography ....................................................................................................... 6 1.2.4. Regional Geology .................................................................................................. 6 1.3. Survey Objectives...................................................................................................... 11 1.4. Survey Participants ................................................................................................... 12 1.4.1. Scientific Personnel ............................................................................................. 12 1.4.2. Ship’s Crew.......................................................................................................... 13
2. Geophysics....................................................................................................... 14 2.1. Data Acquisition........................................................................................................ 14 2.1.1. Multi‐beam (Swath) Sonar.................................................................................. 14 2.1.2. Shallow Seismic Reflection .................................................................................. 14 2.1.3. Side Scan Sonar ................................................................................................... 15 2.2. Data Processing and Analysis ................................................................................. 15 2.2.1. Multi‐beam (Swath) Sonar.................................................................................. 15 2.2.2. Shallow Seismic Reflection Data ......................................................................... 16 2.2.3. Side Scan Sonar Data .......................................................................................... 16 2.3. Results......................................................................................................................... 16 2.3.1. Multi‐beam (Swath) Sonar.................................................................................. 16 2.3.2. Shallow Seismic Reflection .................................................................................. 22 2.3.3. Side Scan Sonar ................................................................................................... 34
3. Oceanography ................................................................................................. 35 3.1. Data Acquisition........................................................................................................ 35 3.1.1. Mooring Description ........................................................................................... 35 3.2. Data Processing and Analysis..................................................................................35 3.2.1. Wind Waves......................................................................................................... 35
iii
Page 3.2.2. Tides ..................................................................................................................... 42 3.2.3. Currents ............................................................................................................... 44
4. Sedimentology ................................................................................................ 50 4.1. Sample Acquisition ................................................................................................... 50 4.1.1. Water Samples ..................................................................................................... 51 4.1.2. Still Camera ......................................................................................................... 52 4.1.3. Surface Sediment Sampling ................................................................................. 53 4.1.4. Subsurface Sediment Sampling ........................................................................... 55 4.1.5. Other Survey Samples ......................................................................................... 56 4.2. Sample Processing and Analysis............................................................................. 56 4.2.1. Water Samples ..................................................................................................... 56 4.2.2. Still Camera ......................................................................................................... 56 4.2.3. Surface Sediment Samples ................................................................................... 58 4.2.4. Subsurface Sediment Samples.............................................................................. 60 4.3. Results......................................................................................................................... 61 4.3.1. Water Samples ..................................................................................................... 61 4.3.2. Still Camera ......................................................................................................... 63 4.3.3. Surface Sediments ................................................................................................ 73 4.3.4. Subsurface Sediments .......................................................................................... 91
5. Basin Geology ................................................................................................. 97 5.1. Petroleum Potential................................................................................................... 97 5.1.1. Vlaming Sub‐basin............................................................................................... 97 5.1.2. Mentelle Basin ..................................................................................................... 98 5.2. Preliminary Dredge Results..................................................................................... 98 5.2.1. Basin Sediments ................................................................................................... 99
6. Discussion and Summary ............................................................................ 100 6.1. Discussion.................................................................................................................. 100 6.1.1. Seabed and Shallow Sub‐surface Sedimentology ................................................ 100 6.1.2. Benthic Biota ....................................................................................................... 101 6.1.3. Petroleum Prospectivity...................................................................................... 102 6.2. Summary ................................................................................................................... 103
7. References ....................................................................................................... 104 8. Acknowledgements ...................................................................................... 111 9. Appendices ..................................................................................................... 112
iv
Page 9.1. Appendix A – Survey Leaders Log ....................................................................... 112 9.2. Appendix B – Shallow Seismic Profiles ................................................................ 119 9.3. Appendix C – CTD Data and Water Samples...................................................... 120 9.4. Appendix D – Still Photographs ............................................................................ 121 9.4.1. Summary Details of Still Photographs ............................................................... 121 9.4.2. Photograph Descriptions .................................................................................... 124 9.5. Appendix E – Dredge Descriptions....................................................................... 127 9.6. Appendix F – Textural Characteristics of Seabed Sediments ............................ 130 9.7. Appendix G – Core Logs......................................................................................... 138 9.8. Appendix H – Textural Characteristics of Sub‐surface Sediments. .................. 138 9.9. Appendix I – Multi‐sensor Core Logger Data...................................................... 138 9.10. Appendix J – Slope Stability Report. ................................................................... 138
v
List of Figures
Page
1. Introduction...................................................................................................... 1 Figure 1.1. Map of SW Australian margin geomorphology and study area............. 4 Figure 1.2. Map of major geologic structure of SW Australian margin..................... 8 Figure 1.3. Stratigraphy, petroleum systems and basin events for Perth Basin. ...... 9 Figure 1.4. Cross‐section of seismo‐stratigraphic units for Perth Basin. .................. 10 Figure 1.5. Interpreted cross‐section of the Mentelle Basin........................................ 10 Figure 1.6. Graph of total number of samples by water depth for AEEZ. ............... 11 Figure 1.7. Photograph of RV Southern Surveyor.......................................................... 12
2. Geophysics....................................................................................................... 14 Figure 2.1. Map of multi‐beam (swath) sonar and sub‐bottom profiler lines....... 17 Figure 2.2. Map of multi‐beam (swath) sonar coverage of Perth Canyon............. 19 Figure 2.3. Map of multi‐beam (swath) sonar bathymetry for the head of the Perth Canyon. ............................................................................................. 19 Figure 2.4. Map of multi‐beam (swath) sonar bathymetry for the Mentelle Basin region. ............................................................................................... 21 Figure 2.5. Map of multi‐beam (swath) sonar bathymetry and sub‐bottom profile for several small tributaries of the Perth Canyon. .................... 23 Figure 2.6. Map of multi‐beam (swath) sonar bathymetry and sub‐bottom profile for large tributary of the Perth Canyon...................................... 25 Figure 2.7. Map of multi‐beam (swath) sonar bathymetry and sub‐bottom profile across a slumped next to the Perth Canyon. ............................. 26 Figure 2.8. Map of multi‐beam (swath) sonar bathymetry and sub‐bottom profile across a thickly sedimented section near the Perth Canyon. .. 27 Figure 2.9. Map of multi‐beam (swath) sonar bathymetry and sub‐bottom profile across possible fluid escape features south of the Perth Canyon......................................................................................................... 29 Figure 2.10. Distribution of acoustic facies in the Perth Canyon region.................. 31 Figure 2.11. Distribution of acoustic facies in the Mentelle Basin region................ 31 Figure 2.12. Multi‐beam (swath) sonar and side‐scan sonar images of two shipwrecks on the Rottnest Shelf............................................................. 33 Figure 2.13. Multi‐beam (swath) sonar bathymetry image of the wreck of HMAS Derwent. .......................................................................................... 33
3. Oceanography ................................................................................................. 35 Figure 3.1. Figure 3.2. Figure 3.3. Figure 3.4. Figure 3.5.
Photo of ADCP current meter mooring.................................................. 36 Graphs of hourly time series of significant wave height...................... 37 Graphs of directional wave spectra......................................................... 38 Graphs of wave autospectra..................................................................... 38 Cumulative frequency and normal probability plots of significant wave height................................................................................................. 39
vi
Page Figure 3.6. Cumulative frequency and normal probability plots of near‐bed wave orbital velocity amplitude.............................................................. 40 Figure 3.7. Cumulative frequency and normal probability plots of wave‐ induced skin friction bed shear stress..................................................... 41 Figure 3.8. Graphs of hourly time series of water depth from the tidal data. ...... 43 Figure 3.9. Graphs of tide and wave current speed and direction at the surface and bed........................................................................................................ 45 Figure 3.10. Graphs of 20 minute time series of current speed and direction at the surface and near the bed. ................................................................... 46 Figure 3.11. Cumulative frequency and normal probability plots of near‐surface current speed.............................................................................................. 47 Figure 3.12. Cumulative frequency and normal probability plots of near‐bed currents speed. ........................................................................................... 47 Figure 3.13. Progressive vector plot showing displacement of the near‐surface and near‐bed currents. .............................................................................. 48 Figure 3.14. Cumulative frequency and normal probability plots of skin friction bed shear stress. ......................................................................................... 48
4. Sedimentology ................................................................................................ 50 Figure 4.1. Multi‐beam (swath) sonar bathymetry image showing location of sample stations for survey SS082005....................................................... 50 Figure 4.2. Photograph of CTD rosette....................................................................... 52 Figure 4.3. Photograph of benthos deep‐sea film camera and strobe.................... 53 Figure 4.4. Diagram of typical camera two configuration....................................... 53 Figure 4.5. Photograph of rock dredge. ..................................................................... 54 Figure 4.6. Photograph of Smith‐McIntyre grab sampler........................................ 54 Figure 4.7. Photograph of benthic sled....................................................................... 55 Figure 4.8. Photographs of gravity corer and deployment system........................ 56 Figure 4.9. Multi‐beam (swath) sonar bathymetry image showing location of samples from previous surveys in the study area. ............................... 57 Figure 4.10. Photograph of water filtering system. .................................................... 57 Figure 4.11. CTD profile showing four major water bodies in study area.............. 62 Figure 4.12. Graphs of temperature, oxygen, salinity and transmission with water depths from CTD casts................................................................... 63 Figure 4.13. Graph of suspended sediment concentrations versus transmission. . 64 Figure 4.14. Graph of water depth versus suspended sediment concentration..... 64 Figure 4.15. Multi‐beam (swath) sonar bathymetry image showing the location of camera stations. ..................................................................................... 65 Figure 4.16. Multi‐beam (swath) sonar bathymetry images showing detailed locations of camera stations. .................................................................... 66 Figure 4.17. Photographs of the seabed from CAM11 and CAM12......................... 68 Figure 4.18. Photographs of the seabed from CAM13. .............................................. 68 Figure 4.19. Photographs of the seabed from CAM13 and CAM09......................... 69 Figure 4.20. Photographs of the seabed from CAM09 and CAM10......................... 69 Figure 4.21. Photographs of the seabed from CAM07 and CAM04......................... 70
vii
Page Figure 4.22. Photographs of the seabed from CAM04 and CAM06. ........................ 70 Figure 4.23. Photographs of the seabed from CAM06. .............................................. 71 Figure 4.24. Photographs of the seabed from CAM03. .............................................. 71 Figure 4.25. Photographs of the seabed from CAM08. .............................................. 72 Figure 4.26. Photographs of the seabed from CAM08 and CAM14. ........................ 72 Figure 4.27. Multi‐beam (swath) sonar bathymetry image showing locations of cores......................................................................................................... 74 Figure 4.28. Multi‐beam (swath) sonar bathymetry image showing locations of dredges, benthic sleds, and grab samples.......................................... 74 Figure 4.29. Multi‐beam (swath) sonar bathymetry image showing fragmentation index for samples collected in the lower Perth Canyon. ...................... 78 Figure 4.30. Multi‐beam (swath) sonar bathymetry image showing fragmentation index for samples collected in the Mentelle Basin region. ................... 78 Figure 4.31. Graph of fragmentation index versus water depth............................... 79 Figure 4.32. Multi‐beam (swath) sonar bathymetry image showing mean grainsize for samples in the Perth Canyon region. ............................... 79 Figure 4.33. Multi‐beam (swath) sonar bathymetry image showing the gravel fraction for samples in the Perth Canyon region................................... 81 Figure 4.34. Multi‐beam (swath) sonar bathymetry image showing the sand fraction for samples in the Perth Canyon region................................... 81 Figure 4.35. Multi‐beam (swath) sonar bathymetry image showing the mud fraction for samples in the Perth Canyon region................................... 82 Figure 4.36. Multi‐beam (swath) sonar bathymetry image showing grainsize bar graphs for samples in the Perth Canyon region. ............................ 82 Figure 4.37. Multi‐beam (swath) sonar bathymetry image showing bulk carbonate contents for samples in the Perth Canyon region. .............. 83 Figure 4.38. Multi‐beam (swath) sonar bathymetry image showing carbonate (sand) contents for samples in the Perth Canyon region. .................... 83 Figure 4.39. Multi‐beam (swath) sonar bathymetry image showing carbonate (mud) contents for samples in the Perth Canyon region. .................... 84 Figure 4.40. Multi‐beam (swath) sonar bathymetry image showing mean grainsize for samples in the Mentelle Basin region............................... 86 Figure 4.41. Multi‐beam (swath) sonar bathymetry image showing the gravel fraction for samples in the Mentelle Basin region. ................................ 86 Figure 4.42. Multi‐beam (swath) sonar bathymetry image showing the sand fraction for samples in the Mentelle Basin region. ................................ 87 Figure 4.43. Multi‐beam (swath) sonar bathymetry image showing the mud fraction for samples in the Mentelle Basin region. ................................ 87 Figure 4.44. Multi‐beam (swath) sonar bathymetry image showing grainsize bar graphs for samples in the Mentelle Basin region............................ 88 Figure 4.45. Multi‐beam (swath) sonar bathymetry image showing carbonate (bulk) contents for samples in the Mentelle Basin region. ................... 88 Figure 4.46. Multi‐beam (swath) sonar bathymetry image showing carbonate (sand) contents for samples in the Mentelle Basin region.................... 89 Figure 4.47. Multi‐beam (swath) sonar bathymetry image showing carbonate (mud) contents for samples in the Mentelle Basin region.................... 89 viii
List of Tables
Page
1. Introduction ...................................................................................................... 1 Table 1.1. Table 1.2.
Scientific survey personnel and their role on the survey..................... 12 Ship’s crew and their role on the survey. ............................................... 13
2. Geophysics....................................................................................................... 14 Table 2.1.
Echo‐types in the study area. ................................................................... 32
3. Oceanography ................................................................................................. 35 Table 3.1.
Amplitudes, phases and errors of the tidal harmonics. ....................... 42
4. Sedimentology ................................................................................................ 50 Table 4.1. Table 4.2. Table 4.3. Table 4.4. Table 4.5. Table 4.6. Table 4.7. Table 4.8. Table 4.9. Table 4.10. Table 4.11. Table 4.12. Table 4.13. Table 4.14.
Station operations. ..................................................................................... 51 Mean grainsize descriptions..................................................................... 59 Summary details of CTD casts collected on the survey. ...................... 62 Summary details of temperature, salinity, dissolved oxygen and transmission for the water bodies present in the study area............... 63 Camera station locations and photographs collected........................... 65 Summary details of cores collected on the survey. ............................... 75 Summary details of benthic sleds collected on the survey. ................. 75 Summary details of grab samples collected on the survey.................. 76 Summary details of dredges collected on the survey........................... 76 Summary details of physical properties of Perth Canyon cores. ........ 93 Summary details of physical properties of Busselton Canyon cores. ............................................................................................................ 94 Summary details of physical properties of Geographe Canyon cores. ............................................................................................................ 95 Summary details of physical properties of Bunbury Canyon cores. ............................................................................................................ 96 Summary details of physical properties of sediment contained in cores from the canyon interfluves. .......................................................... 96
9. Appendices ..................................................................................................... 112 Table 9.1. Table 9.2. Table 9.3. Table 9.4. Table 9.5. Table 9.6. Table 9.7. Table 9.8.
Summary details of suspended sediment samples collected on the survey................................................................................................... 120 Summary details of camera SS08/2005/02CAM01................................ 121 Summary details of camera SS08/2005/07CAM02................................ 121 Summary details of camera SS08/2005/09CAM03................................ 121 Summary details of camera SS08/2005/12CAM04................................ 121 Summary details of camera SS08/2005/19CAM05................................ 122 Summary details of camera SS08/2005/19CAM06................................ 122 Summary details of camera SS08/2005/25CAM07................................ 122 ix
Page Table 9.9. Summary details of camera SS08/2005/27CAM08................................ 122 Table 9.10. Summary details of camera SS08/2005/05CAM09................................ 123 Table 9.11. Summary details of camera SS08/2005/07CAM10................................ 123 Table 9.12. Summary details of camera SS08/2005/30CAM11................................ 123 Table 9.13. Summary details of camera SS08/2005/02CAM12................................ 123 Table 9.14. Summary details of camera SS08/2005/29CAM13................................ 123 Table 9.15. Summary details of camera SS08/2005/01CAM14................................ 124 Table 9.16. Descriptions of still photographs collected on the survey. ................. 124 Table 9.17a. Sedimentology descriptions of dredge sub‐samples. .......................... 127 Table 9.17b. Sedimentology descriptions of dredge sub‐samples continued. ....... 129 Table 9.18. Textural characteristics of seabed sediment samples collected on the survey................................................................................................... 130 Table 9.19. Textural characteristics of seabed sediment samples collected on previous surveys. ...................................................................................... 131 Table 9.20. Mean grainsize and Folk classification of seabed sediments samples collected on the survey............................................................................. 132 Table 9.21. Mean grainsize and Folk classification of seabed sediment samples collected on previous surveys. ................................................................ 133 Table 9.22. Composition point counting results for seabed sediment samples collected on the survey............................................................................. 134 Table 9.23. Composition point counting results for seabed sediment samples collected on the survey, expressed as percentages............................... 135 Table 9.24. Percent total foraminifera and total fragments for seabed sediment samples collected on the survey. ............................................................ 136 Table 9.25. Composition point counting results for seabed sediments samples collected on previous surveys. ................................................................ 137 Table 9.26. Composition point counting results for seabed sediment samples collected on previous surveys, expressed as percentages................... 137 Table 9.27. Percent total foraminifera and total fragments for seabed sediment samples collected on previous surveys.................................................. 137
x
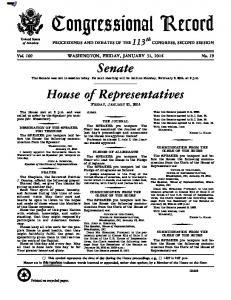
Executive Summary This report contains the preliminary results of Geoscience Australia survey SS08/2005 to the SW margin of Australia. The survey was completed between 28 September and 20 October 2005 using Australia’s national facility research vessel Southern Surveyor. The survey included scientists from Geoscience Australia, CSIRO – Marine and Atmospheric Research, and Victoria Museum. The survey was co‐funded by Geoscience Australia and the Department of the Environment and Heritage (now the Department of the Environment, Water, Heritage and the Arts). The principal scientific objectives of the survey were to: 1. develop an understanding of deep‐water sedimentary processes and benthic biota and habitats in “blind” submarine canyons on the SW Australian margin; 2. document the geological and biological transitions between shelf, slope and offshore platform seabed environments; and 3. investigate the stratigraphy and geology of the Mentelle Basin and assess its implications for petroleum potential. Generally, the sedimentology of the seabed for the blind canyons and shelf‐intruding Perth Canyon is very similar, with the texture and composition of the seabed for both of the study regions consistent with that found across the other Australian margins. The shallow (1200 m). All CTD stations have a similar ~100 m deep well mixed surface layer. The oxygen‐rich and oxygen‐poor water mass boundary varies between 500‐600 m. The oxygen‐poor and cold bottom water mass boundary is consistent at ~1,200 m. Minimum, maximum and average values of temperature, salinity, dissolved oxygen and transmission at the water mass boundaries are shown in Table 4.4. Minimal variation in the four parameters occurs at each water mass boundary, except for dissolved oxygen in surface waters (0‐10 m), which range from 241.7 mmol l‐1 (19CTD04) to 324.4 mmol l‐1 (23CTD05).
61
Survey SS08/2005 – post‐survey report
Table 4.3. Summary details of CTD casts collected on the survey. Latitude
Longitude
Water depth
No. of water samples
Perth Canyon
-32° 03.61'
114° 38.39'
1,356 m
5
03CTD02
Slope
-32° 49.97'
113° 54.22'
2,425 m
9
12CTD03
Bunbury Canyon
-32° 49.49'
113° 51.27'
2,623 m
4
19CTD04
Mentelle Canyon
-32° 59.20'
114° 53.64'
2,199 m
11
23CTD05
Geographe Canyon
-32° 46.90'
114° 08.84'
1,950 m
11
01CTD06
Rottnest Shelf
-32° 02.65'
114° 26.83'
32 m
4
SampleID
Location
02CTD01
Figure 4.11. CTD profile of 02CTD01. The four main water bodies are labelled 14 as in text above.
Surface water (0‐10 m) temperature ranges from 17‐18°C and salinity from 35.69 to 35.78 ‰. Between 0 and 100 m water depth, the water temperature decreases gradually by ~1‐1.5°C. There is a rapid drop in water temperature between 100‐1200 m, from ~16°C to ~3.5°C. Below 1,200 m the water temperature decreases much more gradually, with a minimum recorded temperature of 1.8°C at 2,570 m (12CTD03). Profiles of depth versus temperature, oxygen, salinity and light transmission for the six
62
Sedimentology
Table 4.4. Minimum, maximum and average values for temperature, salinity, dissolved oxygen and transmission at the water mass boundaries shown in Fig. 4.11. Temperature (°C)
Salinity (‰)
Transmission (%)
Dissolved oxygen -1 (mmol l )
Water depth (m)
Min.
Max.
Av.
Min.
Max.
Av.
Min.
Max.
Av.
Min.
Max.
Av.
10
16.93
18.11
17.48
35.69
35.78
35.75
241.7
324.4
302.1
94.69
95.16
95.06
100
15.91
16.45
16.14
35.71
35.75
35.73
311.0
338.3
319.6
95.00
96.43
96.00
600
8.16
8.63
8.31
34.52
34.56
34.53
317.8
343.4
331.7
96.86
97.02
96.96
1,200
3.43
3.64
3.52
34.50
34.51
34.51
230.4
242.8
239.4
97.02
97.08
97.08
2,570*
1.80
34.70
267.6
97.11
*= Maximum water depth of all CTD stations (12CTD03).
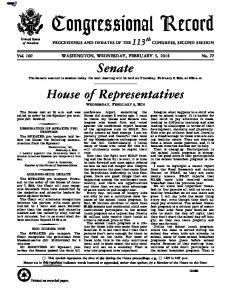
Figure 4.12. Graphs of temperature, oxygen, salinity and transmission profiles for the 6 CTD stations versus water depth.
CTD stations are very consistent (Fig. 4.12). Greatest variation occurs in dissolved oxygen and transmission profiles. Temperature and salinity vary only slightly with depth. There is no correlation between transmission and suspended sediment concentration (SSC) obtained from the filter papers (Fig. 4.13). SSC is highest in the well mixed surface layer (0‐100 m) relative to deeper waters (Fig. 4.14).
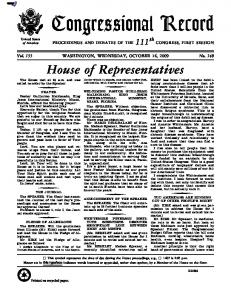
4.3.2. Still Camera A total of 12 camera stations were occupied during the survey with a total of 121 photographs taken (Fig. 4.15; Table 4.5; Appendix D). Camera stations were occupied in Perth Canyon, the three “blind” canyons further south (Busselton, Geographe, Bunbury Canyons), and at several locations on the slope and shelf (Figs. 4.15‐4.16). This survey recovered the first images of deep sea environments in water depths of >2,000 m for the SW region of Australia. Photographs from most stations reveal varying degrees of mottled and bioturbated soft sediment. Seabed features include a diverse and abundant range of deep‐sea
63
Survey SS08/2005 – post‐survey report
0.010 02CTD01 03CTD02
0.009
12CTD03 19CTD04
0.008
-1
SSC (g l )
23CTD05 01CTD06
0.007
0.006
0.005
0.004
0.003 94.0
94.5
95.0
95.5
96.0
96.5
97.0
97.5
98.0
Transmission (%)
Figure 4.13. Graph of suspended sediment concentration (SSC) versus transmission.
0
Water Depth (m)
500
1000
02CTD01 1500
03CTD02 12CTD03 19CTD04
2000
23CTD05 01CTD06 2500 0.004
0.005
0.006
0.007
0.008
0.009
0.010
-1
Suspended Sediment (g l ) Figure 4.14. Graph of water depth verus suspended sediment concentration.
fauna in both the canyons and on the adjacent slope areas. Crustaceans, burrows, trails, faecal pellets and small infaunal mounds are common at most camera stations. Small ball‐shaped sponges are abundant at several stations on the canyon floors (19CAM06, 25CAM07, 07CAM10, 29CAM13) and less abundant on the upper canyon slopes (07CAM02, 12CAM04). At 25CAM07 between 20 and 40 of these sponges are visible in several photographs (see below). Photographs at the two camera stations on the slope (09CAM03 and 27CAM08) show no ball‐shaped sponges, possibly indicating this sponge species prefers canyon floor environments.
64
Sedimentology
Table 4.5. Camera station locations and number of photographs taken.
SampleID
Start latitude
Start longitude
Finish latitude
Finish longitude
Start water depth (m)
Finish water depth (m)
No. of photos
02CAM01
-32° 04.76'
114° 37.12'
-32° 04.76'
114° 37.12'
1,291
1,291
0
07CAM02
-32° 31.11'
114° 19.56'
-32° 31.11'
114° 19.56'
2,369
2,369
1
09CAM03
-32° 53.30'
114° 12.59'
-32° 53.48'
114° 12.59'
1,290
1,290
36
12CAM04
-32° 49.39'
113° 51.48'
-32° 49.75'
113° 51.22'
2,594
2,610
16
19CAM05
-32° 59.23'
113° 53.64'
-33° 00.28'
113° 53.42'
2,160
2,060
0
19CAM06
-32° 59.26'
113° 53.62'
-32° 59.37'
113° 53.62'
2,150
2,150
5
25CAM07
-32° 51.43'
114° 14.95'
-32° 51.60'
114° 15.06'
1,515
1,520
13
27CAM08
-32° 37.31'
114° 25.27'
-32° 37.34'
114° 25.25'
1,090
1,092
11
05CAM09
-32° 35.30'
114° 21.73'
-32° 35.52'
114° 21.77'
1,665
1,657
9
07CAM10
-32° 31.72'
114° 18.36'
-32° 31.95'
114° 18.36'
2,764
2,817
9
30CAM11
-32° 03.69'
114° 38.20'
-32° 04.05'
114° 38.13'
1,280
1,250
7
02CAM12
-32° 03.01'
114° 38.92'
-32° 03.08'
114° 38.92'
2,035
2,030
1
29CAM13
-32° 01.68'
114° 40.87'
-32° 02.05'
114° 40.80'
2,680
2,605
11
01CAM14
-32° 02.64'
114° 26.62'
-32° 02.65'
114° 26.65'
32
34
2
Figure 4.15. Multi-beam (swath) sonar bathymetry image showing the location of camera stations.
65
Survey SS08/2005 – post‐survey report
Figure 4.16. Multi-beam (swath) sonar bathymetry images showing detailed locations for camera stations.
66
Sedimentology
Other diagnostic fauna captured in the photographs include: octocorals (27CAM08, 29CAM13), anemones (29CAM13), whiptail fish (30CAM11), shrimp (09CAM03, 27CAM08), Hexactinellid glass sponge (09CAM03), Galatheoid squat lobster (12CAM04), holothurian (12CAM04), commensal brittlestar (29CAM13), and fish (27CAM08). A brief description of each camera station is provided below with the photographs. All individual photographs and descriptions are presented in Appendix D.
4.3.2.1. Perth Canyon 30CAM11 (upper SE wall; 7 photographs): Mottled sediment with small mounds and holes visible in all photographs (e.g., photograph 04; Fig. 4.17a, b). Other features include faint trails and a whiptail (photograph 04; Fig. 4.17a). 02CAM12 (mid‐SE wall; 1 photograph): Parallel marks possibly man made trawl marks, but look very irregular spacing so possibly a natural feature (Fig. 4.17c). Trails and bioturbation cut over parallel marks. 29CAM13 (lower canyon floor; 11 photographs): Mottled sediment, cylindrical shaped holothurian faeces, ball shaped sponges (photograph 05; Fig. 4.19a), small mounds, trails and burrow holes are visible in most photos. Several long trails are visible in photograph 02 (Fig. 4.18a). Five large holes most likely crustacean burrows are visible in photograph 03 (Fig. 4.18b). Photograph 04 (Fig. 4.18c) reveals long straggling colonies covering most of the surface. Other features in photograph 04 include two branching octacorals, one with a commensal brittlestar attached, and an anemone. In photograph 06 (Fig. 4.19b) large spiral trail of Enteropnenst (Acorn worm) faeces is visible.
4.3.2.2. Busselton Canyon 07CAM02 (NE canyon wall; 1 photograph): Mottled, bioturbated sediment with trails, faecal pellets and a ball shaped sponge visible. 05CAM09 (canyon head; 8 photographs): Mottled sediment is visible in all photos. Trails likely from molluscs, small holes and mounds are visible in most photos (e.g., photographs 02 and 08; Fig. 4.19c and Fig. 4.20a, respectively). 07CAM10 (canyon floor; 7 photographs): Mottled sediment, trails and small mounds are visible in all photographs (e.g., Photographs 01 and 07; Fig. 4.20b, c). Other features include small ball‐shaped sponges (photographs 01 and 07), fan trail (photograph 01), crustacean in burrow (photograph 01) and cylindrical faeces (photograph 01).
4.3.2.3. Geographe Canyon 25CAM07 (upper canyon floor; 13 photographs): Mottled sediment with holes and trails are visible in most photographs. Two large burrows are visible in photograph 04 (Fig. 4.21a). Small ball‐shaped sponges are visible in all photographs with extensive coverage (20 to 40 individuals) (e.g., photograph 10; Fig. 4.21b).
4.3.2.4 Bunbury Canyon 12CAM04 (upper canyon wall; 11 photographs): All photographs show mottled sediment. A holothurian about 0.25 m long is visible in photograph 11 (Fig. 4.21c), and a Galatheoid squat lobster is visible in photograph 16 (Fig. 4.22b). Camera station 12CAM04 is located on the steep NE flank of Bunbury Canyon and photograph 04 reveals a piece of rubble possibly indicating hard ground below a thin veneer of sediment. The presence of
67
Survey SS08/2005 – post‐survey report
Figure 4.17. a) 30CAM11_4, b) 30CAM11_7, c) 02CAM12_1 (Perth Canyon).
Figure 4.18. a) 29CAM13_2, b) 29CAM13_3, c) 29CAM13_4 (Perth Canyon).
68
Sedimentology
Figure 4.19. a) 29CAM13_5, b) 29CAM13_6 (Perth Canyon), c) 05CAM09_2 (Busselton Canyon).
Figure 4.20. a) 05CAM09_8, b) 07CAM10_1, c) 07CAM10_7 (Busselton Canyon)
69
Survey SS08/2005 – post‐survey report
Figure 4.21. a) 25CAM07_4, b) 25CAM07_10 (Geographe C.), c) 12CAM04_11 (Bunbury C.).
Figure 4.22. a) 12CAM04_12, b) 12CAM04_16, c) 19CAM06_01 (Bunbury Canyon).
70
Sedimentology
Figure 4.23. a) 19CAM06_3, b) 19CAM06_4, c) 19CAM06_5 (Bunbury Canyon).
Figure 4.24. a) 09CAM03_14, b) 09CAM03_17, b) 09CAM03_29 (Slope).
71
Survey SS08/2005 – post‐survey report
Figure 4.25. a) 27CAM08_1, b) 27CAM08_3 (Slope).
Figure 4.26. a) 27CAM08_7 (Slope), b) 01CAM14_1 (Shelf).
rubble may indicate the presence of hard ground that sessile organisms could attach too. The recovery of a variety of hard rocks from the dredging program within the canyons also indicates that these hard‐grounds are common and located just below the surface sediments. 19CAM06 (upper canyon floor; 5 photographs): Mottled and bioturbated sediment with small and large trails and holes are visible. A wide trail is visible in photograph 01 and is probably formed by a mollusc (Fig. 4.22c). Other features include a raised spiral trail of Enteropnenst (Acorn worm) faeces (photograph 03; Fig. 4.23a), several holes and fan‐shaped feeding trails probably from crustaceans or worms, and small ball‐shaped sponges (photograph 04 and 05; Fig. 4.23b, c).
4.3.2.5. Canyon Interfluves and shelf camera stations 09CAM03 (slope near Geographe Canyon; 29 photographs): All sea floor photographs reveal mottled sediment commonly with trails, small mounds and crustacean and worm holes (e.g., photograph 17; Fig. 4.24b). A stalked glass sponge (hexactinellid) is visible in
72
Sedimentology
photograph 14 (Fig. 4.24a). Other features included a small shrimp (photograph 29; Fig. 4.24c). A shrimp on the seafloor is also visible in photograph 31. 27CAM08 (slope near Busselton Canyon; 11 photographs): Mottled sediment with holes, trails and mounds are visible in most photographs. Other features include two species of stalked octocoral (photograph 01; Fig. 4.25a), single stalked octocoral (photograph 03; Fig. 4.25b), fish or eel (photograph 01; Fig. 4.25a), swimming shrimp (photograph 07; Fig. 4.26a). Swimming shrimps are also visible in photographs 09 and 11. 01CAM14 (shelf east of Perth Canyon; 1 photograph): One photograph (Fig. 4.26b) with Eckolonia kelp, other brown algae and two footballer sweep fish (Neafypus obliquus).
4.3.3. Surface Sediments A total of 66 surface samples were analysed for grainsize, carbonate content and 42 samples were inspected for composition. Thirty‐five samples were from this survey (Figs. 4.27& 4.28; Tables 4.5‐4.8) and 31 from previous surveys (Fig. 4.9 & 4.10). Brief compositional descriptions and colour of samples are provided in Tables 4.5‐4.8. Full sedimentological descriptions of dredge samples are contained in Appendix E.
4.3.3.1. Regional surface sediment composition Forty‐two surface samples were inspected for composition. Thirty‐five samples were from this survey, two from SS07/2005 (GA296), three from SS09/2005 and two from BMR80. Most surface samples are very poorly sorted, nannofossil oozes. Visual examination of the fine sand fraction (63‐150 μm) revealed that radiolarians, sponge spicules, planktic foraminifera and biogenic fragments are abundant in all samples. Sediments of the coarse fraction (125‐ 2,000 μm) are principally composed of nannofossils, including: planktic and benthic foraminifera, radiolarians, ostracods, and pteropods. Sponge spicules are also common in many samples. Planktic foraminifera are the dominant constituent of sediments of the lower slope and submarine canyons. By contrast, the upper slope sediments are primarily composed of benthic foraminifera. Two samples located in the upper Perth Canyon (80/DR04 and 80/DR05) are mostly composed of skeletal fragments of shelf origin. Results of the quantitative analysis of the individual grains in the 125‐2,000 μm sediment fraction are described in this section. The full results are located in Appendix F. Foraminifera: The primary constituent in most samples are planktic foraminifera which make up between 12.2% and 97.1% of the sample, with an average of 73.5%. Only seven samples comprise