Pak. J. Statist. 2011 Vol. 27(3), 307-325 RECORD VALUES OF THE RATIO OF RAYLEIGH RANDOM VARIABLES M. Shakil1 and M. Ahsanullah2 Department of Mathematics, Miami Dade College, Hialeah Campus, Hialeah, USA. Email:
[email protected] 2 Department of Management Sciences, Rider University, Lawrenceville, NJ 08648, USA. Email:
[email protected] 1
ABSTRACT The Rayleigh distribution plays a pivotal role in the study of records because of its wide applicability in the modeling and analysis of life time data in these fields. In this paper, the distribution of the record values of the ratio of two independently distributed Rayleigh random variables has been investigated. The associated cdf, pdf, moment, hazard function, Shannon entropy, etc., have been derived. To describe the possible shapes of the associated pdf and entropy, the respective plots are provided. The percentage points associated with the cdf of the ratio have been tabulated. We hope that the findings of this paper will be a useful reference for the practitioners in various fields of studies and further enhancement of research in record value theory and its applications. KEYWORDS AND PHRASES Cumulative distribution function; entropy; moments; probability density function; Rayleigh distribution; ratio; record values. 2000 Mathematics Subject Classifications: 33C90, 60E05, 62E10, 62E15, 62G30. 1. INTRODUCTION The distribution of the ratio of independent random variables arises naturally in many applied problems of biology, economics, engineering, genetics, hydrology, medicine, number theory, order statistics, physics, psychology, etc. It is one of the important research areas both from theoretical and applications point of view. Some of the notable examples are the ratios of inventory in economics, ratios of inheritance in genetics, ratios of target to control precipitation in meteorology, ratios of mass to energy in physics, among others. For details on these, the interested readers are referred to Grubel (1968), Rokeach and Kliejunas (1972), Ladekarl et al. (1997), Sornette (1998), Cigizoglu and Bayazit (2000), and Galambos and Simonelli (2005), and references therein. The distributions of the ratio YX , when X and Y are independent random variables and belong to the same family, have been studied by many researchers, see, for example, Press (1969), Malik and Trudel (1986), Pham-Gia (2000), Ali et al. (2007), and Khoolenjani and Khorshidian (2009), among others. Recently, some researcher have also studied the distributions of the ratio YX , when
X and Y are independent random variables and belong to different families, see, for example, Shakil et al. (2006, 2008), among others. It appears from literature that, despite © 2011 Pakistan Journal of Statistics
307
308
Record Values of the Ratio of Rayleigh Random Variables
many researchers have studied the Rayleigh distribution, its characterizations and inferences based on it, not much attention has been paid to the studies for record values of the ratio of Rayleigh independent random variables. For detailed treatment on Rayleigh distribution, the interested readers are referred to Johnson et al. (1994), and references therein. In this paper, the distribution of the record values of the ratio
R1 R2
, when R1 and R2
are Rayleigh random variables and distributed independently of each other, has been investigated. The organization of this paper is as follows. In Sections 2, distribution of the ratio of two independent Rayleigh random variables has been provided. Section 3 contains distribution of record values of the ratio of two independent Rayleigh random variables. In Sections 4, distributional properties of record values for the ratio of two independent Rayleigh random variables are presented. The percentage points associated with the cumulative distribution function (cdf) of record values for the ratio of two independent Rayleigh random variables have been tabulated in Section 5. Some concluding remarks are given in Section 6. 2. RATIO OF RAYLEIGH RANDOM VARIABLES A random variable (rv) R is said to have a Rayleigh distribution if its probability density function (pdf) is given by
1 r exp 2 f r 0
1 2 2
r
2
,
r 0, 0
(2.1)
otherwise,
where 0 is known as the scale parameter of Rayleigh () distribution. The corresponding cdf F (r ) and the hazard rate h(r ) of the rv R with pdf as given in (2.1) are respectively
F r 1 exp and
1 22
r
2
,
h r f r 1 F r
1 2
r,
where r 0, 0 . The Rayleigh distribution has a linearly increasing failure rate
h r K r , where r 0 and K
1 2
0 . The mean, variance, and entropy of the
Rayleigh rv R are, respectively, given by
E R
, V R 2 1 2
2
4
, and H R f (r ) 1 12
C ln
, 2
j 1 where C 1 lim k 1 ln j 1 0.577216 denotes Euler's constant, and j k 1 z denotes digamma function.
Shakil and Ahsanullah
309
Ratio of Rayleigh Random Variables: Suppose R1 and R2 are independent and identically distributed ( i.i.d . ) random variables which are Rayleigh with parameters and , respectively, in 0, , and R1 R2
pdf's given by the equation (2.1). Suppose X
. Then X defines a random variable.
Using the Equation (3.381.4), Page 317, Gradshtetn and Ryzhik (2000), one can easily
X
see that the pdf and cdf of the ratio
f X x r2 f R1 x r2 f R2 r2 dr2
R1 R2
2 2 2 x
0
2 x 2 2
2
2
are, respectively, given by ,
(2.2)
and
FX x FR1 x r2 f R2 r2 dr2 1 2 2 2 , x
(2.3)
0
where x 0 , 0 and 0 . Ratio of two independent Rayleigh variables has the distribution of the square root of the Pareto random variable with the shape parameter 1. Using the Equation (3.194.3), Page 285, Gradshtetn and Ryzhik (2000), one can easily see that the kth moment of the ratio X
E X k
R1 R2
is given by
B 22 k , 22k , k
(2.4)
where 0 , 0 , 2 k 2 , and B . denotes beta function. 3. RECORD VALUES OF THE RATIO OF RAYLEIGH RANDOM VARIABLES An observation is called a record if its value is greater than (or analogously, less than) all the preceding observations. The development of the general theory of statistical analysis of record values began with the work of Chandler (1952). Further development on record value distributions such as estimation of parameters, prediction of record values, characterizations, reconstruction of past record values, etc., continued with the contributions of many authors and researchers, among them Foster and Stuart (1954), Renyi (1962), Shorrock (1973), Resnick (1973), Glick (1978), Dunsmore (1983), Nagaraja (1988), Houchens (1984), Ahsanullah (1980, 2004, 2006), Samaniego and Whitaker (1986), Nevzorov (1988), Kamps (1995), Qasem (1996), Arnold et al. (1998), Rao and Shanbhag (1998), Awad and Raqab (2000), Gulati and Padgett (2003), Al-Hussaini and Ahmad (2003), Klimczak and Rychlik (2005), Ahmadi et al. (2005), and Ahsanullah et al. (2010) are notable. Recently, the reconstruction of past records (which may also be viewed as the missing records) based on observed records have been considered by Balakrishnan et al. (2009). Suppose that X n n 1 is a sequence of i.i.d .
random variables with cdf F . Let Yn max min X j | 1 j n for n 1 . We say
X j is an upper (lower) record value of
X n
| n 1 if Y j Y j
1,
j 1 . By
310
Record Values of the Ratio of Rayleigh Random Variables
definition X1 is an upper as well as a lower record value. The indices at which the upper record values occur are given by the record times
U n min
j | j U n 1 , X
U n , n 1 ,
where
X U n 1 , n 1 and U 1 1 . Many properties of the upper record value sequence can be expressed in terms of the cumulative hazard rate function R x ln F x , where F x 1 F x , 0 F x 1 . If we define j
Fn x as the cdf of X U n for n 1 , then we have x Fn x
R u
n 1
n
dF u , x ,
from which it is easy to see that
R x
Fn x 1 F x nj 10
j 1
j
,
(3.1)
that is,
R x
F n x F x nj 10
j 1
j
.
The pdf of X U n , denoted by f n is
fn x
R x
n 1
f x , x .
n
It is easy to see that F n x F n 1 x F ( x)
(3.2) fn x f
x
. For detailed treatment of the
upper record values, see Ahsanullah (2004). From here onward, for simplicity, the nth upper record value X U n will be denoted by X (n) . Using equation (3.2), the pdf
f n x of the nth record value X (n) of the ratio of Rayleigh independent random variables with pdf (2.2) and cdf (2.3) is given by fn x
ln
2 x 2 2 2
n
n 1
2 2 2 x 2 x 2 2
2
, n 1, 2, 3,... ,
(3.3)
where x 0 , 0 and 0 . Note that the distribution of the first record value is the distribution of the parent ratio of Rayleigh independent random variables. Using equation (3.3) and definition of incomplete gamma function, the cdf Fn of the nth record value
X (n) of the ratio of Rayleigh independent random variables is easily given by Fn x
n , ln x 2 n 2 2
2
,
n 1, 2, 3,... ,
(3.4)
Shakil and Ahsanullah
311 z
where x 0 , 0 , 0 , and (, z ) t
1 t
e dt , 0 , denotes incomplete
0
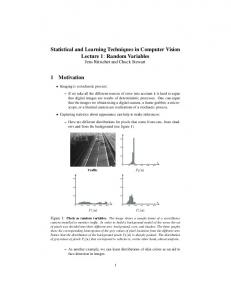
gamma function. The possible shapes of the pdf (3.3) and cdf (3.4) of the nth record value X (n) of the ratio of Rayleigh independent random variables, when n 2,5,10 , are provided for some selected values of the parameter, that is, (i) 1 and 1, 2,3,5 , and (ii) 1 and 1, 2,3,5 in Figures 3.1 and 3.2, respectively. The effects of the parameters can easily be seen from these graphs. For example, it is clear from the plotted Figures 3.1 - 3.2, for selected values of the parameters, the distributions of the random variable X (n) are unimodal and positively (right) skewed with longer and heavier right tails. (a) n = 2
(b) n = 5
(c) n = 10
Fig. 3.1: PDF Plots for (a) n 2 , 1 and 1, 2,3,5 (above left); (b) n 5 , 1 and 1, 2,3,5 (above right); (c) n 10 , 1 and 1, 2,3,5 (below).
312
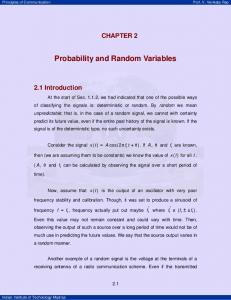
Record Values of the Ratio of Rayleigh Random Variables (a) n = 2
(b) n = 5
(c) n = 10
Fig. 3.2: PDF Plots for (a) n 2 , 1 and 1, 2,3,5 (above left); (b) n 5 , 1 and 1, 2,3,5 (above right); (c) n 10 , 1 and 1, 2,3,5 (below). 4. DISTRIBUTIONAL PROPERTIES OF RECORD VALUES OF THE RATIO OF RAYLEIGH RANDOM VARIABLES In this section, we will derive the moments, survival and hazard functions, and entropy of the sequence of record values, { X (n)}, n 1 , obtained from the ratio of two independent Rayleigh random variables. 4.1. Moments: The kth moment of the nth record value X (n) when the parent distribution is the ratio of two independent Rayleigh random variables with the pdf (3.3) is given by
E X k ( n)
ln k 0 x
2 x 2 2 2
n
n 1
2 2 2 x 2 x 2 2
2
dx .
(4.1)
Shakil and Ahsanullah Substituting ln
2 x 2 2 2
313
u in equation (4.1), using the binomial series
(1 t ) q 1 j 0
j q q 1... q j 1 j t j!
,
and definition of gamma function, that is,
t
a 1
0
e b t dt
1 ba
() , b 0 , the
expression for the kth moment of the nth record value X (n) of the ratio of Rayleigh random variables with the pdf (3.3) is easily obtained as
E X k ( n)
k
1
k j 2
j 0
k2 1... k2 j 1 , n j ! 1 k2 j
(4.2)
where 0 , 0 , and 2 k 2 . Taking n 1 in (4.2), and using the series representation of the beta function (see equation 3.382.1, page 950, Gradshteyn and Ryzhik (2000)), the expression for the kth moment reduces to
E X k
k
B 1 k2 ,1
k 2
,
where 0 , 0 , 2 k 2 , and B . denotes the beta function, and which, as was expected, is the same as the kth moment given by equation (2.4) of the first record value of the parent distribution of the ratio of two independent Rayleigh random variables. 4.2 Representation of Records In this subsection, we will give the representation of the nth record value X (n) as sum of n independent random variables when the parent distribution is the ratio of two independent Rayleigh random variables. We will also use representation theorem, to derive the moments of the record values. Consider the cdf (1.3) of the ratio given by
F ( x) 1
2 2 x 2 2
,
that is,
F 1 ( x)
x 1 x
.
Suppose that
g F ( x) ln 1 F ( x) ln
2 2
x 2 2
.
Then n in1g F xi i 1 ln
2 xi2 2
2
ln in1
2 xi2 2 2
,
314
Record Values of the Ratio of Rayleigh Random Variables
or
1 e
ln in1
2 xi2 2 2
1 in1
2 2 xi2 2
.
Further, the inverse of the function
g F ( x ) ln(1 F ( x))
is given by
g F1 ( x) F 1 (1 e x ) . Thus
g F1 in1g F ( xi ) F 1 1 in1 2 2 2 x
2
i
2 2 xi2 2 2 in1 2 2 2 xi
1 in1
.
Hence, using Representation Theorem, Theorem 8.4.1, page 256, Ahsanullah (2004), we have d
XU (n)
2 2 X i2 2 2 in1 2 2 2 X i
1 in1
,
(4.3)
where X i , i 1, 2,..., n are i.i.d with cdf (1.3), that is, F ( x) 1 Moments: If n 1 , then from the equation (4.3), we have d
X U (1) X . Now, the moment generating function of X is
M X (t ) 0etx
0etx
2 2 2 x 2 x 2 2 2 2 2
Let
2 2
2 2
x
x 2 1
2
2
dx
dx .
x 2 u , then
M X (t ) 0
t u
e u 12
du ,
from which, after differentiation, we obtain
2 2 x 2 2
.
Shakil and Ahsanullah
M X/ (0) 0 u
315 1 u 12
M X// (0) ( )2 0
du
1 2
E( X ) ,
du .
u
u 12
Now, we consider
E X (1)
1
0 x1
2 2 2 x 2 x 2 2
( )1 0u
1 2
2
1
u 12
dx , 0 1 , du .
If 0.2 , then
E X (1)
1.2
( )1.2 0u 0.6
1
u 12
du
1.98196 ( )1.2 .
In fact, 0 E X (1)
1
, for all , 0 1 . Since E X 1
exists for all ,
0 1 , therefore, by Theorem 1.3.1, page 15, Ahsanullah (2004), all the first moments of the upper records exist. Now
E X1(1) 0 1x 0 1x
2 2 2 x 2 x 2 2 2 2
2
x
2 x 2 1 2
1 1 0 t t 12
1 2
2
2
2
dx
dx
dt
.
Also, we have 2
E X1(1) ( )2 0 1t 1 2 dt , t 1 since 0 1t
1
t 12
dt . It is evident from the above analysis that only the moment of
order k 1 and the first negative moment of the nth record value X (n) of the ratio of Rayleigh independent random variables exist. The second and higher moments do not exist. Further, note that
E X (1)
1 X (1)
2
2
2 2 2
2 .2 ,
316
Record Values of the Ratio of Rayleigh Random Variables
where 0 , 0 , see, for example, Balakrishnan and Nevzorov (2003), among others. 4.3 Survival and Hazard Functions The survival and hazard functions of the nth record value X (n) with the pdf (3.3) and cdf (3.4) are, respectively, given by
Sn x 1 Fn x 1
n , ln x 2 n 2 2
2
,
(4.4)
and fn x
hn x 1 F
n
x
2 2 2 2 2 2 x ln x 2 2 x 2 2 n n , ln 2
n 1
2 x 2 2
2
,
(4.5)
where x 0 , 0 , 0 , and n 1, 2,3,... . The possible shapes of the hazard function (4.5), when n 2,5,10 , are provided for some selected values of the parameter, that is, (i) 1 and 1, 2,3,5 , and (ii) 1 and 1, 2,3,5 in Figures 4.1 and 4.2, respectively. The effects of the parameters can easily be seen from these graphs. For example, it is clear from the plotted Figures 4.1 - 4.2, for selected values of the parameters, the hazard functions have upside down bathtub shapes, and are unimodal and positively (right) skewed with longer and heavier right tails.
Shakil and Ahsanullah
317
(a) n = 2
(b) n = 5
(c) n = 10
Fig. 4.1: Hazard function plots for (a) n 2 , 1 and 1, 2,3,5 (above left); (b) n 5 , 1 and 1, 2,3,5 (above middle); (c) n 10 , 1 and 1, 2,3,5 (right).
318
Record Values of the Ratio of Rayleigh Random Variables (a) n = 2
(b) n = 5
(c) n = 10
Fig. 4.2: Hazard function plots for (a) n 2 , 1 and 1, 2,3,5 (above left); (b) n 5 , 1 and 1, 2,3,5 (above middle); (c) n 10 , 1 and 1, 2,3,5 (right). 4.4 Entropy An entropy provides an excellent tool to quantify the amount of information (or uncertainty) contained in a random observation regarding its parent distribution (population). A large value of entropy implies the greater uncertainty in the data. As proposed by Shannon (1948), entropy of an absolutely continuous random variable X having the probability density function X x is defined as
Shakil and Ahsanullah
319
H X E ln X x X x ln X x dx , where S x : X x 0 .
(4.6)
S
Shannon Entropy: Thus, using the equation (4.6), expansion for the log function, and equations 3.194.3/p. 950, 4.293.14/p. 558, and 4.352.1/p. 576 of Gradshteyn and Ryzhik (2000), along with the properties of gamma and digamma functions (for details, see Abramowitz & Stegun (1970), among others), Shannon entropy of the nth record value X (n) with the pdf (3.3) is easily obtained as
H n ln
n 2
3 2
n n 1 n 12
1
j 1 j
j 1n
,
(4.7)
where z denotes digamma function. From equation (4.7), it is easily seen that i) the sequence
H of the Shannon entropies of record values n
X (n) with the
pdf (3.3) is monotonic increasing in n , 0 , 0 , which follows from the 1 1 definition of digamma function and the inequality ln z z , 2z z
z 0 , see Alzer (1997), and noting that j 11 j 1
which is less than the geometric series
1
n j 1 2
therefore
1
j 1 j 1
ii) the sequence
n1
j
n1
is a series of positive term
with common ratio
1 2n
1 and
is convergent since n 1 1 ;
H of the Shannon entropies of record values n
X (n) with the
pdf (3.3) is a monotonic increasing function of , 0 , 0 , and integer n 1 , which follows from (4.7) by differentiating it w. r .t. ; and iii) the sequence
H of the Shannon entropies of record values n
X (n) with the
pdf (3.3) is a monotonic decreasing convex function of , 0 , 0 , and integer n 1 , which follows from (4.7) by differentiating it twice w. r. t. . The above behavior of Shannon entropy, for some selected values of the parameters, can easily be seen from the following graphs 4.3-4.5.
320
Record Values of the Ratio of Rayleigh Random Variables (a)
(b)
Fig. 4.3: Entropy function plots for (a) 1 , 1, 2,3,5 and n 1, 2,...,15 (left); and (b) 1 , 1, 2,3,5 and n 1, 2,...,15 (right). (a)n = 2
(b)n= 5
(c)n = 10
Fig. 4.4: Entropy function plots for (a) n 2 , 1, 2,3,5 , and 0 (above left); (b) n 5 , 1, 2,3,5 , and 0 (above right); (c) n 10 , 1, 2,3,5 and 0 (below).
Shakil and Ahsanullah
321
(a)n = 2
(b)n= 5
(c)n = 10
Fig. 4.5: Entropy function plots for (a) n 2 , 1, 2,3,5 , and 0 (above left); (b) n 5 , 1, 2,3,5 , and 0 (above right); (c) n 10 , 1, 2,3,5 , and 0 (below). 5. PERCENTILES This section computes the percentage points of our newly proposed distribution with the pdf as given in (3.3). For any 0 p 1 , the 100 pth percentile (also called the quantile of order p ) of the new distribution with the pdf f n x of the nth record value
X (n) of the ratio of Rayleigh independent random variables is a number x p such that the area under f n x to the left of x p is p . That is, x p is any root of the following equation
xp
Fn x p f n u du p . 0
Thus, by numerically solving the above equation for the cdf in (3.4) using a Maple 11 program, percentage points x p associated with the cdf of the nth record value X (n) of
322
Record Values of the Ratio of Rayleigh Random Variables
the ratio of Rayleigh independent random variables are computed for some selected values of the parameters. These are provided in the Tables 5.1-5.6. Table 5.1 Percentage Points of the New Distribution for n 2 , 75 % 80 % 85 % 90 % 1 3.7109 4.3556 5.3056 6.9208 2 1.8554 2.1778 2.6528 3.4604 3 1.2370 1.4519 1.7685 2.3069 5 0.7422 0.8711 1.0611 1.3842
1 and 95 % 10.6713 5.3357 3.5571 2.1343
1, 2,3,5 . 99 % 27.6195 13.8097 9.2065 5.5239
Table 5.2 Percentage Points of the New Distribution for n 5 , 75 % 80 % 85 % 90 % 1 23.0179 28.7859 37.8312 54.4142 2 11.5090 14.3930 18.9156 27.2071 3 7.6726 9.5953 12.6104 18.1381 5 4.6036 5.7572 7.5662 10.8828
1 and 95 % 97.1938 48.5970 32.3980 19.4387
1, 2,3,5 . 99 % 331.0628 165.5314 110.3543 66.2126
Table 5.3 Percentage Points of the New Distribution for n 10 , 1 and 1, 2,3,5 . 75 % 80 % 85 % 90 % 95 % 99 % 1 386.4180 522.8918 753.2477 1215.6021 2572.4348 11986.7685 2 193.2090 261.4459 376.6239 607.8011 1286.2174 5993.3842 3 128.8060 174.2973 251.0826 405.2007 857.4783 3995.5895 5 77.2836 104.5784 150.6495 243.1204 514.4870 2397.3537 Table 5.4 Percentage Points of the New Distribution for n 2 , 75 % 80 % 85 % 90 % 1 3.7109 4.3556 5.3056 6.9208 2 7.4217 8.7113 10.6112 13.8416 3 11.1326 13.0669 15.9169 20.7623 5 18.5543 21.7782 26.5281 34.6039
1 and 95 % 10.6713 21.3427 32.0140 53.3567
Table 5.5 Percentage Points of the New Distribution for n 5 , 75 % 80 % 85 % 90 % 1 23.0179 28.7859 37.8312 54.4142 2 46.0358 57.5718 75.6624 108.8285 3 69.0537 86.3578 113.4937 163.2427 5 115.0895 143.9296 189.1561 272.0712
1 and 1, 2,3,5 . 95 % 99 % 97.1938 331.0628 194.3875 662.1257 291.5813 993.1885 485.9688 1655.3142
1, 2,3,5 . 99 % 27.6195 55.2390 82.8584 138.0974
Shakil and Ahsanullah
323
Table 5.6 Percentage Points of the New Distribution for n 10 , 1 and 1, 2,3,5 . 75 % 80 % 85 % 90 % 95 % 99 % 1 386.4180 522.8918 753.2477 1215.6021 2572.4348 11986.7685 2 772.8360 1045.7836 1506.4955 2431.2042 5144.8697 23973.5370 3 1159.2540 1568.6754 2259.7432 3646.8064 7717.3045 35960.3054 5 1932.0900 2614.4591 3766.2387 6078.0106 12862.1742 59933.8424 6. CONCLUDING REMARKS In this paper, we have discussed the distribution of record values when the parent distribution is the ratio of two independently distributed Rayleigh random variables. The associated cdf, pdf, moment, hazard function, entropy, etc., have been derived. To describe the possible shapes of the associated pdf, hazard function and entropy, the respective plots are provided. The percentage points associated with the cdf of the ratio have been tabulated. It is observed from the plotted figures of pdfs, for selected values of the parameters, that the distributions of the random variable X (n) are unimodal and positively (right) skewed with longer and heavier right tails. The hazard functions have upside down bathtub shapes, and are unimodal and positively (that is, right) skewed with longer and heavier right tails. We hope that the findings of this paper will be a useful reference for the practitioners in various fields of studies and further enhancement of research in record value theory and its applications. ACKNOWLEDGMENT The authors would like to thank the editor and the referees for their useful comments and suggestions which considerably improved the presentation of the paper. REFERENCES 1. Abramowitz, M. and Stegun, I.A. (1970). Handbook of Mathematical Functions, with Formulas, Graphs, and Mathematical Tables. New York: Dover. 2. Ahmadi, J., Doostparast, M. and Parsian, A. (2005) Estimation and prediction in a two parameter exponential distribution based on k-record values under LINEX loss function. Commun. Statist. Theor. Meth., 34, 795-805. 3. Ahsanullah, M. (1980). Linear Prediction of Record Values for the Two Parameter Exponential Distribution. Ann. Inst. Statist. Math., 32, A, 363-368. 4. Ahsanullah, M. (2004). Record Values-Theory and Applications. University Press of America, Lanham, MD. 5. Ahsanullah, M. (2006). The generalized order statistics from exponential distribution. Pak. J. Statist., 22(2), 121-128. 6. Ahsanullah, M., Hamedani, G.G. and Shakil, M. (2010). On record values of univariate exponential distribution. J. Statist. Res., 44(2), 267-288. 7. AL-Hussaini, E.K. and Ahmad, A.A. (2003). On Bayesian interval prediction of future records. Test, 12, 79-99. 8. Ali, M.M., Pal, M. and Woo, J. (2007). On the Ratio of Inverted Gamma Variates. Aust. J. Statist., 36(2), 153-159.
324
Record Values of the Ratio of Rayleigh Random Variables
9. Alzer, H. (1997). On some inequalities for the gamma and psi functions. Math. Comp., 66, 373-389. 10. Arnold, B.C., Balakrishnan, N. and Nagaraja, H.N. (1998). Records. John Wiley & Sons Inc., New York. NY. 11. Awad, A.M. and Raqab, M.Z. (2000). Prediction intervals for the future record values from exponential distribution: comparative study. J. Statist. Comput. Simul., 65, 325-340. 12. Balakrishnan, N., Doostparast, M. and Ahmadi, J. (2009). Reconstruction of past records. Metrika, 70, 89-109. 13. Balakrishnan, N. and Nevzorov, V.B. (2003). A Primer of Statistical Distributions. John Wiley & Sons, N.J. 14. Chandler, K.N. (1952). The Distribution and Frequency of Record Values. J. Roy. Statist. Soc., B, 14, 220-228. 15. Cigizoglu, H.K. and Bayazit, M. (2000). A generalized seasonal model for flow duration curve. Hydrological Processes, 14, 1053-1067. 16. Foster, F.G. and Stuart, A. (1954). Distribution Free Tests in Time Series Based on the Breaking of Records. J. Roy. Statist. Soc., B, 16, 1-22. 17. Galambos, J. and Simonelli, I. (2005). Products of Random Variables - Applications to Problems of Physics and to Arithmetical Functions. CRC Press. Boca Raton / Atlanta. 18. Glick, N. (1978). Breaking Records and Breaking Boards. Amer. Math. Monthly, 85(1), 2-26. 19. Gradshteyn, I. and Ryzhik, I. (1980). Tables of Integrals, Series, and Products. New York: Academic Press. 20. Grubel, H.G. (1968). Internationally diversified portfolios: welfare gains capital flows. American Economic Review, 58, 1299-1314. 21. Gulati, S. and Padgett, W.J. (2003). Parametric and Nonparametric Inference from Record-Breaking Data. New York: Springer-Verlag. 22. Houchens, R.L. (1984). Record Value Theory and Inference. Ph.D. Dissertation, University of California, Riverside, California. 23. Johnson, N.L., Kotz, S. and Balakrishnan, N. (1994). Continuous Univariate Distributions, Volume 1 (6th edition). John Wiley & Sons, New York. 24. Kamps, U. (1995). A Concept of Generalized Order Statistics. Teubner Stuttgart. 25. Klimczak, M., and Rychlik, T. (2005). Reconstruction of previous failure times and records. Metrika, 61, 277-290. 26. Khoolenjani, N.B. and Khorshidian, K. (2009). On the Ratio of Rice Random Variables. JIRSS, 8(1-2), 61-71. 27. Ladekarl, M., Jensen, V. and Nielsen, B. (1997). Total number of cancer cell nuclei and mitoses in breast tumors estimated by the optical disector. Analytical and Quantitative Cytology and Histology, 19, 329-337. 28. Malik, H.J. and Trudel, R. (1986). Probability density function of the product and quotient of two correlated exponential random variables. Can. Math. Bull., 29, 413-418. 29. Nagaraja, H.N. (1988). Record Values and Related Statistics - a Review. Commun. Statist. Theory-Methods, 17, 2223-2238. 30. Nevzorov, V.B. (1988). Records. Theo. Prob. Appl., 32, 201-228.
Shakil and Ahsanullah
325
31. Pham-Gia, T. (2000). Distributions of the ratios of independent beta variables and applications. Commun. in Statist.-Theo. and Meth., 29, 2693-2715. 32. Press, S.J. (1969). The t ratio distribution. J. Amer. Statist. Assoc., 64, 242-252. 33. Rokeach, M. and Kliejunas, P. (1972). Behavior as a function of attitude-towardobject and attitude-toward-situation. Journal of Personality and Social Psychology, 22, 194-201. 34. Qasem, A.A. (1996). Estimation via record values. Journal of Information & Optimization Sciences, 17, 2, 541-548. 35. Rao, C.R. and Shanbhag, D.N. (1998). Recent Approaches for Characterizations Based on Order Statistics and Record Values. Handbook of Statistics, (N. Balakrishnan and C.R. Rao eds.), Vol. 10, 231-257. 36. Renyi, A. (1962). Theorie des Elements Saillants d'une Suit d'observations Collq. Combinatorial Meth. Prob. Theory, Aarhus University, 104-115. 37. Resnick, S.I. (1973). Record Values and Maxima. Ann. Probab., 1, 650-662. 38. Samaniego, F.J. and Whitaker, L.D. (1986). On Estimating Population Characteristics from Record Breaking Observations. I. Parametric Results. Naval Res. Log. Quart., 25, 531-543. 39. Shakil, M, Kibria, B.M.G. and Singh, J.N. (2006). Distribution of the ratio of Maxwell and Rice random variables. International Journal of Contemporary Mathematical Sciences, 1 (13), 623-637. 40. Shakil, M., Kibria, B.M.G. and Chang, K-C (2008). Distributions of the product and ratio of Maxwell and Rayleigh random variables. Statistical Papers, 49, 729-747. 41. Shannon, C.E. (1948). A mathematical theory of communication. Bell System Tech. J., 27, 379-423; 623-656. 42. Shorrock, S. (1973). Record Values and Inter-Record Times. J. Appl. Prob., 10, 543-555. 43. Sornette, D. (1998). Multiplicative processes and power laws. Physical Review E, 57, 4811-4813.