Food Bioprocess Technol DOI 10.1007/s11947-014-1403-x
ORIGINAL PAPER
Recovery of Astaxanthin from Shrimp Cooking Wastewater: Optimization of Astaxanthin Extraction by Response Surface Methodology and Kinetic Studies Isabel Rodríguez Amado & José Antonio Vázquez & Miguel Anxo Murado & M. Pilar González
Received: 4 June 2014 / Accepted: 3 September 2014 # Springer Science+Business Media New York 2014
Abstract A protein and astaxanthin-concentrated fraction (Rf) can be recovered from shrimp cooking wastewater by ultrafiltration at 300 kDa, indicating that astaxanthin is somehow associated to membrane-retained proteins. Response surface analysis showed that astaxanthin can be extracted from Rf using sunflower oil (3:1 v/v) under milder conditions (T< 40 °C) than directly from shrimp exoskeleton. Modeling astaxanthin extraction kinetics at 30 °C revealed that the process is a consequence of both mass transfer and hydrogen bonding between astaxanthin and oil. The freeze-dried concentrate (FRf) showed two-phase extraction profiles with a much faster pigment recovery observed at 30 °C compared to the liquid form (Rf). The best yields of astaxanthin extraction were not further improved after hydrolysis with alcalase at 45 °C for 30 min (HRf), although higher yields were obtained when both Rf and LRf were extracted in the presence of 200 mg/L butylated hydroxyanisole or ethoxyquin. Astaxanthin from this shrimp by-product has low thermal stability in oil at high temperatures (60 and 70 °C), suggesting the carotenoid is mainly free as a result of the cooking process and not bounded to proteins or lipids as it occurs in its natural form. Keywords Astaxanthin . Sunflower oil . Shrimp by-products . Extraction kinetics . Mathematical modeling . Surface response methodology I. R. Amado : J. A. Vázquez : M. A. Murado : M. P. González Grupo de Reciclado y Valorización de Residuos (REVAL), Instituto de Investigacións Mariñas (IIM-CSIC), R/ Eduardo Cabello 6, CP36208 Vigo, Spain Present Address: I. R. Amado (*) School of Pharmacy, University of Reading, PO Box 224, Whiteknights, Reading, Berkshire RG6 6AD, UK e-mail:
[email protected]
Introduction The fish processing industry generates several wastewater effluents (washing, thawing, rinsing, and cooking), which involve serious problems of pollution and environmental health. Among these effluents, cooking juice (more than 40 % of the total) contains a high saline content and organic load (Cros et al. 2006). To reduce their pollutant content, cooking wastewaters need to be treated, increasing the cost of the manufacturing process. So, an alternative to reduce wastewater processing costs would be the recovery of products with high added value such as proteins, aromas, and flavors (Vandajon et al. 2002). During the last years, the application of membrane technology as the main method of separation, concentration, and purification of these valuable compounds from fish processing residual materials has been highly developed (Afonso et al. 2004; Murado et al. 2009, 2010). But also, given the carotenoprotein character of the pigmented by-product from crustacean process wastewaters (Cano-López et al. 1987; Simpson and Haard 1985), these effluents can be a possible source of carotenoids. Astaxanthin (3,3-dihydroxy-β,β-carotene-4,4 dione) is a ketocarotene widely used in aquaculture as feed additive for the pigmentation of salmonid meat and shrimp and lobster shells. The majority of commercial astaxanthin for aquaculture is industrially produced by chemical synthesis (Rodríguez-Sáiz et al. 2010), although its increasing interest, due to novel applications as nutraceutical in the food, pharmaceutical, and cosmetic industries (Del Campo et al. 2007), has led to the search for new natural sources of astaxanthin. In this way, many studies describe the recovery of astaxanthin from shrimp by-products such as head and body skeleton (Armenta-López et al. 2002; Bi et al. 2010; Sachindra and Mahendrakar 2005). De Holanda and Netto (2006) also reported obtaining astaxanthin as a valuable subproduct of the
Food Bioprocess Technol
chitin production from shrimp processing waste. Different extraction methods are applied for the recovery of astaxanthin from shrimp solid by-products such as enzymatic hydrolysis (De Holanda and Netto 2006), fermentative process (Sachindra and Bhaskar 2008), organic solvents (Sachindra et al. 2006), and vegetable oils (Chen and Meyers 1982; Handayani et al. 2008; Sachindra and Mahendrakar 2005). The optimization of these extraction processes is usually conducted using one-factor-at-a-time approach; however, the use of response surface methodology (RSM) allows predicting optimal extraction conditions and interactions between variables. In fact, using this methodology to optimize alkali (Liu et al. 2012), solid-phase (Zhu and Row 2013), and supercritical CO2 (Yang et al. 2013), astaxanthin extraction from shrimp by-products has been recently reported. Also, factorial design methodologies have been successfully applied to the optimization of astaxanthin extraction using vegetable oils (Sachindra and Mahendrakar 2005) and organic solvents (Sachindra et al. 2006). Astaxanthin in crustacean shells is mainly esterified or complexed with proteins (Matsuno 2001), increasing pigment stability. However, when extracted from natural sources, astaxanthin is unstable due to its sensitivity to various environmental factors such as light, oxygen, acidity, and heat (Mezzomo et al. 2011), causing the loss of its bioactivity. Lactic acid fermentation (ArmentaLópez et al. 2002) and the addition of antioxidants (Armenta-López et al. 2002; Chen and Meyers 1982) have improved the stability of astaxanthin, thereby leading to increase astaxanthin yield after extraction with different solvents. In the present study, we describe a feasible process using membrane technology for the recovery of astaxanthin from shrimp cooking wastewater. This methodology allows obtaining a protein and astaxanthinconcentrated fraction that can be used as additive in the animal feed industry, while reducing the costs of wastewater treatment. This study also reports the optimized conditions (temperature, time, oil/waste ratio, and use of antioxidants) for carotenoid extraction using sunflower oil and proposes kinetic models that would be helpful for the further scale-up of the process.
Materials and Methods Materials The company Bajamar Séptima, Pescanova Group (A Coruña, Galicia, Spain) kindly provided the cooking wastewater from the industrial manufacturing of shrimp
(Penaeus vannamei). Shrimp cooking juice was sampled and immediately stored at −18 °C until further use. Analytical Determinations Protein, total nitrogen, total sugar, and reducing sugar contents were determined from the samples taken before storage. Total nitrogen was determined by the method of Havilah et al. (1977). Soluble proteins were determined using the method of Lowry et al. (1951); total sugar content by the phenolsulfuric acid method (Dubois et al. 1956), according to Strickland and Parsons (1968); and reducing sugars were quantified by means of a 3,5-dinitrosalicylic reaction (Bernfeld 1951). Recovery of Astaxanthin by Ultrafiltration of Shrimp Wastewater The concentration of astaxanthin from shrimp cooking juice consisted of ultrafiltration-diafiltration using a spiral polyethersulfone membrane (Millipore Prepscale) of 0.56 m2 with molecular weight cut-off (MWCO) of 300 kDa. The operation mode was as follows: an initial phase of ultrafiltration (UF) with total recycling of retentate, immediately followed by diafiltration (DF). During UF, the inlet pressure remained constant to determine the drops of flow rate due to the increased concentration of the retentate and to possible membrane adhesions. The final retentate (after DF) was divided into two batches: one was directly stored at −18 °C (R f ) and the other freeze-dried (FR f ) and stored at 4 °C for further analysis. Both permeates in the UF and DF phase were discarded after analysis. The kinetics of UF and DF of the effluent were defined by the protein levels as determined by two procedures: the method of Lowry and total nitrogen multiplied by 6.25. Enzymatic Hydrolysis Process The enzymatic hydrolysis of the concentrated fraction was performed using a commercial protease, alcalase 2.4 L from Novo Co. (Novozyme Nordisk, Bagsvaerd, Denmark) at a ratio of 0.01:1 (Anson units per milliliter, AU/mL) enzyme/ substrate. One AU is the amount of enzyme that, under standard conditions, digests hemoglobin at an initial rate that produces an amount of trichloroacetic acid-soluble product that gives the same color with the Folin reagent as one milliequivalent of tyrosine released per minute. The pH of the retentate was adjusted to pH 9.0 using 5 mM BrittonRobinson buffer, and proteolysis was carried out in a water bath with soft agitation at 45 °C for 30 min. The hydrolysate (HRf) was stored at −18 °C until further use.
Food Bioprocess Technol
Combined Effect of Temperature, Heating Time, and Oil/Waste Ratio on Astaxanthin Extraction
parameters and model were performed with the Microsoft Excel spreadsheet.
A second-order rotatable design, based on three variables at five levels (Akhnazarova and Kafarov 1982; Box et al. 2005), was used to study the combined effect of temperature (T), time (t), and oil/waste ratio (R) on the yield of recovered astaxanthin from shrimp process wastewater. The joint effect of the three variables was studied in the Rf fraction. The experimental domains of each variable were 40– 100 °C for T, 30–300 min for t, and 1.0–3.0 (v/v) for R. The design consisted of 20 experiments with four (22) factorial points, four axial points to form a central composite design with α=1.682, and six center points for replication. The experimental domain and codification of the variables are shown in Table 1. Experimental data were fitted to the following empirical model with the yield of astaxanthin as dependent variable: Ae ¼ b0 þ
3 X i¼1
bi x i þ
3 X i¼1
bii x2i þ
2 X 3 X
bij xi x j
i¼1 j¼iþ1
ð1Þ
Statistical significance of the coefficients was evaluated by Student’s t test (α=0.05). Consistency of the model was tested by Fisher’s F test (α=0.05), using the following mean squares ratios: The model is acceptable if F1 ≥Fnum den F2 ≤Fnum den F3 ≤Fnum den F4 ≤Fnum den
F1 =Model/Total error F2 =(Model+Lack of fitting)/Model F3 =Total error/Experimental error F4 =Lack of fitting/Experimental error
Data fitting, parametric estimation performed by minimization of the sum of quadratic differences between experimental and model-predicted values, and significance tests both for Table 1 Experimental domain and codification of independent variables in the factorial design Coded values
−1.68 (−α) −1 0 +1 +1.68 (+α)
Natural values T (°C)
t (min)
R (L:L or L:S)
40.0 52.2 70.0 87.8 100.0
30 85 165 245 300
1.0 1.4 2.0 2.6 3.0
Codification: Vc =(Vn −V0)/ΔVn Decodification: Vn =V0 +(ΔVn ×Vc) Vn =natural value in the center of the domain, ΔVn =increment of Vn for unit of Vc
Extraction of Astaxanthin Using Sunflower Oil The extraction of astaxanthin in sunflower oil was carried out from the final retentate (Rf), but also two other pretreated samples were studied as astaxanthin sources. For this purpose, Rf was hydrolyzed using alcalase (HRf) or freeze-dried (FRf) in order to test if the carotenoid was more available to sunflower oil in any of these forms. Extraction from both Rf and HRf was performed using the optimized conditions defined by a second-order rotatable design, as previously described. In case of FRf, the oil/waste ratio was increased to 100:1, an adequate relation due to the increased concentration of the carotenoid as a consequence of the freeze-drying process. In the latter fraction, the extraction was studied at different temperatures: 30, 40, 50, and 60 °C. Extractions were carried out in stirred 250 mL flasks and appropriate Rf or HRf volumes or FRf masses were added to sunflower oil preheated at the appropriate temperature. Duplicate samples were removed after different incubation times. Then samples were filtered through washed glass wool and centrifuged at 5,000g for 15 min, and the pigmented oil layer from the supernatant was recovered. The astaxanthin concentration was measured spectrophotometrically at λmax (487 nm: A487), and the carotenoid yield as astaxanthin, for liquid (μg/mL) or solid (μg/g) samples, was determined using the following equation (Sachindra and Mahendrakar 2005): Y ¼
A487 % V oil % 106 100 % V w % E
ð2Þ
where Y is the astaxanthin yield per volume of bulk liquid (μg/mL) or per shrimp waste mass (μg/g), Voil is the volume of recovered pigmented oil, Vw is the volume of waste (for Rf and HRf samples) or the weight of freeze-dried powder (for FRf samples), and E is the specific extinction coefficient. Finally, the effect of the addition of butylated hydroxyanisole (BHA) or ethoxyquin (ETQ) at 200 mg/L on the astaxanthin extraction was also studied in both Rf and FRf. Mathematical Modeling of Extraction Kinetics The dynamics of astaxanthin extraction were modeled using a mass transfer kinetic model (Handayani et al. 2008): Y ¼ Y e ½1−expð−k L atÞ'
ð3Þ
where Y and Ye are the astaxanthin yield in bulk liquid and at equilibrium per volume (μg/mL) or per mass of shrimp waste (μg/g), respectively; t is the time of the extraction
Food Bioprocess Technol
process (min); and kLa is a volumetric mass transfer coefficient (min−1). We also used a pseudo-second-order model that accounts for the esterification between hydroxyl groups in free astaxanthin and fatty acids in sunflower oil (Handayani et al. 2008). Considering that the concentration of astaxanthin at the beginning of the extraction process is zero and rewriting the equation in terms of yield: Y
Y 2e k A t ð1 þ Y e k A t Þ
ð4Þ
where Y and Ye are the astaxanthin yield in bulk liquid and at equilibrium per volume (μg/mL) or per mass of shrimp waste (μg/g), respectively; t is the time of the extraction process (min); and kA is a reaction constant (min−1). Finally, when a two-phase extraction profile was observed, data were modeled using the sum of two mass transfer kinetic models (biphasic model) with different volumetric mass transfer coefficients and yields at equilibrium (Ye1 and Ye2): Y ¼ Y e1 ½1−expð−k L1 at Þ' þ Y e2 ½1−expð−k L2 at Þ'
ð5Þ
where Ye1 and Ye2 are the astaxanthin yields per mass of shrimp waste (μg/g) of the first and second phase, respectively; t is the time of the extraction process (min); kL1a and kL2a are the volumetric mass transfer coefficients of the first and second phase, respectively (min−1). Considering that the sum of both Ye1 and Ye2 is the maximum yield of extraction achieved (Ym), and rewriting Eq. 5 in terms of a global process with a single yield at equilibrium (Ye), we have: Y ¼ Y e ½1−expð−k L1 atÞ' þ ðY m −Y e Þ½ð1−expð−k L2 atÞÞ' ð6Þ For comparative purposes, data were normalized by dividing astaxanthin yields (μg/mL or μg/g) by the highest yield (μg/mL or μg/g) of astaxanthin extracted from each fraction (Rf, HRf, or FRf) regardless of the experimental conditions assayed in each case. Numerical and Statistical Methods Fitting procedures and parametric estimates from the experimental results were performed by minimization of the sum of quadratic differences between observed and model-predicted values, using the nonlinear leastsquares (quasi-Newton) method provided by the macro Solver of Microsoft Excel XP spreadsheet. Then, confidence intervals from the parametric estimates (Student’s t test) and consistence of mathematical models (Fisher’s F test), both with α = 0.05, were determined using SolverAid macro, which is freely available from de
Levie’s Excellaneous website: http://www.bowdoin.edu/ ~rdelevie/excellaneous/.
Results and Discussion Ultrafiltration of Shrimp Wastewater The shrimp cooking wastewater utilized in this work had a pH of 6.07±0.04, a protein content of 1.92±0.08 g/L, and a total soluble sugar concentration of 0.21 ± 0.02 g/L. In the diafiltration with constant volume (filtration flow=water intake flow), the concentration (or the total amount) of a permeable solute in the retentate follows a first-order kinetics (Amado et al. 2013; Murado et al. 2010): C ¼ C f þ C 0 exp½−ð1−sÞDr '
ð7Þ
where C is the concentration of the permeable solute in the retentate, with C0 as the initial value. Cf is the final asymptotic value if only a part of a polydisperse solute is permeable. When using normalized values (%): C0 +Cf =100, with Cf =0 when the solute is completely permeable. The parameter s is the solute-specific retention, which varies between 0 (the solute is filtered as the solvent) and 1 (the solute is totally retained). Dr is the relative diavolume or the ratio volume of added water/constant retentate volume. This equation satisfactorily described the kinetics of protein diafiltration process with a molecular cut-off at 300 kDa (Fig. 1). The values of the coefficients were Cf =75.9 % and s=0.381, which means a rather high retention of the protein and also a specific retention that would demand a relative diavolume of 5.7 to eliminate 99 % of permeable protein. In a common diafiltration, with an initial volume of 2 L of concentrated shrimp wastewater and working with a relative diavolume of 5, at 50–55 °C and 2 atm (~30 psi), the protein concentration in the retentate can be maintained around 15– 20 g/L, with a filtrate flow that decays 40–45 % during the process and maintains an average value of 325 mL min−1 m−2 (data not shown). Under these experimental conditions, the values of protein calculated by the Lowry method or total nitrogen×6.25 were almost indistinguishable (Fig. 1). These results indicate a high retention of peptidic material after ultrafiltration of shrimp cooking wastewater despite the heat treatment during shrimp processing. The ultrafiltration-diafiltration process with a molecular cut-off at 300 kDa showed a high retention of astaxanthin despite the low molecular weight (597 Da) of this pigment. During the ultrafiltration phase, the initial permeates showed slight yellowish coloration, completely disappearing after diafiltration and leading to an intense colored retentate. In fact, a concentration factor of 13 is achieved after 300 kDa
100
100
80
80
60
60
R (%)
R (g/L)
Food Bioprocess Technol
40
40
20
20
0
0 1
6
11 16 21 Concentration factor (fc)
26
0
3
6 9 Diavolume (D)
12
Fig. 1 Ultrafiltration-diafiltration kinetics of shrimp (Penaeus vannamei) cooking wastewater using a polyethersulfone membrane with MWCO at 300 kDa. Left: concentration of retained protein in linear relation with the factor of volumetric concentration (fc) showing experimental data (points) and theoretical profiles (discontinuous line). Right: progress of
protein (empty circle) and nitrogen (filled circle) retention with the increase of diavolume from DF process (D). For clarity, confidence intervals (in all cases, less than 5 % of the experimental mean value; α=0.05; n=2) were omitted
UF-DF of shrimp cooking wastewater, reaching average astaxanthin concentrations between 10 and 13 μg mL−1 in the retentate extracted with sunflower oil. These results suggest that aggregation phenomena are occurring due to the hydrophobic properties of astaxanthin. It is known that astaxanthin from the shell matrix of crustaceans is mainly found esterified or complexed with proteins (Matsuno 2001). Therefore, astaxanthin in the retentate must be forming polymeric aggregates (Velu et al. 2003) and/or bound to macromolecules, mainly proteins, that are retained during ultrafiltration using the reported cut-off membrane. Accordingly, the 300 kDa concentrated fraction could be used as a supplement for animal diets due to its high astaxanthin and protein content. In the same way, PérezSantín et al. (2013) obtained a concentrate rich in lipids and proteins with crustacean aroma, attractive orange coloring, and antioxidant and ACE-inhibitory capacities making it attractive for the formulation of feeds or functional foods.
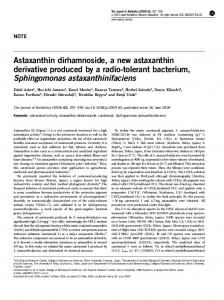
literature for the extraction of carotenoids from shrimp waste using vegetable oils (Sachindra and Mahendrakar 2005), for 30 min. Results are shown in Fig. 2 where the yields of astaxanthin recovery were calculated according to Eq. (2). The highest recovery of astaxanthin under these conditions (70 °C, 30 min) is obtained at 45 °C, falling a 70 % on average when the temperature of hydrolysis is 35 or 55 °C. Moreover, astaxanthin yields decreased correlatively with the incubation time at all temperatures tested. At the optimum temperature, the recovery of astaxanthin decreased about 36 % when the reaction time increased from 30 to 120 min. Taking into account these results, the hydrolysis conditions selected were as follows: 30 min at 45 °C using a ratio of 0.01:1 (AU/mL) alcalase/substrate.
Enzymatic Hydrolysis The use of proteolytic enzymes has been widely reported to disrupt the protein-carotenoid complex and increase astaxanthin extraction from solid shrimp by-products (De Holanda and Netto 2006; Sowmya et al. 2011). With this purpose, in a preliminary experiment, the hydrolysis conditions using alcalase were optimized to maximize the astaxanthin recovery without compromising its stability. Different temperatures (35, 45, and 55 °C) and times (30, 60, 90, and 120 min) of hydrolysis were assayed, maintaining a constant ratio of 0.01:1 (AU/mL) enzyme/substrate. After each incubation time, samples were withdrawn and quickly cooled down in an ice-water bath for 5 min to inactivate the protease. Then astaxanthin was extracted in sunflower oil at 70 °C, according to the optimal conditions reported in the
Fig. 2 Recovery of astaxanthin in sunflower oil from hydrolysates of the 300 kDa concentrated fraction (Rf). Hydrolysis was performed at different temperatures: 35 (empty triangle), 45 (empty circle), and 55 °C (filled circle)
Food Bioprocess Technol
Combined Effect of Temperature, Heating Time, and Oil/Waste Ratio on the Extraction of Astaxanthin The effects of temperature, heating time, and oil/waste ratio on the yield of astaxanthin recovery are important factors that must be considered for a further scale-up of the process. Although the combined effect of these variables can be studied using a one-factor-at-a-time approach, this methodology cannot predict the optimal reaction conditions, ignores interactions, and may lead to misleading conclusions. In this regard, experimental design methodologies (Box et al. 2005) are more efficient than the one-factor-at-a-time approach. Response surface methodology uses statistical and mathematical techniques to evaluate the combined effect of factors instead of single factors at different times. In this work, a second-order rotatable design, based on three variables at five levels (Akhnazarova and Kafarov 1982; Box et al. 2005), was used to study the combined effect of temperature (T), time (t), and ratio oil/waste ration (R) on the yield of astaxanthin recovery. The experimental domain is shown in Table 1, with temperatures and oil/waste ratios selected according to previous reported conditions for the extraction of astaxanthin using vegetable oils (Sachindra and Mahendrakar 2005). Applying the significance criteria specified in the “Materials and Methods” section, the empirical model obtained for the theoretical yield of extracted astaxanthin (Ae) as a function of the three processing variables was: Ae ¼ 8:23−1:53T þ 0:69R−1:15tT þ 1:11tR þ 0:53tTR−0:43T 2
ð8Þ
The response surfaces obtained varying two independent variables, when the third variable is kept at a constant value, are depicted in Fig. 3, and the complete statistical analysis is shown in Table 2. The analysis of variance indicates that the model is significant (α=0.05) and the adjusted R2 value shows Fig. 3 Response surfaces of the combined effect of temperature (T) and ratio oil/waste (R) (left) and temperature (T) and time of extraction (t) (right) on the predicted yield of extracted astaxanthin (Y) according to Eq. (8)
a good correlation with the experimental data. Besides, according to the statistical analysis, all the parameters in Eq. (8) were significant. The response surface for astaxanthin yield as a function of temperature and oil/waste ratio (Fig. 3, left) indicates that the extraction yield increases linearly with the oil/waste ratio. At high temperatures, the response increases notably (96 % within the experimental domain) with the proportion of extracting agent. By contrast, at low extraction temperatures, the differences on the astaxanthin yield by varying the phase relationship are much lower (20 %). It should also be noted that at high temperatures and low phase relationships, a degradation of the pigment is observed resulting in practically null values of recovered astaxanthin. Figure 3 (right) further confirms these results since it shows that the increase in the extraction time has an effect on astaxanthin recovery only at low temperatures. This result also agrees with that reported by Pu et al. (2010), who found that shrimp astaxanthin degradation in flaxseed oil was significantly influenced by temperature, with increased degradation rates at 50 and 60 °C compared to 30 and 40 °C using a 1:1 (w/v) phase relationship. Although an absolute maximum response was not achieved within the experimental domain, maximal yields can be obtained at low temperature (4 h). Our results also suggest that the extraction could be performed at lower temperatures (25–30 °C) without appreciable loss in astaxanthin yield and even improving pigment recovery. Interestingly, our results reveal that astaxanthin can be recovered from shrimp cooking wastewaters using milder conditions than the usual high temperatures (Sachindra and Mahendrakar 2005) and organic solvents (Sachindra et al. 2006) utilized for the extraction of astaxanthin from crustacean shells. The fact that astaxanthin is more easily extracted from the liquid effluent than from solid by-products is likely to be due to the cooking process. In fact, several authors suggest that cooking can break the carotenoid-protein complex, releasing the carotenoid compounds and facilitating its
Food Bioprocess Technol Table 2 Results of the factorial design of the combined effect of temperature (T), time (t), and oil/waste ratio (R) on the yield of recovered astaxanthin from shrimp process wastewater with sunflower oil according to Eq. (1) and analysis of significance of the proposed model T
t
R
A
Ae
Coefficients
Student’s t
Model
−1 1 −1 1
−1 −1 1 1
−1 −1 −1 −1
8.16 6.96 9.61 1.69
8.09 8.38 9.22 2.79
8.23 −1.53 0.06 0.69
35.92 10.08 0.41 4.53
8.23 −1.53T t (NS) 0.69R
−1 1 −1 1 −1.682 1.682 0 0 0 0 0 0 0 0 0 0
−1 −1 1 1 0 0 −1.682 1.682 0 0 0 0 0 0 0 0
1 1 1 1 0 0 0 0 −1.682 1.682 0 0 0 0 0 0
7.81 5.97 11.61 7.26 8.95 5.59 8.41 8.17 7.07 8.90 7.22 8.08 8.31 8.79 8.22 8.69
8.28 6.48 11.77 7.45 9.61 4.45 8.23 8.23 7.07 9.39 8.23 8.23 8.23 8.23 8.23 8.23
−1.15 0.37 1.11 0.53 −0.43 −0.07 −0.19
5.81 1.84 5.61 2.64 2.88 0.44 1.26
−1.15Tt TR (NS) 1.11tR 0.53TtR −0.43T2 t2 (NS) R2 (NS)
Average value Expected average value Var (Ee) t (α