Author Version Accepted by Chaos: An Interdisciplinary Journal of Nonlinear Science, on Jan. 22, 2016
Coarse-graining time series data: recurrence plot of recurrence plots and its application for music Miwa Fukino,1,a) Yoshito Hirata,2 and Kazuyuki Aihara2 1
Department of Mathematical Informatics, Graduate School of Information Science and Technology, The University of Tokyo, 7-3-1 Hongo, Bunkyo-ku, Tokyo 113-8656, Japan
2
Institute of Industrial Science, The University of Tokyo, 4-6-1 Komaba, Meguro-ku, Tokyo 153-8505, Japan
Abstract: We propose a nonlinear time series method for characterizing two layers of regularity simultaneously. The key of the method is using the recurrence plots hierarchically, which allows us to preserve the underlying regularities behind the original time series. We demonstrate the proposed method with musical data. The proposed method enables us to visualize both the local and the global musical regularities, or two different features at the same time. Furthermore, the determinism scores imply that the proposed method may be useful for analyzing emotional response to the music. Leading Paragraph: Grasping both macroscopic and microscopic information is very useful, when we aim to understand the underlying dynamics generating a long time series. However, there are few methods of nonlinear time series analysis which can treat these two pieces of information simultaneously. Here, we propose a novel method called “recurrence plot of recurrence plots (RPofRPs)” with which recurrence plots1,2,3 are used hierarchically to represent local and global regularities. At the lower layer, we separate a long time series into many segments of short-term time series, and simply obtain many short-term (unthresholded) recurrence plots. At the higher layer, on the other hand, we calculate distances between every pair of the short-term RPs and obtain a recurrence plot, which is the RPofRPs. We apply this method to music pieces of 44.1kHz 16bit monaural linear PCM. Our results show a continuous periodic regularity, rhythmic pattern change, gradual tempo transition, and phrase similarity between phrases played even in different key scales. Furthermore, we calculated transitions of determinism (DET) scores for both conventional recurrence plots and RPofRPs. We found that DET scores of RPofRPs for Mozart and Beethoven pieces tend to show high scores at the first chorus, then vary largely at the middle, and gradually increase towards the end. Thus, PRofPRs can comprehensively represent both macroscopic and microscopic characteristics of the underlying dynamics behind the data, by only using simple calculations. Therefore, it possibly provides another viewpoint of music based on nonlinear dynamics. _____________________________ 1. Electronic mail:
[email protected]
I. INTRODUCTION A recurrence plot is an important analysis tool for nonlinear time series data1,2,3. It is a twodimensional plot that visualizes recurrences of the data. Both horizontal and vertical axes represent the same time axis, preserving the information for the underlying dynamics completely. If a distance between states for two times are close, a dot is plotted at the corresponding place, and if not, a dot is not plotted there.
Let M be a metric space, and d, a distance defined on M. In addition, denote, by 𝑠 𝑖 ∈ 𝑀, the ith point of a time series s . Then, a recurrence plot is defined as
𝑅 𝑖, 𝑗 =
1, 𝑑 𝑠 𝑖 , 𝑠 𝑗 < 𝜀, (1) 0, 𝑜𝑡ℎ𝑒𝑟𝑤𝑖𝑠𝑒.
When 𝑅 𝑖, 𝑗 = 1, we plot a dot at 𝑖, 𝑗 , and when 𝑅 𝑖, 𝑗 = 0, we do not plot a dot on 𝑖, 𝑗 . Here ε is called the threshold. We may use the Euclidean norm, the maximum norm, the minimum norm and others for the distance d.In an unthresholded recurrence plot, we do not use the threshold ε, and express distances as color4.Namely the definition for the unthresholded recurrence plot is as 𝑅’ 𝑖, 𝑗 = 𝑑 𝑠 𝑖 , 𝑠 𝑗 .
(2)
Due to the visibility of the plot, we normally apply a recurrence plot to a time series of length up to 10000. Based on this standard, it is impossible to apply a recurrence plot to music time series data directly because it is too huge: such a dataset is usually recorded at 44.1kHz with 16bit linear PCM and thus has 44100 time points per second, meaning that a 5 minutes monaural music piece contains 13,230,000 time points. If we simply subsample such musical data and try to draw its recurrence plots, we cannot grasp its macroscopic structure. The previous works5,6 analyzed the structural similarity between pieces by calculating tonality feature vectors and using the vectors as inputs for a recurrence plot. The feature vectors were calculated as a probability distribution of 12, 24 or 36 chromas, and tuned for analyzing which pitch or chord constructs the piece structure. The problem on such analysis is that the underlying rich information except for tonality is lost in such a recurrence plot. Therefore, we focus on describing both microscopic and macroscopic information of music pieces without losing essential information. To do that, we should avoid the linear
2
analysis method. For this sake, we found a hint in our previous work7, where we divided a long time series, e.g. foreign exchange market data or brain data, into several short-term segments, calculated a recurrence plot for each observable for each segment, represented relations among the observables as a graph structure, and characterized the macroscopic change using the series of graphs. However, we cannot apply this method directly to music pieces because it assumes that several observables are measured simultaneously, while we here assume that a music piece is given as a scalar time series. Thus, we propose a novel method which represents a macroscopic regularity, by means of using recurrence plots hierarchically. In this method, first, we divide a long time series into short-term segments, and calculate a short-term recurrence plot for each segment to represent a microscopic regularity. Second, we calculate another recurrence plot using short-term recurrence plots. As a result, we can observe macroscopic properties without losing a microscopic regularity much.
II. METHODS In this section, first, we describe our basic method and mathematical definitions. Second, we explain input data and parameter values. Finally, we introduce the definition of determinism (DET).
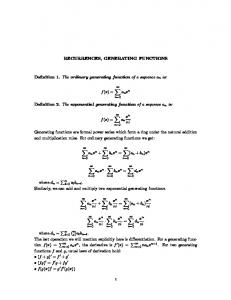
A. Basic Method We analyze a time series using RP hierarchically. As shown in Fig.1, we divide a long time series into shortterm segments at a constant interval, and calculate a recurrence plot for each segment. We call this a “shortterm recurrence plot (short-term RP)”. The window size and overlap with the next window are set arbitrarily according to data. Then we calculate another RP using short-term RPs. We call this as a “recurrence plot of recurrence plots (RPofRPs)”. While the short-term RPs represent a regularity of neighbors inside the segment, the RPofRPs represents a regularity among “short-term RPs’ regularities”. FIG.1. Recurrence plot of recurrence plots: we divide a long time series into short-term segments at a constant interval, and calculate multiple short-term RPs. Then using short term RPs, we calculate a RPofRPs.
3
B. Definition of Short-term Recurrence Plot (short-term RP) We here use delay coordinates for reconstructing states for the underlying dynamics. Thus the delay time and the dimension should be considered to calculate short-term RPs. Let {s(t)∈ R|t=1,2,3….,T} be a time series of length T. When we denote time, delay time, and dimension by t, 𝜏, and D, respectively, delay coordinates S(t) can be written as 𝑆(𝑡) = [ 𝑠(𝑡), 𝑠 𝑡 + 𝜏 , 𝑠 𝑡 + 2𝜏 , ⋯ , 𝑠 𝑡 + 𝐷 − 1 𝜏 ] , (3) where t moves 1 to 𝑇 − (𝐷 − 1)𝜏. We use the Euclidean distance between S(t1) and S(t2) as follows: 𝑑C 𝑆 𝑡D , 𝑆 𝑡E
=
GHD IJK
𝑠 𝑡D + 𝑘𝜏 − 𝑠 𝑡E + 𝑘𝜏
E
. (4)
Using 𝑑C , we define the nth unthresholded short-term RP X'n as 𝑋MN (𝑖, 𝑗) = 𝑑C (𝑆(𝑛ℎ + 𝑖𝜏 + 1), 𝑆(𝑛ℎ + 𝑗𝜏 + 1)), (5) P
where h is the shift width. When we let W be a window size, i and j move from 0 to
Q
− 1 , while n moves
from 0 to (𝑇 − (𝐷 − 2)𝜏 − 𝑊 − 1)/ℎ . We use the unthresholded short-term RPs Xn’ to define a RPofRPs. Now, we define a thresholded version of short-term RP Xn using X'n. For each column of the Xn, we plot a dot at the row the distance to which is within top 100 ×𝜀C % from the closest of the same column of X'n. Then, we symmetrize the recurrence plot by plotting a dot at (j,i) if a dot is plotted at (i,j) in the original recurrence plot.
C. Definition of Recurrence Plot of Recurrence Plots (RPofRPs) ′ is defined as A distance between the nth and mth unthresholded RPs 𝑋M′ 𝑎𝑛𝑑 𝑋V ′ 𝑑W (𝑋M′ , 𝑋V )=
XY ′ Z,[JD(𝑋M (𝑖, 𝑗)
′ − 𝑋V (𝑖, 𝑗))E ,
(6)
where 𝑁] is the largest index for short-term RPs, and is equivalent to the width of RPofRPs. Using 𝑑W , we define an unthresholded RPofRPs as 𝑍’ 𝑛, 𝑚 = 𝑑𝑟 𝑋’𝑛 , 𝑋’𝑚 .
4
(7)
In addition, we define a thresholded version of RPofRPs Z using Z'. For each column of the Z, we plot a dot at the row the distance to which is within top 100×𝜀𝑟 % from the closest of the same column of Z'. Then, we symmetrize the RPofRPs by plotting a point on (m,n) if a point is plotted at (n,m) in the original RPofRPs. We first use the unthresholded RPofRPs Z' to grasp a big picture, and then use the thresholded RPofRPs to analyze the details.
D. Input Data 1. Toy Model Data First, we tested the performance of our proposed method using toy model data. We used a dataset generated by the following Lorenz model: `a `b `f `b `h `b
= −𝜎 𝑥 − 𝑦 ,
(8)
= −𝑥𝑧 + 𝑟𝑥 − 𝑦,
(9)
= 𝑥𝑦 − 𝛽𝑧,
(10)
where t is time, x, y, z are variables, and σ, r, β are constants. We set 𝜎 = 5, 𝑟 = 40, and 𝛽 = 8/3, if not mentioned. The initial values were set to 𝑥, 𝑦, 𝑧 = 0.0,1.0,1.0 . We integrated the above equations from 𝑡 = 0 to 2000 at 0.01 intervals, and used generated x, y, and z vector data for the analysis. Figure 2 shows the attractor of generated data of first 8000 points. FIG. 2. Input data (toy model): Attractor of the Lorenz model (σ=5, r = 40, and 𝛽 = 8/3).
2. Musical Data We used classic piano music pieces shown in Table. 1. All pieces are audio recordings of piano only, played by expert pianists. We call these pieces by the piece numbers shown in the right column of Table 1. Figures 3, 4 and 5 show the starting part of the musical score and the whole waveform for each title. In Bach1, arpeggio phrases were constantly repeated through whole the piece, chords of arpeggio were gradually changing, and the amplitude was constant. In Mozart1, the theme melody known as "twinkle,
5
twinkle, little star..." was followed by its twelve variations. The variations are for chords, rhythm, tempo, meter, amplitude, or ornament of phrases and notes. The dynamic range of amplitude was wide. Beethoven1 took the Sonata form which consisted of sections: the Introduction, the Exposition, the Development, the Recapitulation, and the Coda. The dynamic range of amplitude was also wide. The musical data were taken from the RWC Music Database (piece number: RWC-MDB-C-2001 No.25 Tr.13; No.27; No.28)9. We imported the musical data to PC in the linear PCM 44.1kHz 16bit stereo format, and converted to monaural with audio editing software. Table 1. Musical data Composer Johann Sebastian Wolfgang Amadeus Mozart Ludwig van Beethoven
Title The Well-Tempered Clavier, Book 1,no.1 in C major BWV.846. Prelude Variations on ”Ah! Vous diraije maman” K.265 Piano Sonata no.23 in F minor, op.57 'Appasionata'. 1st mvmt.
Piece Number Bach1 Mozart1 Beethoven1
FIG. 3. Input data (Bach1): (a) Score of the first 2 bars of J. -S. Bach, "The Well-Tempered Clavier, Book 1, no.1 in C major BWV.846. Prelude". (b) Waveform of the whole tune. linear PCM, 44.1kHz 16bit mono. FIG. 4. Input data (Mozart1): (a) Score of the theme of W. A. Mozart, "Variations on ”Ah! Vous dirai-je maman” K.265". (b) Waveform of the whole tune. linear PCM, 44.1kHz 16bit mono. FIG. 5. Input data (Beethoven1): (a) Score of the starting bars of L. V. Beethoven, " Piano Sonata no.23 in F minor, op.57 'Appasionata'. 1st mvmt.". (b) Waveform of the whole tune. linear PCM, 44.1kHz 16bit mono.
E. Parameter Values We set the following parameter values to calculate short-term RPs using input data described above. For the toy model, the window size of short-term RP was set to 4000, and the shift width was 1000 (equivalent to 1/4 of the shift width), while the delay time was set to 1, and dimension was set to 3 (x, y and z). We set the window size of the musical data to 4 seconds (44.1kHz x 4 seconds = 176,400 samples) , and the shift width to 1 second (1/4 of the window size), while we set the delay time to 40, and the dimension to 5. We used mutual information to estimate the delay time, and false nearest neighbors to estimate the embedding dimension. The number of bins for calculating the mutual information was set to 32. We considered more
6
than a half of data points to calculate the false nearest neighbors. Since all of the musical data were on the same recording conditions, we used the resulting values of Beethoven1 as values for all the music pieces. We applied the MATLAB functions (ami( ) and false_neighbors_kd( )) which are open on the web by the author10. We set 𝜀𝑟 to 0.1 for the toy model, Mozart1 and Beethoven1, while we set 𝜀𝑟 to 0.3 for Bach1. That is because the distances were kept constantly close in Bach1 and there were many continious diagonal lines on the unthresholded RPofRPs of Bach1 (see Fig. 7 and the result section).
F. Determinism (DET) One of the important measures to quantify a recurrence plot is the determinism (DET)4. When we denote the length of diagonal lines on RP by 𝑙, and the width of RP by N, we can define the histogram for the diagonal lines as w Z,[JD(1
𝑃 𝜀, 𝑙 =
− 𝑅ZHD,[HD 𝜀 )(1 − 𝑅Zuv,[uv 𝜀 )
vHD IJK 𝑅ZuI,[uI
𝜀 , (11)
where 𝜀 is the threshold. Using this 𝑃, the determinism (DET) is defined as 𝐷𝐸𝑇 =
{ |}|~•€ vy(z,v) { |}• vy(z,v)
. (12)
DET ranges from 0 to 1. If the value of DET is larger, the determinism for the underlying dynamics tends to be stronger. Using DET, we quantified the short-term RPs and the RPofRPs. We set the plotting rate per column 𝜀C of short-term RPs Xn to 0.1, while the threshold 𝜀W of RPofRPs Z was set to the same value as the one described in the previous section.
III. RESULTS First, we show unthresholded RPofRPs and unthresholded short-term RPs, and describe the overview. Second, we show thresholded RPofRPs, and explain them in detail. Finally, we show transitions of DET for the musical data.
7
A. Unthresholded RPofRPs and Short-term RPs We show unthresholded RPofRPs and unthresholded short-term RPs for toy model data and musical data in Fig. 6, where (a), (c), (e) and (g) are unthresholded RPofRPs, and (b), (d), (f) and (h) are multiple short-term RPs. While (a) and (b) are for the toy model, (c) and (d) are for Bach1, (e) and (f) are for Mozart1, and (g) and (h) are for Beethoven1. For the musical data, the unit of the axes (time scale) for RPofRPs is in seconds, which is equivalent to the serial number of short-term RPs, where the unit of axes (time scale) for short-term RPs is in "×10Hƒ seconds", which is equivalent to "samples/𝜏". The color shows the relative distance: the dark blue means nearer; the red means farther. FIG. 6. Unthresholded RPofRPs and short-term RPs : (a) RPofRPs of the toy model (unthresholded) with enlarged view. (b) short-term RP of the toy model data. (c) RPofRP of Bach1. (d) short-term RP of Bach1 (left:No.60, right:No.80). (e) RPofRPs of Mozart1. (f) short-term RP of Mozart1 (No.30,275). (g) RPofRPs of Beethoven1. (h) short-term RP of Beethoven1 (No.30,350). We set window size = 4000, shift size = 1000, delay time=1, and dimension=3 in (b). In (d), (f), and (h) we set window size = 4 seconds (4410), shift size = 1 second (1100), delay time = 40, and dimension = 5.
Now we overview the feature of Fig. 6. The RPofRPs for the toy model (Fig. 6 (a)) contains many diagonal lines, whose colors are slightly changing, while in the short-term RP for the toy model shown in Fig. 6 (b), blue, yellow, and red colors show a clear checkerboard pattern. From this, we can grasp that, in the microscopic view, the distance becomes nearer and farther alternatively. If both time points are at the root of the wings of the Lorenz attractor, the distance is nearer. If two time points are at the tops of the wings, the distance is farther. In the macroscopic view, the shape of the attractor of each segment changes periodically. Whereas, the RPofRPs for Bach1 (Fig.6 (c)) represents that the distances are close in almost whole the piece except for the last part, while short-term RPs for Bach1 (Fig.6 (d)) represent that the distances become nearer and farther repeatedly. From this, we can understand that the data keep specific similar patterns continuously. RPofRPs for Mozart1 (Fig.6 (e)) and Beethoven (Fig.6 (g)) represent that there are many sections, for example, where similar patterns were repeated, but the shapes of patterns varied slightly.
B. Thresholded RPofRPs Next, we drew the thresholded RPofRPs.
1. Toy Model
8
Figure 7 shows the thresholded RPoRPs for the toy model. We can find many diagonal lines clearly. This finding means that the distances between the attractors of short-term segments have a nearly periodic property, as we mentioned above. FIG. 7. Thresholded RPofRPs (the toy model) with 𝜀W = 0.1
2. Bach1 Figure 8 (a) shows the thresholded RPofRPs for Bach1. We can find many diagonal lines on it. An enlarged view shown in Fig. 8 (b) represents that the width between the two diagonal lines is 3 seconds, that is almost similar to the time to play one bar of the musical score (see Fig. 8(c)); in detail, the time within which one bar is played fluctuated according to the performance speed at every bar. In one bar, arpeggio is repeated twice in the same harmony, and harmony change per every bar constantly continues towards the end of the piece. These repeated patterns correspond to many diagonal lines. FIG. 8. Thresholded RPofRPs for Bach1: (a) RPofRPs with 𝜺𝒓 = 𝟎. 𝟑. (b) Enlarged view. (c) Corresponding score. The width between the two diagonal lines showed in (b) is 3 seconds, that is almost similar to the time to play one bar of the musical score (c). The unit of the axes is in seconds.
3. Mozart1 Figure 9 (a) shows the thresholded RPofRPs for Mozart1. Blue thin lines on the RP are partitions of the movements. We can see that the graphical patterns are different among the movements. There are two kinds of diagonal lines in Fig. 9(a): narrow (see Fig. 9(b)) and wide (see Fig.9(c)). Figure 9(b) was the theme of this piece. The interval of diagonal lines is 3 seconds, which corresponds to about 2 bars. Whereas, Fig. 9(c) was the intersection areas between variation VI+VII and X. The interval of these thick lines corresponds to 8 bars. Every variation consists of 24 bars, so the three thick lines in Fig.9(c) demonstrate the similarity between phrases beyond the small difference across the variations. In addition, by focusing on the square of Fig. 9(d), we can compare the similarity between the most gorgeous and fast variation XII with another variation. In the same way, by focusing on the square of Fig. 9(e), we can compare the similarity between the simplest theme and another variation. Figure 9(f) is a table whose numbers indicate the main note length for the rhythm of each variation: 4 means a quarter
9
note, 8 means an eighth note, 16 means a 16th note, and 8tri means eighth triplets. The variations which have many dots in the square of Fig. 9(d) correspond to 16 or 8tri (colored cyan), while many dots in the square of Fig. 9(e) correspond to 4 or 8 (colored yellow), except for variation XI whose tempo was very slow and the 16th note duration was similar to a quarter note duration of another variations. FIG. 9. Thresholded RPofRPs for Mozart1: (a) RPofRPs with 𝜺𝒓 = 𝟎. 𝟏. (b) The theme. (c) Intersection areas between variation VI+VII and X. (d) Intersection areas between variation XII and other variations. (e) Intersection areas between the theme and other variations. (f) The main beat of each variation. The unit of the axes is in seconds. 4. Beethoven1 Figure 10 (a) shows the thresholded RPofRPs for Beethven1. Blue thin lines are partitions of the choruses or verses. We can see that graphical patterns are different among the musical chunks, and there are a variety of diagonal lines. Yellow circles with the dotted line (Fig. 10 (b1)) show the intersections between the part from bar No.23 to No.63 and the part from bar No.162 to No.202. We can see a long thick diagonal line. As shown in Fig.10 (b2) and Fig.10 (b3), they are similar choruses at the different keys by a major third over 40 bars. Thus, the RPofRPs can represent the similarity for similar melodies played in different keys. Moreover, the circle with the red line corresponds to a chorus where arpeggios and chords were played in fortissimo in succession (see Fig.10 (c)). Narrowing down the interval between diagonal lines represents that the tempo becomes fast. FIG. 10. Thresholded RPofRPs for Beethoven1: (a) RPofRPs with 𝜺𝒓 = 𝟎. 𝟏. (b1) intersections between the part from bar No.23 to No.63 and the part from bar No. 162 to 202. (b2) The score of the part from bar No.23 to No.63. (b3) The score of the part from bar No.162 to No.202. (c) The score of the part from bar No.148 to No.161. The unit of the axes is in seconds. ( CA: chorus A, CB: chorus B, CC: chorus C, CD: chorus D, VA: verse A , VB: verse B, VC: verse C, VD: verse D, and END: ending)
C. Determinism (DET) Figure 11 shows the determinism (DET) of each music piece. Gray lines show DET of the short-term RPs. Red horizontal lines represent DET of the RPofRPs of the whole piece. Blue lines correspond to DET of each musical section (movements, chorus, or verse) of RPofRPs. Note that the gray lines which are the same as the DET of the conventional recurrence plots and the blue lines (the DET by our method) look completely different. In addition, the blue lines tend to show high scores at the first chorus, then vary largely at the middle, and gradually increase towards the end. We calculated the correlation between a linear line going up
10
towards the right end and the DET scores without the first chorus. They had positive correlations in significance level 0.0001. The correlation coefficients were 0.41 for Mozart1, and 0.55 for Beetoven1.
FIG. 11. Determinism (DET): DETs of (a)Bach1, (b)Mozart1 and (c) Beethoven1. The gray lines show the shortterm RP, the red lines show the whole RPofRPs, and the blue lines show sectioned RPofRPs.
IV. DISCUSSION AND FUTURE WORK As we described in the previous section, the temporal change of the DET of each musical section of RPofRPs (the blue lines in Fig.11) tends to show high scores at the first chorus, then vary largely at the middle, and gradually increase towards the end. We can understand the tendency intuitively in the following way. In the western tonal music theory, it is needed to 'resolve' a note or a chord from dissonance to consonance at the end of a piece. In a piece on some key, the frequency ratio between a tonic note and a consonant note is simple (ex. octave = 1:2, fifth = 2:3), and the ratio between a tonic note and a dissonant note is more complex (ex. minor second = 15:16) 11,12. That is to say, the determinism scores increase as an inevitable consequence. In a practical musical performance, not only consonance/dissonance but also many musical elements (e.g., pitch, harmony, tempo, amplitude, and meter) are affecting to the determinism complicatedly. However, if we use the linear audio signal analysis method and once convert to the feature vectors, the original mutually connected information may collapse. After that, we cannot calculate the global determinism of the music whose elements are influenced with each other intricately. On the other hand, our method enabled the calculation of the global determinism by using the recurrence plots hierarchically. In addition, the determinisms (DET) of our method may be effective as a measure to analyze emotional response to the music too. There are two pathways of emotion inside the brain13,14: a rough and fast pathway related to the basal ganglia and the limbic system, and a detailed and slow pathway related to the cortex. Two pathways are integrated into our conscious emotions. We conjecture that the rough and fast pathway relates to the DET of the short-term RPs, and the detailed and slow pathway relates to the DET of sectioned
11
RPofRPs. By means of comparing the time series of subjective emotion and the DETs, we may analyze the subjective emotions by considering experimental setups under unconsciousness. Then, we analyze an additional toy model data to show a characteristic of our method more clearly. The dataset is generated by the Lorenz model (see Eqs. (8), (9) and (10)) with the parameter 𝜎 = 10 and 𝛽 = 8/3. With these parameters, the trajectory shows the strange attractor during the parameter r exceeds the Hopf bifurcation point r = 24.748. We set the parameter r driven by the sine wave as follows: 𝑟 = 5 ∗ 𝑠𝑖𝑛 (𝑡𝜋/30) + 29.74, (13) where t is the time. The initial values are set to 𝑥, 𝑦, 𝑧 = 0.0,1.0,1.0 . We integrate the above equations from 𝑡 = 0 to 200 at 0.001 intervals. To emulate the real world situation, we use only variable x data for the analysis, and r represents a perturbation for the system. The window size of the short-term RP is set to 4000, and the shift width is 1000, while the delay time is set to 1, and the dimension is set to 3. Figure 12 shows the input data of variable x and the RPofRPs. We obtain a synthesized time series from the RPofRPs by applying the method of reproducing original time series from recurrence plots15. Figure 13 shows the time series r and the synthesized time series. We can observe an apparent influence from r to the synthesized time series. They have correlation with the correlation coefficient 0.41 at the significance level less than 0.0001. Thus, RPofRPs can extract slow perturbation from long time series if the slow perturbation exists, and express global regularity due to local regularity, even if we have only a part of the data. While the metarecurrence plots (MRPs)16 extract the slow perturbation of the long time series by using sparse information (only 0 and 1) to obtain a global view, our method keeps gradual information in the RPofRPs. Therefore, RPofRPs may be easier to use for further applications. FIG. 12. RPofRPs of perturbed Lorenz. (a) Input data (Lorenz variable x, where r is driven by sine wave). (b) RPofRPs FIG. 13. Time series r and the synthesized time series. The dotted red line shows r and the blue line shows the synthesized time series. The mean, the standard deviation and, the orientation of the synthesized time series were adjusted so that these elements match with those of the original r.
12
Next, we describe the future work. In this paper, for the short-term RPs of the musical data, we set the window size to 4 seconds (44100 Hz x 4 seconds = 176,400 points), and the shift size to 1 second (44100 point). 4 seconds is almost equivalent to one bar in a common measure (four-four time), while the length of a quarter note is 1 second. We tried several values, and selected the appropriate values considering the visibility of the PRofPRs. Varying the values may realize different observations of the data. As mentioned in the Method section, we selected the threshold value considering the visibility. Although the DET scores are higher by setting the threshold value larger (if all of the RPs are plotted, the score is the maximum), if there are no diagonal lines or other patterns on the recurrence plots, the threshold value is not appropriate. Then, users need to try several values and inspect the corresponding recurrence plots visually. Additionally, by the definition of DET (see Eqs. (11) and (12)), we counted only straight diagonal lines which are parallel to the central diagonal line, although a RPofRPs shows many curves which are not parallel to the central diagonal line. We need a new measure which can count such non-diagonal but meaningful curves in the future. Besides DET, it may be meaningful to use other recurrence quantification analysis (RQA) measures2,4 and look at the correlations of the geometric patterns on RPofRPs with various musical features such as tempo and dynamics. Furthermore, the distance measure to calculate the short-term RP and the RPofRPs might have room for further improvements. Instead of the Euclidean distance which we employed (see Eqs. (4) and (6)), for example, we may use the Canberra metric17, which is an L1 family and known as very sensitive around zero, for reducing the strong influence of the amplitude for the waveform and/or the unthresholded short-term RPs. The appropriate distance measure might be different for each property of the target time series. From another point of view, we may select special measures that can grasp, for example, the phase, entropy, or geometry, because such measures can represent more complex structural property of the time series naturally.
13
If we consider purely theoretically, a recurrence plot can be regarded as a network15 and thus the proposed RPofRPs might be regarded as the "network of networks"18. Therefore, one may view a RPofRPs as a new way of describing a network of networks, while one may use some measures of the "network of networks" for characterizing a RPofRPs. These directions of research contain many open questions.
Moreover, we could emphasize other features of the same music notes by analyzing their music scores or MIDI data instead of their music waveform data even if we use the same proposed technique. By default, a music score does not have its performance information such as accents and tempo changes, while the corresponding MIDI data contains additional information of playing performances and thus would be suitable for comparing with the music waveform data. To characterize a music score or MIDI data, we may apply the edit distance for a marked point process19,20 to calculate a distance between every pair of time windows. We expect that music scores or MIDI data provide us more precise harmonic structural information than their music waveform counterparts, while they include no information related to dynamics, especially timbral information, which would be represented better by the music waveform data as demonstrated by our results. We will compare RPsofRPs of these different data in our future research.
V. CONCLUSION We proposed a method of the recurrence plot of recurrence plots (RPofRPs) which uses the recurrence plots hierarchically. The RPofRPs enabled us to visualize both the local and global regularities at the same time, without corrupting the underlying regularities of the original time series. We applied this method to the music pieces, and showed that the RPofRPs can represent the global musical features. Furthermore, we calculated the determinism (DET) scores of sectioned RPofRPs, and found that DETs tend to show high scores at the first chorus, then vary largely at the middle, and gradually increase towards the end. In addition, we discussed a possibility that the DET scores may be useful for analyzing the emotional response to the music. We hope that the RPofRPs will be used for the extensive time series analysis that requires microscopic and macroscopic views simultaneously.
14
ACKNOWLEDGMENTS We appreciate the RWC Music Database for providing the musical data used in this study. We grateful to Dr. D. Chelidze for providing the MATLAB library used in this study. This research is partially supported by CREST, JST, Japan.
REFERENCES 1
J. -P. Eckmann, S. O. Kamphorst, and D. Ruelle, Europhys. Lett. 4, 973 (1987). N. Marwan, M. C. Romano, M. Thiel, and J. Kurths, Phys. Rep. 438, 237 (2007). 3 Y. Hirata, E. -J. Lang, and K. Aihara, Recurrence plots and the analysis of multiple spike trains, K.Nikola ed., Springer Handbook of Bio-/Neuroinformatics (Springer, Berlin, 2014) pp.735-744. 4 J. S. Iwanski and E. Bradley, Chaos 8, 861 (1998). 5 J. P. Bello, IEEE/ACM Trans. Audio Speech Lang. Process. 19, 2013 (2011). 6 J. Serra, X. Serra, and R. G. Andrzejak, New J. Phys. 11, 093017 (2009). 7 K. Iwayama, Y. Hirata, K. Takahashi, K. Watanabe, K. Aihara, and H. Suzuki, Sci. Rep. 2, 423 (2012). 8 E. N. Lorenz, J. Atmos. Sci. 20, 130 (1963). 9 M. Goto, Development of the RWC music database, Proceedings of the 18th International Congress on Acoustics (ICA 2004), Vol. I, pp.553-556 (2004). 10 D. Chelidze, Statistical characterization of nearest neighbors to reliably estimate minimum embedding dimension, Proceedings of International Design Engineering Technical Conferences & Computers and Information in Engineering Conference (ASME 2014), Vol. 8, doi:10.1115/DETC2014-34746 (2014). 11 H. Helmholtz, On the Sensations of Tone as a Physiological Basis for the Theory of Music (Dover Publications, New York, 1877). 12 Y. Ushakov, A. Dubkov, and B. Spagnolo, Phys. Rev. Lett. 107, 108103 (2011). 13 J. E. LeDoux, Annu. Rev. Neurosci. 23, 155 (2000). 14 A. Damasio, The Feeling of What Happens: Body and Emotion in the Making of Consciousness (Mariner Books, New York, 2000). 15 Y. Hirata, S. Horai and K. Aihara, Eur. Phys. J. Spec. Top. 164, 13–22 (2008). 16 M. C. Casdagli, Physica D 108, 12 (1997). 17 S. Cha, Math. Mod. Meth. Appl. S. 1, 300–307 (2007). 18 J. F. Donges, H. C. H. Schultz, N.Marwan, Y. Zou, and J. Kurths, Eur. Phys. J. B 84, 635–651 (2011). 19 S. Suzuki, Y. Hirata, and K. Aihara, Int. J. Bifurcat. Chaos 20, 3699 (2010). 20 Y. Hirata and K. Aihara, Chaos 25, 123117 (2015). 2
15
X. FIGURES
1
3
shift size
window size
FIG.1. Recurrence plot of recurrence plots: we divide a long time series into short-term segments at a constant interval, and calculate multiple short-term RPs. Then using short term RPs, we calculate a RPofRPs. z
y
FIG. 2. Input data (toy model): Attractor of the Lorenz model (σ=5, r = 40, and 𝜷 = 8/3).
x
16
(a) amplitude
0.4 0.2 0 -0.2 -0.4 0
1
2
3
4
(b)
5
6
10 6
samples
FIG. 3. Input data (Bach1): (a) Score of the first 2 bars of J. -S. Bach, "The Well-Tempered Clavier, Book 1, no.1 in C major BWV.846. Prelude". (b) Waveform of the whole tune. linear PCM, 44.1kHz 16bit mono. theme
(a) amplitude
0.8 8 0.6 6
.6 -0.6 -0.8 .8 0
2
4
6
theme
(b)
8
10
12
10
6
samples
FIG. 4. Input data (Mozart1): (a) Score of the theme of W. A. Mozart, "Variations on ”Ah! Vous dirai-je maman” K.265". (b) Waveform of the whole tune. linear PCM, 44.1kHz 16bit mono.
(a) amplitude
1
0.6
0.2 0 -0.2
-0.6
-1 0
0.5
1
(b)
1.5
2
2.5
7
# 10
samples
FIG. 5. Input data (Beethoven1): (a) Score of the starting bars of L. V. Beethoven, " Piano Sonata no.23 in F minor, op.57 'Appasionata'. 1st mvmt.". (b) Waveform of the whole tune. linear PCM, 44.1kHz 16bit mono.
17
5
x10 2
10 5
10 9 120
3.5
2.5
3
100
2.5
2
80
2
1
1.5
60
1.5
1
0.5
0.5
1
1.5
1
40
0.5
20
0
2 5 x10
20
Lo3XX5
4000
40
60
80
100
C25XX80
C25XX60 70
3500
4000
60
3000
0
120
0.3
3500
4000
0.4
3500
0.35
3000
0.3
2500
0.25
2000
0.2
1500
0.15
1000
0.1
0.25 50
2500
3000 2500
40
2000 1500
30
1000
20
500
10
0.2
2000
0.15
1500
0.1
1000 0.05
500 500
1000
1500
2000
2500
3000
3500
0
4000
500
1000
1500
2000
2500
3000
3500
500
0
4000
0.05
500
1000
1500
2000
2500
3000
3500
10 5
400
0
4000
10 6
2.5
550
10
500
350 300
400 350
250
6
1.5
300
200
250 1
4
150
200 150
100
2
0.5
100
50
50
50
100
150
200
250
300
350
0
400
C27XX275
C27XX30 0.45
4000
0.4
3500
0.35
3000
0.3
2500
0.15 0.1
500
0.05
1000
1500
2000
2500
3000
3500
4000
0
150
200
250
300
350
400
450
500
0
550
C28XX350
C28XX30
1.2
0.12
4000
4000
0.7
0.1
3500
1
3500
0.6
3000
3000
0.08
0.5
2500
1500
0.2
1000
500
1000
1500
2000
2500
3000
3500
4000
0.04
0.8
0.6
2000 1500
0.4
1000
1000
0.2
0.02
0.1
500
0.06
2000
0.3
1500
3000 2500
2500 0.4
0.2
1000
100
0.8
3500
2000
1500
50
4000
0.25
2000
500
2
450
8
500
500
0
500
1000
1500
2000
2500
3000
3500
4000
0
500
1000
1500
2000
2500
3000
3500
4000
0
FIG. 6. Unthresholded RPofRPs and short-term RPs : (a) RPofRPs of the toy model (unthresholded) with enlarged view. (b) short-term RP of the toy model data. (c) RPofRP of Bach1. (d) short-term RP of Bach1 (left:No.60, right:No.80). (e) RPofRPs of Mozart1. (f) short-term RP of Mozart1 (No.30,275). (g) RPofRPs of Beethoven1. (h) short-term RP of Beethoven1 (No.30,350). We set window size = 4000, shift size = 1000, delay time=1, and dimension=3 in (b). In (d), (f), and (h) we set window size = 4 seconds (4410), shift size = 1 second (1100), delay time = 40, and dimension = 5.
18
200 180 160 140 120 100 80 60 40 20 50
100
150
200
FIG. 7. Thresholded RPofRPs (the toy model) with 𝜀W = 0.1
120
100
80
60
40
20
20
40
60
(a)
80
100
120
bar No.4
(b)
(c)
3sec≒1 bar
FIG. 8. Thresholded RPofRPs for Bach1: (a) RPofRPs with 𝜺𝒓 = 0.3. (b) Enlarged view. (c) Corresponding score. The width between the two diagonal lines showed in (b) is 3 seconds, that is almost similar to the time to play one bar of the musical score (c). The unit of the axes is in seconds.
19
(d) XII
400
350
XI
300
X IX
250
VIII
200
VII VI
150
V IV
100
III II
50
I T T
I
50
II
100 III IV
V
150
VI
200 VII VIII
250 IX
(a) (b)
X
300 XI
350
400 XII
(e)
(c)
♩
(f) FIG. 9. Thresholded RPofRPs for Mozart1: (a) RPofRPs with 𝜺𝒓 = 0.1. (b) The theme. (c) Intersection areas between variation VI+VII and X. (d) Intersection areas between variation XII and other variations. (e) Intersection areas between the theme and other variations. (f) The main beat of each variation. The unit of the axes is in seconds.
20
END 550
CC
500
VC CC
450 CD VD
400
CC CB
350
CA VA
300
CC
250
VC 200
VB VA
150 5
CD
100
CC CB
50
CA VA VA
50 CA
(b2) bar No.23
bar No.162
CB
100 CC
150 CD VA
200 VB
(b1)
VC
250 CC
300 VA
350 0 CA CB
400 450 CC V VD D CD CC
500 VC
550 CC
END
(a) bar No.148-161
bar No.63
bar No.202
(b3) (c) cont.
21
FIG. 10. Thresholded RPofRPs for Beethoven1: (a) RPofRPs with 𝜺𝒓 = 0.1. (b1) intersections between the part from bar No.23 to No.63 and the part from bar No. 162 to 202. (b2) The score of the part from bar No.23 to No.63. (b3) The score of the part from bar No.162 to No.202. (c) The score of the part from bar No.148 to No.161. The unit of the axes is in seconds. ( CA: chorus A, CB: chorus B, CC: chorus C, CD: chorus D, VA: verse A , VB: verse B, VC: verse C, VD: verse D, and END: ending) Bach1
1
Mozart1
1
0.9
0.9
0.8
0.8
0
50
(a)
100
0
50
100
150
time (seconds)
200
(b)
250
300
350
400
450
time (seconds)
Beethoven1
1 0.9 0.8 0
100
200
300
(c)
400
500
600
time (seconds)
FIG. 11. Determinism (DET): DETs of (a)Bach1, (b)Mozart1 and (c) Beethoven1. The gray lines show the short-term RP, the red lines show the whole RPofRPs, and the blue lines show sectioned RPofRPs.
22
20 0 -20 0 5
2
1
1.5
(a)
time index
2 ×10 5
×10 9
5
3.5
time index
x10
0.5
3
1.5 2.5
2
1 1.5
1
0.5
0.5
0.5
1
1.5
(b)
2
time index
0 5
x10
FIG. 12. RPofRPs of perturbed Lorenz. (a) Input data (Lorenz variable x, where r is driven by sine wave). (b) RPofRPs
normalised signals
36 34 32 30 28 26 24 22
0
0.5
1
1.5
2
time index x10 FIG. 13. Time series r and the synthesized time series. The dotted red line shows r and the blue line shows the synthesized time series. The mean, the standard deviation and, the orientation of the synthesized time series were adjusted so that these elements match with those of the original r.
23
5