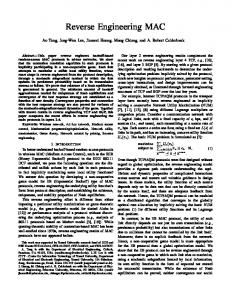
Figure 2. Macbeth (X-Rite) color chart and indentifiers used in the test. Further down the color calculation in a camera, the primaries and white point of the target ...
©2016 Society for Imaging Science and Technology DOI: 10.2352/ISSN.2470-1173.2016.7MOBMU-286
RED color spaces demystified - reverse engineering of RED color by spectral analysis of Macbeth color charts and RED Scarlet-X Camera recordings Eberhard Hasche, Patrick Ingwer, Reiner Creutzburg, Thomas Schrader, Frederick Laube, Timo Sigwarth, Brandenburg University of Applied Sciences; Brandenburg a. d. Havel , Brandenburg/Germany
Abstract Modern digital film cameras are using mostly CMOSMosaic-sensors with a Bayer pattern, resulting in a four channel representation of the light from the scene. That four channel may be merged to one channel or kept separately for further processing. This data is known as sensor raw and has at this stage no additional processing applied with the exception of interpolating missing pixels. These signals cannot be displayed properly because the display would need primaries with negative values which is physically not possible. So the data has to be debayered – the two green, one red and one blue color channel are filtered and combined, and then converted, usually by a 3x3 matrix to a certain color space – the Camera RGB color space, which is proprietary by the camera manufacturer.
display. This is most notably in the relationship between reference white (f. i. a reflector of a certain percentage of white, a white shirt etc.) and the highlights (strong lights, f. i. the sun reflected in chrome elements of a car). Due to the limited dynamic range, there is nearly no dynamic space left between the two elements and they appear as the same color on the screen. Another problem within this approach is that the viewing conditions at the end of the workflow are not known at the beginning. Due tot he fact that they can differ dramatically (EOCF BT.709 = 1.95 - bright office, EOCF DCIP3 2.6 - dark cinema), later calculations and transforming may introduce artifacts in the images.
From this stage other 3x3 matrix conversions to different color spaces are possible. There are specified ones like sRGB, ITU BT.709 or Adobe RGB, but also proprietary color spaces by the camera manufacturer, to establish a certain look and feel. This is done by converting the RAW Sensor or the RGB Camera data to their own proprietary color spaces, using a 3x3 matrix. In the case of RED cameras, the color spaces in question are REDspace, REDcolor, REDcolor2, REDcolor3, and REDcolor4. The underlying 3x3 matrixes are not documented and only some verbal description is available.
While television/video cameras are producing high contrast – low dynamic range images, film cameras usually are embracing the opposite approach. They are generating low contrast, high dynamic images which are mostly not changed destructively throughout the working pipeline. Usually, at the beginning of the production, a certain look is created and applied nondestructively additionally to the original material using 1-D and 3-D LUTs or Color Decision Lists (CDLs). Finally, these color settings are used as a starting point at the Digital Intermediate step where the images are color corrected and mastered destructively for different media and viewing conditions.
The goal of this paper is to measure the color spectrum of a common Macbeth color chart with a spectral camera under a certain lighting condition. Under the same lighting condition, the Macbeth color chart is recorded by a RED Scarlet-X camera. The data from the spectral is then converted to the CIE xyY-color space and the positions of the 24 Macbeth patches are plotted in the CIE xy- chromaticity diagram. The RED raw footage is also converted to the appropriate RED color spaces linear (i. e. without gamma functions applied) and the positions of the Macbeth color patches are converted to the CIE chromaticity diagram as well.
In modern filmmaking, most of the time different sources are used simultaneously, above all for visual effects. Here it is necessary, that all the images from the different sources have the same relationship to the original light of the scene as a basic requirement to combine them. This approach is called scenereferred with the main rule that the relationship to the light has to be linear. This means all correction curves, transfer functions, company engagements to establish a certain look have to be removed. This is often not easy because not all companies are providing the appropriate equations, lookup tables or other material to invert the correction settings.
By comparing the different positions of these patches one can tell how the color conversion works and how the certain RED color spaces are related to each other and to the result from the spectral measurement.
2. Basic Workflow of a modern digital film
or television camera Modern digital film cameras are using different filter and
1. Scene-referred vs Display-referred Workflow color conversion steps to create the final image. Certain steps can
Traditionally video and television cameras aim at producing imagery which is immediately watchable, deliverable or ready for broadcasting. To achieve this goal all the image processing takes place at the front end of the workflow – directly in the camera. The camera operator chooses the appropriate settings, performs a white balance according to the lighting conditions, sets the Optical Electro Conversion Function (gamma), and often creates a look by color correcting the imagery. While the images are immediately watchable, most of the dynamic range of the camera is lost because it is pressed into the reduced dynamic range of the
be combined and are often not completely adequate documented so that it is difficult to choose the step of the color pipeline inside the camera where the relationship to the light is linear.
IS&T International Symposium on Electronic Imaging 2016 Mobile Devices and Multimedia: Enabling Technologies, Algorithms, and Applications 2016
MOBMU-286.1
©2016 Society for Imaging Science and Technology DOI: 10.2352/ISSN.2470-1173.2016.7MOBMU-286
Figure 1. Color workflow in a digital film camera [1]
Figure 1 demonstrates the certain steps in the color pipeline in a digital camera. First – like in all digitizing processes – an Optical Lowpass Filter is applied to remove frequencies around and above the Nyquist frequency. Second, three RGB-color filter are applied to separate the visible light spectrum into three components. The design of these filters is technically oriented at the behavior of the photoreceptors on the retina of a human eye (LMS-filter). Unfortunately, theses filters overlap at great extend in the middle waves (green) and long waves (red). To reduce the corresponding noise, the red component filter is usually shifted 20-30 nm in the long wave direction. With this, an accurate reproduction of the light from the scene is not possible. This color space is the Sensor RAW color space with no additional processing, only missing pixels are interpolated.
Sometimes the captured images residing in this color space are not available but instead are transferred to proprietary color spaces using certain calculations to create a company-dependent look. To avoid losing the linear relationship to the light of the scene, this look can only be removed if the basic equations are communicated by the camera manufacturers.
In the next step, a demosaicing filter is applied. Every photo element representing a single pixel at the final image can only capture one color. So a 4x4 pixel array with two green, one blue and one red filter is in use (Bayer pattern). The missing colors are calculated using the color information of the adjacent photo elements of the same color.
Figure 2. Macbeth (X-Rite) color chart and indentifiers used in the test
Due to the fact that the slope of the filters is not steep enough, the energy of adjacent wavelengths is captured and desaturates the recorded color. By applying a 3x3 matrix, these unwanted wavelengths are removed from the particular color channels. As a result, the colors become more saturated. This color space is sometimes referred as Camera RGB because it is created by the camera manufacturers. This is usually a wide gamut color space. For a linear representation of the light from the scene, this color space works best, because no additional processing has taken place [2].
Further down the color calculation in a camera, the primaries and white point of the target color space are applied and the imagery is converted using a 3x3 matrix. In the case of figure 1 the target space is ITU-R BT. 709 (HD). In the next step, a gamma correction is taking place and an Opto-Electronical Conversion Function (OECF) is applied. At this step, the imagery is shifted in a perceptual uniform color space and the linear relationship to the light of the scene is lost. In the next two steps, the imagery is transferred to another color model consisting of a luminance channel and two color difference channels. This offers the
IS&T International Symposium on Electronic Imaging 2016 Mobile Devices and Multimedia: Enabling Technologies, Algorithms, and Applications 2016
MOBMU-286.2
©2016 Society for Imaging Science and Technology DOI: 10.2352/ISSN.2470-1173.2016.7MOBMU-286 possibility to subsample the color channels and reduce the bandwidth of the imagery.
3. Test Set-Up Considerations The goal of the test is to line out a tendency, which RED color space is best for a linear representation of the light from the scene. Therefore, a Macbeth (now X-Rite) color chart is recorded by a Headwall spectral camera. This color chart is recorded under the same lighting positions by a RED Scarlet-X camera. The color of every patch of the Macbeth chart is converted to the CIE xyYcolor space and plotted in the CIE xy-chromaticity diagram along with the position of the patches recorded by the spectral camera. Important for a scene-referred workflow the maintenance of the linear relationship to the original light of the scene is critical. So the corresponding color space is critical as well. Some companies like Arri are providing equations, primaries and white points of the used color spaces, so the original state of light can be recalculated. Other companies like RED do not communicate this kind of material, so the primaries of the color spaces are unknown just as well as the basic equations for the color conversion. This makes it difficult to spot the appropriate color space that represents the linear light of the scene.
Figure 3. Test Set-up, spectral components [3]
To access the color spaces the proprietary REDLINE-X PRO software (Build 37.1) and the compositing package NukeX9.0v8 by The Foundry were used. Both software packages are offering the following color spaces: • REDcolor • REDcolor 2 • REDcolor 3 • REDcolor 4 • DRAGONcolor • DRAGONcolor2 • RedSpace • Camera RGB • Rec 2020 • Rec 709 Due to the fact that the test camera is a RED Scarlet-X camera with a Mysterium-X sensor the DRAGON color spaces
were not investigated and also video/television color spaces like Rec 709 (HDTV) and Rec 2020 (Ultra-HDTV) were not taken in consideration as well as the RED Space color space. By reason that the primaries of the RED color spaces are not available, a color space as the initial starting point for the calculations had to be chosen. Considering the fact that the colors of each oft he the test charts fall inside the sRGB/Rec709 gamut, the dimensions of this color space (primaries and white point) were used (see table 2). Since the character of the calculations is linear, the linear version of the sRGB color space was chosen and no OECF (gamma correction) was applied. The equation to calculate the transfer from sRGB.linear to CIE xyY is stated in (1) [4].
⎡ X ⎤ ⎡ 0.4123907983 0.3575843275 0.1804807931 ⎤ ⎡ R sRGB ⎥⎢ ⎢ ⎥ ⎢ ⎢ Y ⎥ = ⎢ 0.2126390040 0.7151686549 0.0721923187 ⎥i ⎢ G sRGB ⎢ Z ⎥ ⎢ 0.0193308182 0.1191947833 0.9505321383 ⎥ ⎢ B ⎣ ⎦ ⎣ ⎦ ⎢⎣ sRGB
Patch
RED Color 4
RED Color 4
sRGB
DCI P3(D65)
x
y
x
⎤ ⎥ ⎥ (1) ⎥ ⎥ ⎦
y
a1
0.3969
0.3702
0.411
0.3719
a2
0.3826
0.3555
0.3972
0.3559
a3
0.2759
0.2855
0.2719
0.2822
a4
0.3643
0.4238
0.3704
0.4371
a5
0.2962
0.2815
0.2959
0.2773
a6
0.2797
0.3413
0.2696
0.3436
b1
0.4958
0.4319
0.5318
0.4378
b2
0.2428
0.2218
0.2387
0.2152
b3
0.4575
0.332
0.4865
0.3269
b4
0.3279
0.2672
0.3354
0.2607
b5
0.379
0.4708
0.3876
0.4956
b6
0.4705
0.4658
0.5022
0.4804
c1
0.2197
0.1915
0.2129
0.1844
c2
0.3202
0.4385
0.3131
0.458
c3
0.5142
0.3375
0.549
0.3307
c4
0.442
0.4792
0.467
0.5002
c5
0.3938
0.2788
0.413
0.2731
c6
0.2377
0.2669
0.2257
0.2612
d1
0.3278
0.345
0.3299
0.3464
d2
0.3253
0.3418
0.3273
0.3433
d3
0.3259
0.342
0.3271
0.3437
d4
0.3261
0.343
0.328
0.3442
d5
0.3229
0.3385
0.3235
0.339
d6
0.3235
0.3382
0.3286
0.3371
Table 1. Position oft he Macbeth color patches in CIE xy-chromaticity diagram using sRGB and DCI P3 primaries (the color space is RED Color 4, white point for both is CIE D65).
IS&T International Symposium on Electronic Imaging 2016 Mobile Devices and Multimedia: Enabling Technologies, Algorithms, and Applications 2016
MOBMU-286.3
©2016 Society for Imaging Science and Technology DOI: 10.2352/ISSN.2470-1173.2016.7MOBMU-286
x y Y
Red 0.6400 0.3300 0.2126
Green 0.3000 0.6000 0.7152
Blue 0.1500 0.0600 0.0722
White point 0.3127 0.3290 1.0000
Table 2. Primaries and white point of the sRGB/BT.709 color spaces [5]
To test the validation of the sRGB color space, the calculations were compared with the results using the wider DCI P3 color space with the D65 white point. The equation to calculate the transfer from DCI P3(D65) to CIE xyY is stated in (2) [6]. ⎡ X ⎤ ⎡ 0.4865709543 0.2656677067 0.1982172876 ⎤ ⎡ RDCI ⎢ ⎥ ⎢ ⎥ ⎢ ⎢ Y ⎥ = ⎢ 0.2289745658 0.6917385458 0.0792869105 ⎥ i ⎢ G DCI ⎢ Z ⎥ ⎢ 0 0.0451133809 1.0439443588 ⎥ ⎢ B ⎣ ⎦ ⎣ ⎦ ⎢⎣ DCI
⎤ ⎥ (2) ⎥ ⎥ ⎥⎦
The result of the calculations is denoted in table 2. Due to the wider color DCI P3 color space, the position of the patches in the CIE xyY color space are stretched in the direction of the more saturated colors (i. e. the spectral locus) compared to the position of the patches using the sRGB primaries. Due to the common practice that only the Camera RGB color space has a wider gamut which is, in turn, decreased by converting the colors to match the reduced gamut of the display and because the stretching is more or less even, only the sRGB.linear to CIE xyY transfer function was used in the calculations to get an overall tendency. For better comparison the results are plotted in figure 4.
factor in the calculations. The three values were then averaged and multiplied with the CIE Color Matching Functions (1931– observer 2°) [7]. As the white point, CIE D65 (6500 K) was applied, because most of the film/video/tv color spaces are using this white point [5][8][9]. For generating the RGB values from the RED camera material the software The Foundry Nuke.0v8 was used. Interpreting the recorded RED R3D-material the following settings – in addition tot he appropriate color space –were applied: • gamma space: half float linear • color version: v2 • ISO 250 • kelvin 3500 (white point – discussion see next section)
5. White Point Balancing To match both measurements a reference point has to be chosen. In this test the color values of the Macbeth 14% color chart were used, because they come close to the 18% grey chart which is an important reference point for color calculations in high dynamic range material from digital film cameras [10]. The indoor lighting with an incandescent-like light causes the overall color tinting to be yellowish. So the Macbeth patch #22 (d4 in this test) is shifted slightly to yellow in comparison to the CIE D65 white point. To match the position of the 14%-gray patches in the RED-Scarlet-X recordings, an appropriate white point has to be chosen to interpret this material. The results of the calculations using different white points and the sRGB.linear to CIE xyY conversion function are stated in Table 3. Although no color temperature matches the spectral gray patch completely, some came close. So a color temperature of 3500 K had been chosen which, in turn, is used throughout the test. Camera RGB Patch d4 x
y
To interpret the results coming from the spectral camera four samples positioned randomly on any patch were created and the results averaged. For each of these samples, only wavelengths between 400 and 700 nm were considered. Every 10 nm a sample had been calculated. Additional values at wavelengths +5 and -5 nm from the sampling point are also retrieved to reduce the noise
x
x
y
y
0.3156
0.3323 0.3177 0.3353 0.3167 0.3341
3400
0.3184
0.3344 0.3222 0.3393 0.3203 0.3373
3500
0.3213
0.3366 0.3265 0.3432 0.3237 0.3404
3600
0.3242
0.3388 0.3310 0.3474 0.3272 0.3436
3700
0.3300
0.3464 0.3352 0.3511 0.3306 0.3465
Patch d4 x
4. Evaluation of the Spectral Data
RED Color 2
3300
RED Color 3
Figure 4. Positions oft he Macbeth color patches in CIE xy-chromaticity diagram using sRGB (squares) and DCI P3 (circles) primaries
RED Color
y
RED Color 4
Spectral value
x
x
y
y
3300
0.3092
0.3275 0.3084 0.3275 0.3220 0.3492
3400
0.3132
0.3311 0.3136 0.3318 0.3220 0.3492
3500
0.3172
0.3347 0.3170 0.3351 0.3220 0.3492
3600
0.3210
0.3380 0.3212 0.3389 0.3220 0.3492
3700
0.3249
0.3415 0.3253 0.3425 0.3220 0.3492
Table 3. White point calculations using different color tempratures
IS&T International Symposium on Electronic Imaging 2016 Mobile Devices and Multimedia: Enabling Technologies, Algorithms, and Applications 2016
MOBMU-286.4
©2016 Society for Imaging Science and Technology DOI: 10.2352/ISSN.2470-1173.2016.7MOBMU-286
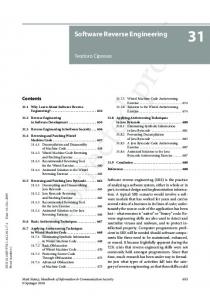
6. Discussion 6.1. Spectral Results The results of the spectral camera data are plotted in figure 5. The different values for all calculations are shown in table 5 in Appendix A. All color patches lie inside the sRGB color gamut. The positions of the spectral color patches are used as reference throughout the plotting of the patch positions from the appropriate RED color spaces. It should be mentioned that the red, green, and blue Macbeth color patches do not represent the primaries of the appropriate color spaces and so do the secondary colors (cyan, yellow and magenta), i. e. they do not fit in the spots on a vectorscope. Figure 6. Macbeth patches naming
6.2. Camera RGB The results of the Camera RGB color space are plotted in figure 7. The overall impression is a desaturated appearance, which may indicate that the data is not cleared of adjacent unwanted wavelengths. But as figure 13 demonstrates, the offsets of the single patches from the spectral measurements are surprisingly even and applying a color space with a considerable larger gamut shows the tendency that the Camera RGB patches may fit pretty well in the spectral spots if the correct color space is applied. Usually, Camera RGB color spaces are wide gamut. So one may assume that a wide gamut is used in the case of the internal RED calculations as well. Dueto the fact that the original primaries are unknown and it is also not known how these initial positions are converted to the camera output, the internal saturation may be much higher. An estimation is made in the conclusion section.
Figure 5. Positions of the Macbeth color patches in the CIE xychromaticity diagram from spectral camera data
To compare the different RED color spaces selected color areas are discussed: a. Red, Magenta (moderate red-b3, red-c3, magentac5) b. Green (foliage-a4, yellow green-b5, green-c2) c. Blue, Cyan (purplish blue-b2, blue-c1, cyan-c6) d. Orange, Yellow (yellow-c4, orange yellow-b6, orange-b1) Also discussed is the ability of the patches to match the particular vector angle from the neutral gray patch to the spectral spot (see figures 12 and 13) because increasing the saturation may move the patches closer to the spectral locus (the border oft the xy-chromaticity diagram) and so maybe to their spectral spots (indicated in the figures as hollow squares).
Figure 7. Camera RGB color space positions of the Macbeth color patches in the CIE xy-chromaticity diagram
IS&T International Symposium on Electronic Imaging 2016 Mobile Devices and Multimedia: Enabling Technologies, Algorithms, and Applications 2016
MOBMU-286.5
©2016 Society for Imaging Science and Technology DOI: 10.2352/ISSN.2470-1173.2016.7MOBMU-286
6.3. RED Color The results of the RED Color space are plotted in figure 8. In comparison to the Camera RGB color space, the saturation is considerably increased. The red colors come close to their spot without reaching them. The position of the magenta color is also moderate off and the angle of the vector from the neutral gray patch is close to 20 ° off. Magenta is a color hard to reproduce because it is positioned close to the artificial purple line in the CIE xy-chromaticity diagram which closes it by connecting the colors at wavelength 380 nm and 700 nm. Otherwise, to reproduce the purple color correctly, the long wave component (red) needs a portion of the blue shortwave components to be included in the calculation. The blue colors and the cyan color are also moderately off, while the vectors coming from the gray patch nearly hitting the spots. The yellow-orange colors are positioned outside the sRGB/BT.709 gamut but close to the specular spots. They are considerably more saturated than the other colors. The green colors are considerably off the spots with the vectors for all three patches around 20° off. This color space emphasise the yellow-orange colors and may produce a warm look.
Figure 9. RED Color 2 space positions of the Macbeth color patches in the CIE xy-chromaticity diagram
The green colors are considerably off the spot with no improvement for the vectors but closer to their spectral spots. The yellow-orange colors are reduced as well as the other colors and centered around the yellowish orange. It appears that this color space is appropriate for a more neutral color expression. It comprises a tendency to emphasize the yellowish colors which are compressed slightly to orange-yellow (b6) to a midtone which matches loosely the heavily demanded late afternoon daylight in filmmaking.
Figure 8. RED Color space positions of the Macbeth color patches in the CIE xy-chromaticity diagram
6.4. RED Color 2 The results of the RED Color 2 space are plotted in figure 9. This color space is dramatically desaturated in comparison to the RED Color space which causes all patches to miss their spots considerably. For the red colors, the vectors from the neutral gray patch are off moderately. The vector to the magenta patch is slightly more off. Also, the blue colors are heavily off, with their vectors still fine.
Figure 10. RED Color3 color space positions of Macbeth color patches in CIE xy-chromaticity diagram
IS&T International Symposium on Electronic Imaging 2016 Mobile Devices and Multimedia: Enabling Technologies, Algorithms, and Applications 2016
MOBMU-286.6
©2016 Society for Imaging Science and Technology DOI: 10.2352/ISSN.2470-1173.2016.7MOBMU-286
6.5. RED Color 3 The results of the RED Color 3 space are plotted in figure 10. The desaturation in RED Color 2 has been partially removed. The red colors are moved in great extend closer to their spectral spots while magenta (c5) is still heavily off. The blue colors are moved slightly to the spectral locus but are still off from their target spectral spots considerably. The green colors are closer to the spectral spots with green (b5) still off. This color space represents the less saturated colors very well, but lacks the ability to represent the saturated colors and for this, it is maybe appropriate for an overcast day.
6.6. RED Color 4 The results of the RED Color 4 space are plotted in figure 11. All colors are more saturated and for this reason, they are moved in the direction of their spectral slots. The reds come closer but with magenta still off while following a vector that does not point to the respective spot. The greatest improvement is made for the blue colors. They are almost reaching their spectral spots. The mid green colors (a4) and (b5) are close to their spectral spots, with green (c2) still heavily off. The yelloworange colors mostly hit their spectral spots. All in all, this color space represents best the linear relationship to the light of the scene for all RED color spaces but still lacks matching the direction for magenta and green. Though the results tare roughly matching, they are unacceptable for a physical plausible linear representation of the light from the scene.
is calculated and applied to maintain the linear relationship to the light as closely as possible. During this process, all the influences by the camera sensor, the lenses, and the software calculations are removed. This is expensive because it has to be repeated for every changing oft he lighting conditions. If applying this process is not possible, is it desirable to choose a color space provided by the camera manufacturers. In this case RED Color 4 may be the best choice. The vector angles from the neutral gray to the specular spots may be better in RED Color 3 but the saturation in RED Color 4 is much better. Figure 12 shows the vectors from neutral gray to the primary (red, green, and blue) and secondary colors (yellow, magenta, and cyan). Whereas the vectors hit cyan and blue very well, red and yellow come close, magenta and green are considerably off, making this color space not a valid decision in many cases. But another color space may be considered. As pointed out in section 6.2 the vectors in Camera RGB are pointing mostly right to their particular spectral spots (see figure 13). Assuming that internal a wide gamut color space had been used, a test was made to prove this assumtion. ⎡ X ⎤ ⎡ 0.638008 ⎢ ⎥ ⎢ ⎢ Y ⎥ = ⎢ 0.291954 ⎢ Z ⎥ ⎢ 0.002798 ⎣ ⎦ ⎣
0.214704 0.823841 -0.067034
0.097744 -0.115795 1.153294
⎤ ⎡ R sRGB ⎥ ⎢ ⎥ i ⎢ G sRGB ⎥ ⎢ B ⎦ ⎢⎣ sRGB
⎤ ⎥ ⎥ ⎥ ⎥⎦
(3)
In this case the Arri Wide Gamut color space conversion was applied to the Camera RGB output of the RED cameras with the equation (3) [11]. The result of the applied color conversion is stated in table 12 and plotted in figure 13 (circles).
Figure 11. RED Color4 space positions of the Macbeth color patches in CIE xy-chromaticity diagram Figure 12. Color vectors in RED Color Space 4
7. Conclusion To generate imagery that matches the light of the scene using film cameras in modern filmmaking, often a camera characterization is applied. Within this procedure the spectral data is compared with the camera recordings and a 3x3 matrix
IS&T International Symposium on Electronic Imaging 2016 Mobile Devices and Multimedia: Enabling Technologies, Algorithms, and Applications 2016
MOBMU-286.7
©2016 Society for Imaging Science and Technology DOI: 10.2352/ISSN.2470-1173.2016.7MOBMU-286
ARRI WIDE GAMUT Patch
x
y
c1
0.2192
0.2061
c2
0.2943
0.4589
c3
0.5321
0.3139
c4
0.4618
0.4694
c5
0.4196
0.2076
c6
0.2197
0.2726
d4
0.3281
0.3414
Table 12. Coordinates of the primary and secondary colors of the RED Camera space using the primaries of a Wide gamut color space (Arri Wide Gamut)
Surprisingly, the magenta, green, and red colors are hitting their spectral spots immediately. Yellow is off in vector. Blue and cyan are somewhat desaturated. To correct this further research is needed to re-engineer the internal RED color space and also tests under different lighting conditions have to be proceeded.
[4]
Autodesk, Maya 2016, synColor, sRGB_to_CIEXYZ.ctf
[5]
ITU-R (2015) Recommendation ITU-R BT.709-6. 06/2015, Electronic Publication, Geneva, 2015, p. 3
[6]
Autodesk, Maya 2016, synColor, P3-D65_to_CIEXYZ.ctf
[7]
„Colorimetry“. CIE Publication (15:2004). 3rd Edition, CIE Central Bureau, Vienna
[8]
ITU-R (2011) Recommendation ITU-R BT.601-7. 03/2011, Electronic Publication, Geneva, 2015
[9]
ITU-R (2014) Recommendation ITU-R BT.2020-1. 06/2014, Electronic Publication, Geneva, 2015
[10]
J. Selan „Cinematic Color From Your Monitor to the Big Screen“, A VES Technology Committee White Paper, p. 19
[11]
ALEXA Log C Curve - Usage in VFX http://www.arri.com/camera/alexa/downloads/ last visit: 2015, September, 9th
Author Biographies Eberhard Hasche received his diploma in electro engeneering from the Technical University of Dresden (1976). Afterwards he studied double bass, composition and arranging at Hochschule für Musik „Carl Maria von Weber“ in Dresden (state examination 1989). At this time worked as theater musician and in the 1990s as trainer and technician for digital music production. Since 2003 professor for audio and video technology at Brandenburg University of Applied Sciences. Since then focused at image compositing (certified Nuke Trainer by The Foundry in 2012). Patrick Ingwer recieived his dipolma (2006) and M. Sc. (2009) from Brandenburg University of Applied Sciences. Worked as sound engineer, camera assistent and cameraman for German television ARD / RBB and currently as scientific assistant at Brandenburg University of Applied Sciences. The focus of his work is camera work, above all stereo3D, 3Dscanning and –processing. He publishes also albums with electronic music.
Figure 13. RED RGB Camera space interpreted as Arri Wide Gamut, (squares: RED Camera RGB, circles: Arri Wide Gamut color conversion applied)
References [1]
E. Hasche, P. Ingwer, „Game of Colors: Moderne Bewegtbildproduktion“, Heidelberg, Springer Vieweg, 2016, Fig. 2.18 (treated)
[2]
C. Poynton „DCT303: Advanced Digital Colour Theory“, Class 06, Online-Training, FXPHD, Sidney, 2014, www.fxphd.com
[3]
E. Hasche, P. Ingwer, „Game of Colors: Moderne Bewegtbildproduktion“, Heidelberg, Springer Vieweg, 2016, Fig. 1.14
Reiner Creutzburg received his Diploma in Math from the University of Rostock, Germany (1976). Since 1992 he is professor for Applied Informatics at the Brandenburg University of Applied Sciences in Brandenburg, Germany. He is member in the IEEE and SPIE and chairman of the Multimedia on Mobile Device Conference at the Electronic Imaging conferences since 2005. Frederick Laube was born in Berlin, Germany, in 1991. He received his B. Sc. degree in medical computer science from the Brandenburg University of Applied Sciences. He is currently finishing his M. Sc. degree in computer science and researched on several medical projects, including hyper spectral analysis and medical device development. His actual focus is set on a specialization in information security. Timo Sigwarth was born in Berlin, Germany, in 1992. He received the B. Sc. degree in medical computer science from the University of Applied Sciences, Brandenburg, in 2014. He is currently M. Sc. student in computer science at the University of Applied Science, Brandenburg. His research interests are in the field of medical computer science, particularly hyper spectral imagery and patient safety. His other interests are in the domain of information security.
IS&T International Symposium on Electronic Imaging 2016 Mobile Devices and Multimedia: Enabling Technologies, Algorithms, and Applications 2016
MOBMU-286.8
©2016 Society for Imaging Science and Technology DOI: 10.2352/ISSN.2470-1173.2016.7MOBMU-286
Appendix A
sRGB - to – CIE xy file: S001_L003_0101FZ_001.R3D r3d gamma space: half float linear
ISO: 250
nuke color space: default (linear) r3d color Camera RGB space:
RED Color
white: 3400k RED Color 2
RED Color 3
RED Color 4
Spectral Data
Patch
No
x
x
x
x
x
a1
1
0.3688
0.3522
0.4000
0.3731
0.3818
0.3626
0.3913
0.3676
0.3969
0.3702
0.4018
0.3720
a2
2
0.3619
0.3468
0.3866
0.3571
0.3710
0.3511
0.3792
0.3538
0.3826
0.3555
0.3920
0.3570
a3
3
0.2872
0.3028
0.2747
0.2841
0.2823
0.2934
0.2797
0.2891
0.2759
0.2855
0.2661
0.2876
a4
4
0.3366
0.3729
0.3692
0.4308
0.3574
0.4106
0.3615
0.4192
0.3643
0.4238
0.3373
0.4320
a5
5
0.3061
0.3032
0.2949
0.2805
0.2983
0.2904
0.2968
0.2863
0.2962
0.2815
0.2969
0.2792
a6
6
0.2812
0.3315
0.2777
0.3421
0.2845
0.3390
0.282
0.3403
0.2797
0.3413
0.2448
0.3344
b1
7
0.4161
0.3796
0.5077
0.4374
0.4617
0.4127
0.4946
0.4312
0.4958
0.4319
0.4877
0.4223
b2
8
0.2642
0.2597
0.2436
0.2198
0.2560
0.2412
0.2518
0.2336
0.2428
0.2218
0.2370
0.1990
b3
9
0.4135
0.3428
0.4631
0.3308
0.4270
0.3315
0.4529
0.3307
0.4575
0.332
0.4889
0.3438
b4
10
0.3361
0.2992
0.3255
0.2667
0.3230
0.2802
0.3253
0.2731
0.3279
0.2672
0.3548
0.2724
b5
11
0.3404
0.3915
0.3872
0.4883
0.3719
0.4552
0.3781
0.4676
0.3790
0.4708
0.3424
0.4700
b6
12
0.3983
0.3912
0.4785
0.4690
0.4476
0.4460
0.4706
0.4655
0.4705
0.4658
0.4545
0.4631
c1
13
0.2429
0.2357
0.2193
0.1925
0.2371
0.218
0.2314
0.2101
0.2197
0.1915
0.2097
0.1586
c2
14
0.3013
0.3777
0.3219
0.4496
0.3193
0.4257
0.3206
0.4330
0.3202
0.4385
0.2681
0.4449
c3
15
0.4426
0.3469
0.5200
0.3354
0.4670
0.3352
0.5083
0.3355
0.5142
0.3375
0.5551
0.3469
c4
16
0.3790
0.3953
0.4510
0.4875
0.4247
0.4584
0.4421
0.4787
0.442
0.4792
0.4198
0.4751
c5
17
0.3829
0.3152
0.3944
0.2786
0.3763
0.2898
0.3883
0.2822
0.3938
0.2788
0.4399
0.2902
c6
18
0.2505
0.2848
0.2353
0.2638
0.2500
0.2755
0.2465
0.2729
0.2377
0.2669
0.1951
0.2329
d1
19
0.3223
0.3378
0.3289
0.3459
0.3255
0.3424
0.3266
0.3440
0.3278
0.345
0.3243
0.3485
d2
20
0.3209
0.3363
0.326
0.3426
0.3233
0.3399
0.3240
0.3414
0.3253
0.3418
0.3208
0.3455
d3
21
0.3208
0.3366
0.3258
0.3434
0.3229
0.3404
0.3242
0.3417
0.3259
0.3420
0.3198
0.3445
d4
22
0.3216
0.3357
0.3269
0.3438
0.3237
0.3406
0.3261
0.3430
0.3190
0.3482
d5
23
0.3198
0.335
0.3229
0.3385
0.3212
0.3368
0.3229
0.3385
0.3229
0.3385
0.3188
0.3478
d6
24
0.3239
0.338
0.3235
0.3382
0.3188
0.3333
0.3235
0.3382
0.3235
0.3382
0.3229
0.3438
x
y
y
y
y
0.3252
0.3422
y
y
Table 5. Positions of the Macbeth color patches for the RED color spaces in the CIE xy-chromaticity diagram
IS&T International Symposium on Electronic Imaging 2016 Mobile Devices and Multimedia: Enabling Technologies, Algorithms, and Applications 2016
MOBMU-286.9