This document contains the draft version of the following paper: A. G. Banerjee, A. Balijepalli, S. K. Gupta and T. W. LeBrun. Generating Simplified Trapping Probability Models from Simulation of Optical Tweezers System. ASME Journal of Computing and Information Science in Engineering, 9(2), 2009 Readers are encouraged to get the official version from the journal’s web site or by contacting Prof. S.K. Gupta (
[email protected]).
Generating Simplified Trapping Probability Models from Simulation of Optical Tweezers System Ashis Gopal Banerjeea, Arvind Balijepallia,b, Satyandra K. Guptaa,1 , and Thomas W. LeBrunb a
Department of Mechanical Engineering and the Institute for Systems Research University of Maryland College Park, MD 20742, USA b Precision Engineering Division, Manufacturing Engineering Laboratory National Institute of Standards and Technology Gaithersburg, MD 20899, USA Abstract
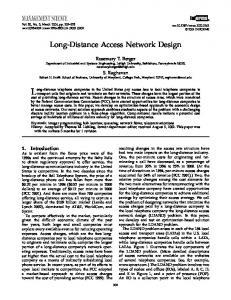
This paper presents a radial basis function based approach to generate simplified models to estimate the trapping probability in optical trapping experiments using offline simulations. The difference form of Langevin’s equation is used to perform physically accurate simulations of a particle under the influence of a trapping potential and is used to estimate trapping probabilities at discrete points in the parameter space. Gaussian radial basis functions combined with kd-tree based partitioning of the parameter space are then used to generate simplified models of trapping probability. We show that the proposed approach is computationally efficient in estimating the trapping probability and that the estimated probability using the simplified models is sufficiently close to the probability estimates from offline simulation data. 1. Introduction Simulations have emerged as a powerful tool in the traditional manufacturing and assembly areas to facilitate a wide variety of decision making. We expect simulations to play a major role in microscale assembly as well. However, simulations at the microscale pose new challenges due to the presence of a higher level of uncertainty due to random forces arising from Brownian motion of the components in the surrounding fluid. Furthermore, accurate simulations at the micro-scale can require time-steps smaller than a microsecond, which results in very long simulation runs. Hence, real-time simulations can be challenging to use for assembly planning. On the other hand, offline simulations can be used to generate data at discrete points in the parameter space, which can then be parameterized by computationally efficient simplified models. The work described in this paper investigates this approach using the optical tweezers as a case study. Light beams exert optical forces on objects. Using this property of light, optical tweezers (OT) have been developed to successfully trap and move nanoscale and microscale components of many different sizes and shapes [1-3]. Components can be simply released from optical traps by switching off the laser beam, thereby overcoming the challenges associated with contact based grippers at the microscale. Optical tweezers also provide a broad range of positioning and orienting capabilities to place components at desired locations in a fluid workspace (also referred to as the assembly cell in this paper). By utilizing the principle of synchronized time sharing, 1
E-mail address of corresponding author:
[email protected]
2
multiple laser beams in an OT system can perform several operations in parallel. These characteristics make optical tweezers a very promising technology for nano and microscale assemblies. The optical tweezers setup, currently being used in the Manufacturing Engineering Laboratory at the National Institute of Standards and Technology (NIST) [4] can be utilized for manipulating microspheres, nanowires, and cells. Other types of OT setup are described in [5]. Locations of components in the workspace can be determined using real-time imaging [6]. Autonomous OT operation requires real-time motion planning, which involves trapping the desired components and avoiding collisions with other components in the workspace. Information that is very useful in this context is the probability with which a component will be trapped in a spatial region close to a moving laser beam center, referred to as the trapping probability. Since many decisions need to be taken within a few milliseconds during real-time planning, the trapping probability estimation method must be extremely fast. As already discussed, trapping physics based simulations are computationally intensive. Currently, it takes few seconds to complete a single simulation run at any particular point in space. Moreover, several simulation runs are required at each point to average the noise, which results from the stochastic nature of the simulations. The raw data set generated is also expected to be very large in size, since it includes results from varying several parameters in a combinatorial manner. This paper describes a computational framework to perform offline microscale particle motion simulations and proposes a model simplification technique to represent the raw data in a compact form to estimate probabilities at any arbitrary point in the parameter space at run-time. 2. Framework for Simulating Sphere Behavior in Single Beam OT system We have chosen glass microspheres to illustrate our approach for the following reasons. Firstly, the physics of trapping glass spheres is well understood using a ray optics model and considerable literature exists, which discusses this force model and provides experimental validation [1,7,8]. Secondly, glass spheres can be reliably trapped and are often used as probes in many biological applications. A computational framework has been developed using the C++ programming language to simulate the physical behavior of a sphere in a single beam optical tweezers system. Laser beam be kept either stationary or moved with a constant speed in the horizontal plane or along the vertical axis. As shown in Fig. 1, our coordinate system is oriented such that the positive Z-axis points vertically downwards and coincides with the beam propagation direction. 2.1. Simulation of Sphere Motion A particle moving with a velocity V, which is a function of time, in fluid experiences a rapidly fluctuating force (due to a large number of collisions with the surrounding liquid molecules), as well as a hydrodynamic drag force. These forces are intimately related with each other and are modeled using Langevin’s equation given by Equation (1) [9]. dV (t ) γ ξ = − V (t ) + Γ (t ) (1) dt m m This equation assumes a fluid with viscosity η as a function of temperature T (η=1.002 x 10⁻³ Pa-
3
s at T=293 K for water). The drag coefficient γ for a spherical particle is given by Stokes’ law as 6πη Ra , where Ra is the radius of the spherical particle. The scaling constant ξ = 2γ K BT , where
KB is Boltzmann's constant, is obtained by imposing the requirements of the fluctuationdissipation theorem [9]. The presence of the stochastic force term Γ (t ) prevents direct analytical solution of this equation. Therefore, we first need to express Langevin's equation in finite difference form before proceeding to integrate it numerically. The difference form of this equation is given by Equation (2), where the stochastic term Γ (t ) is replaced with a standard B
normal distribution and the scaling constant includes the time-step δt. The external force term, FExt, allows us to include optical trapping, gravitational, and buoyancy forces. The latter two forces are constant for a sphere of a given size.
F V (t + δ t ) − V (t ) γ 1 2γ K BT N (0,1) + Ext = A(t + δ t ) = − V (t ) + m m δt δt m
(2)
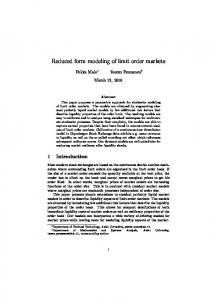
The optical trapping forces are calculated by numerically integrating the force equations given in [1]. We choose the power of the trapping laser, P to be 100 mW, with wavelength of the incident light, λ = 500 nm. The speed of light in free space is, c = 3x10⁸ m/s, the refractive index of water n1 =1.33, the refractive index of glass n2 =1.515 and the numerical aperture (NA) of the objective is 1.2. The density of glass is ρ s = 2600 kg/m3, that of water is ρ f = 1000 kg/m3, and the acceleration due to gravity g = 9.81 m/s2. Fig. 2 and 3 show the trapping forces along the axial and transverse directions for a 5.0 µm radius sphere that is trapped offset from the trap focus. Fig. 2 shows that for axial displacement the transverse forces are negligible and the axial forces have opposite signs above and below the trap focus. Moreover, the axial forces acting on a sphere are much stronger when the center of the sphere is above the trap focus rather than below it. Fig. 3 reveals that the trapping forces are much stronger for transverse displacements than for axial displacements and the transverse forces are anti-symmetric about the trap focus while the axial forces are symmetric. We find that the two Figures agree qualitatively and quantitatively with the data published in the literature [1,8]. In order to minimize the computation time, we generate a lookup table of the trapping forces with a uniform grid spacing of 0.5 µm for a given sphere size. Bilinear interpolation is then used to recover the optical trapping force at run time. Once we calculate the optical trapping forces, we include them in Equation (2) to calculate the acceleration, A(t + δt) at the end of the time-step, δt. We then use the velocity form of the second order Verlet integrator [10,11] to generate a list of the particle's position and velocity at the end of each time step. The integration time-step is chosen so that it is much smaller than the characteristic time-scale of the physical process. From Equation (1), we see that the m characteristic time-scale for this model is given by the relaxation time . Therefore, we choose
γ
the time-step such that δt
4%, then proceed to step 6; else output K and terminate. 6. Initialize current level (l) to be equal to 1, current parent node (nc) to be equal to NULL and current region (rc) as the entire parameter space. 7. While eRMS > 2% or eMax > 4% in rc and rc contains at least 2 data points, do i. Partition rc into two halves by a plane perpendicular to one of the axes such that each half-plane roughly contains the same number of points. Choice of this axis depends on the level l. If l belongs to the sequence {1, 5, …} select X-axis; if it is a part of the sequence {2, 6, …} select Y-axis; if it belongs to {3, 7, …} choose Z-axis and if it is a multiple of 4, then choose V-axis. Store the two half-planes as children nodes of the root of K. By pre-sorting the original data set D along each of the 4 dimensions, median coordinate along the corresponding dimension is used to split the current data set. ii. Increment l by 1 and update nc as the node corresponding to the current region and rc as the left child region. iii. Obtain a 24 resolution downsampled version from the points stored in rc by random selection. iv. Search whether any of the 4 parameters have a boundary value that is different from its minimum and maximum values. If yes, then add another randomly selected point from the neighboring region that shares a common partitioning hyperplane perpendicular to that parameter axis to the downsampled version. v. Fit a new Gaussian RBF to rc by calling the function FIT-SINGLE-RBF. vi. Estimate eRMS in approximating pi values in all the data points present in the left child region using the newly fitted RBF as well as all of its parent or ancestral RBFs spanning up to the root node from current level l. Similarly estimate eMax as well. 8. If eRMS < 2% and eMax < 4% in all the K regions, then output K and terminate. Else go to next step. 9. If node corresponding to rc is the left child of nc, then update rc as the right child region and go to step 7 iii and continue recursively inside the while loop. However, if the corresponding node is the right child of nc, then traverse backwards in K until we reach a node, such that the previously visited node is its left child. Store this node value as nc, update rc as the right child region of nc and set l as the tree level value of right child. Then go to step 7 iii. Function: FIT-SINGLE-RBF Input: A downsampled set of data points D/ present in a particular K node region, such that D / ⊆ D , and corresponding pi/ values.
12
Output: A newly constructed Gaussian RBF that approximates pi values for all the points present in D/ and updated pi/ values. Steps: 1. Perform a linear search to obtain the data point belonging to set D/ that has maximum residual error using the expression eMax = max pi − pi/ , ∀i = 1,..., n / , where n / is the
(
)
/
cardinality of D . Select this data point as the RBF center. If we are constructing the root RBF, then the geometric center corresponding to the mean value of each of the 4 parameters is selected. 2. Choose anisotropic widths for the Gaussian RBF using Equation (5). 3. Represent the RBF using Equation (4), with the constant term always set to zero and neglect the weight temporarily to obtain updated eRMS only for this downsampled data set D/. Updated eRMS is computed by modifying pi/ to incorporate the effect of the new RBF. Set the weight to be equal to eRMS . 4. Obtain the final value of weight by performing a least squares error fitting over the data set D/ using Equations (6) and (7). We found that maximum errors typically occur repetitively in two local zones – a) while fitting an RBF to a kd-tree region that has been formed by partitioning parent region based on velocity parameter and b) while fitting to a region created by partitioning based on z-coordinate value above the focal plane only when in-plane velocity is taken into account. The former scenario arises in all the 4 data sets due to the presence of only 5 discretization levels in the velocity parameters. However, the latter scenario occurs exclusively in odd numbered data sets due to the differential trapping behavior at various cross-sections explained using Fig. 7. The number of fitted RBFs (and hence the fitting time) depends on the size of data set, the size of the sphere as well as which velocity component is considered. In general, it is lower when the data set size is smaller and out-of-plane velocity is considered (lesser features observable in the contour plots as compared to the in-plane velocity cases). However, proportionately it is slightly higher for the smaller sized sphere as data points are spread apart. Table 1: Results from fitting Gaussian RBFs to 4 different simulation data sets Data set number 1 2 3 4
Number of data points (millions) 3.441 0.036 1.058 0.007
Number of fitted RBFs (thousands) 19.41 0.08 8.54 0.02
Fitting time (sec) 263 1.5 112 0.4
RMS error (%)
Maximum error (%)
1.75 1.97 1.76 1.98
3.97 3.23 3.98 3.25
3.3. Querying kd-Tree to Compute Estimated Trapping Probability Values
13
Once all the data sets have been modeled, it is straightforward to compute the estimated trapping probability value in real-time at any point in the parameter space. The point of interest need not coincide with any of the grid or data points because we may be interested in computing the probability value at any arbitrary location in the parameter space. Summing the values of all RBFs that overlap at the point of interest results in the probability estimation and the steps to perform this operation are outlined below in the algorithm OBTAIN-PROBABILITY-VALUE. Algorithm: OBTAIN-PROBABILITY-VALUE Input: • A point in local workspace with fully specified 4-tuple ( xint, yint , zint , vint ) at which we are •
interested in computing the trapping probability. kd-tree K obtained as output of the algorithm FIT-GAUSSIAN-RBFs
Output: • Estimated trapping probability value pest . Steps: 1. Initialize node (ne) and region (re) that are being currently explored as the root of K and the entire parameter space respectively. 2. Initialize a list of explored kd-tree nodes L as an empty set. 3. While pest is not computed or both children of ne have not been explored, do i. Insert node ne in list L. ii. Perform a linear search of all the data points stored in re to ascertain whether the given point lies inside re based on all the values specified in the 4-tuple. iii. If yes, then go to left child of ne (if one exists) and update ne and re accordingly. However, if ne is a leaf node, then carry out a backward traversal of K from ne to root node to identify all the parent RBFs and compute pest using Equation (4). iv. Else backtrack to nearest unexplored node in K (present in the set of nodes of K but not in L) as is done in any depth-first tree traversal, update ne and re and continue inside the loop recursively. 4. Output pest .
One thousand points are randomly chosen from each of the four parametric spaces such that none of the points coincides with any of the data points that were used to fit the Gaussian RBFs. Simulation experiment is then carried out 100 times at each such point and the trapping probability is estimated. The query algorithm is then used to compute trapping probabilities at all those selected points. The performance of the algorithm (and hence that of our overall fitting technique) in terms of both computational speed as well as accuracy is shown in Table 2. Timing data clearly reveals the significance of developing a simplified model and the impracticality of using offline simulation for real-time motion planning. As expected, the error measures are slightly higher than the corresponding numbers in Table 1 because those values are recorded based on grid points, whereas these points never coincide with any point that has been used to fit RBFs. However, none of the error values is markedly high which shows the efficacy of our fitting technique. 14
Table 2: Performance of query function to estimate trapping probability at 1000 randomly selected points in 4 parametric spaces Data set number 1 2 3 4
Overall simulation time (hours) 5.86 5.41 12.27 11.53
Overall query time (ms) 38 2.5 23 1.6
RMS error (%)
Maximum error (%)
1.81 2.04 1.83 2.05
4.09 3.34 4.22 3.40
In order to transport one or more spheres from a given initial location to target location, we need to develop intelligent motion planning strategies that can perform this operation without any manual intervention in the least possible time. This requires avoiding collisions with other spheres present in the workspace, which often results in losing the trapped particle. In the event of a collision with another particle in the workspace, the laser must be moved to a location where the particle is trapped again, so it can be moved to its final assembly location. Run-time knowledge of the trapping probability in a region around the beam focus at any permissible laser speed will help us quickly predict possible collisions. Once these spheres are identified, multiple traps can be switched on so that they can trap those spheres and either hold them stationary or move them away from the spheres that are being transported. Alternatively, the controller can command the currently operational laser beams to go along different paths at a faster or slower rate to circumvent the obstructing spheres. The trapping probability information allows us greater flexibility in positioning the trap and greatly improves the chances of successfully trapping a sphere anywhere in the workspace for any combination of position and velocity parameters. This in turn will help us develop more robust and efficient algorithms. 4. Conclusions
Since it is very challenging to use real-time simulations in automated planning applications, due to extremely long computation times, we have developed a systematic approach to generate simplified trapping probability models based upon offline simulation data. The main contributions of this work are summarized as follows: •
•
•
The trapping behavior of a dielectric sphere in a spatial region close to the focus of a stationary laser beam has been presented and quantified in terms of trapping probability contours, estimated by performing several simulations across all parameters of interest, namely position and velocity. The trapping behavior of a microsphere trapped in a moving laser beam is also studied. Uniform motion of the trap either along the horizontal plane or along the beam axis are considered separately and trapping probability contours from each case reveal interesting trends that show distortions probability plots from the static case. A model simplification technique for fast and accurate online computation of trapping probability estimates at any arbitrary point in the 3D space and for any value of laser speed 15
using Gaussian radial basis functions has been developed. This is a very useful tool in automated path planning as it enables us to efficiently maneuver components across a workspace in real-time while avoiding potential obstacles. The trapping force models used in this work are based on a geometric optics approach and are valid for dielectric microspheres ranging in radius between 1 µm and 10 µm. However, the model simplification techniques presented in this work are very flexible and are generally applicable to other trapping force models as well. As part of future work, we plan to utilize these trapping probability estimation methods to develop real-time motion planning algorithms not just for microspheres, but also for metallic nanoparticles as well as nanowires by substituting appropriate force models for these components. Acknowledgements. This work was supported in part by the Center for Nano Manufacturing and Metrology, a joint venture between the University of Maryland and the National Institute of Standards and Technology. References
[1] Ashkin, A., 1992, “Forces of a Single-Beam Gradient Laser Trap on a Dielectric Sphere in the Ray Optics Regime,” Biophysical Journal, 61(2), pp. 569-582. [2] Ashkin, A., 2000, “History of Optical Trapping and Manipulation of Small-Neutral Particle, Atoms, and Molecules,” IEEE Journal of Selected Topics in Quantum Electronics, 6(6), pp. 841856. [3] Svoboda, K., Block, S., 1994, “Optical Trapping of Metallic Rayleigh Particles,” Optics Letters, 19(13), pp. 930-932. [4] Balijepalli, A., LeBrun, T., Gagnon, C., Lee, Y. G., Dagalakis, N., 2005, “A Modular System Architecture for Agile Assembly of Nanocomponents using Optical Tweezers,” In Proceedings of the 2005 SPIE Conference on Optics and Photonics, San Diego, CA, 5908. [5] Grier, D. G., 2003, “A Revolution in Optical Manipulation,” Nature, 424(6950), pp. 810-816. [6] Peng, T., Balijepalli, A., Gupta, S. K., LeBrun, T., 2007, “Algorithms for On-Line Monitoring of Micro Spheres in an Optical Tweezers-Based Assembly Cell,” Journal of Computing and Information Science in Engineering, 7(4), pp. 334-338. [7] Wright, W. H., Sonek, G. J., 1993, “Radiation Trapping Forces on Microspheres with Optical Tweezers,” Applied Physics Letters, 63(6), pp. 715-717. [8] Wright, W. H., Sonek, G. J., Berns, M. W., 1994, “Parametric Study of the Forces on Microspheres Held by Optical Tweezers,” Applied Optics, 33(9), pp. 1735-1748. [9] Weissbluth, M., 1989, Photon-Atom Interactions, Academic Press, Boston, MA.
16
[10] Allen, M. P., Tildesley, D. J., 1987, Computer Simulation of Liquids, Clarendon Press, New York, NY. [11] Swope, W. C., Andersen, H. C., Berens, P. H., Wilson, K. R. A Computer Simulation Method for the Calculation of Equilibrium Constants for the Formation of Physical Clusters of Molecules: Application to Small Water Clusters. The Journal of Chemical Physics, 76(1):637-49, 1982. [12] Montgomery, D. C, Runger, G. C., 1994, Applied Statistics and Probability for Engineers, John Wiley & Sons, Inc., New York, NY. [13] Chivate, P. N., Jablokow, A. G., 1995, “Review of Surface Representation and Fitting for Reverse Engineering,” Computer Integrated Manufacturing Systems, 8(3), pp. 193-204. [14] Amidror, I., 2002, “Scattered Data Interpolation Methods for Electronic Imaging Systems: a Survey,” Journal of Electronic Imaging, 11(2), pp. 157-176. [15] Juba, D., Varshney, A., 2007, “Modelling and Rendering Large Volume Data with Gaussian Radial Basis Functions,” Technical Report, Number UMIACS-TR-2007-22, University of Maryland, College Park, MD. [16] Weiler, M., Botchen, R., Stegmaier, S., Ertl, T., Jang, Y., Ebert, D. S., Gaither, K. P., 2005, “Hardware-Assisted Feature Analysis and Visualization of Procedurally Encoded Multifield Volumetric Data,” IEEE Computer Graphics and Applications, 25(5), pp. 72-81.
17
Fig. 1. Schematic illustration of simulation set-up
Fig. 2. Axial and transverse force components when sphere center is displaced along the laser beam axis from the focus
Fig. 3. Axial and transverse force components when sphere center is displaced along the transverse axis from the laser beam focus 18
Fig. 4. Trajectory of sphere that is trapped by a stationary laser beam
19
Fig. 5. Estimated trapping probability contours for 7.5 µm radius sphere under influence of a stationary laser beam
Fig. 6. Estimated trapping probability contours for 7.5 µm radius sphere in Y-Z plane under influence of a laser beam moving along +Y-axis with a speed of 0.352 µm/ms
20
Fig. 7. Estimated trapping probability contours for 7.5 µm radius sphere in X-Y plane under influence of a laser beam moving along +Y-axis with a speed of 0.352 µm/ms
21
Fig. 8. Estimated trapping probability contours for 7.5 µm radius sphere in Y-Z plane under influence of a laser beam moving along -Z-axis with a speed of 0.176 µm/ms
22