focused on understanding how individuals with color vision deficiencies use color-coded information ..... use should be limited because it produces tunnel vision,.
DOT/FAA/AM-06/6 Office of Aerospace Medicine Washington, DC 20591
Reexamination of Color Vision Standards, Part II. A Computational Method to Assess the Effect of Color Deficiencies in Using ATC Displays Jing Xing David J. Schroeder Civil Aerospace Medical Institute Federal Aviation Administration Oklahoma City, OK 73125
March 2006
Final Report
NOTICE This document is disseminated under the sponsorship of the U.S. Department of Transportation in the interest of information exchange. The United States Government assumes no liability for the contents thereof. ___________ This publication and all Office of Aerospace Medicine technical reports are available in full-text from the Civil Aerospace Medical Institute’s publications Web site: www.faa.gov/library/reports/medical/oamtechreports/index.cfm
Technical Report Documentation Page 1. Report No.
2. Government Accession No.
3. Recipient's Catalog No.
DOT/FAA/AM-06/6 4. Title and Subtitle
5. Report Date
Reexamination of Color Vision Standards, Part II. A Computational Method to Assess the Effect of Color Deficiencies in Using ATC Displays
March 2006
7. Author(s)
8. Performing Organization Report No.
6. Performing Organization Code
Xing J, Schroeder DJ 9. Performing Organization Name and Address
10. Work Unit No. (TRAIS)
FAA Civil Aerospace Medical Institute P.O. Box 25082 Oklahoma City, OK 73125
11. Contract or Grant No.
12. Sponsoring Agency name and Address
13. Type of Report and Period Covered
Office of Aerospace Medicine Federal Aviation Administration 800 Independence Ave., S.W. Washington, DC 20591
14. Sponsoring Agency Code
15. Supplemental Notes
Work was accomplished under approved task AM-HRRD522. 16. Abstract
The previous study showed that many colors were used in air traffic control displays. We also found that colors were used mainly for three purposes: capturing controllers’ immediate attention, identifying targets, and segmenting information. This report is a continuing effort to reexamine the FAA’s color vision standards, focused on understanding how individuals with color vision deficiencies use color-coded information. We first reviewed and synthesized the literature about the effectiveness of color relative to achromatic visual cues. Next, we developed several algorithms to assess the effects of color for individuals with color vision deficiencies. Using a computational algorithm that simulates how color deficient individuals perceive color, we were able to calculate the effectiveness of color in task performance. By considering together the effectiveness of redundant visual cues and the perception of those with color vision deficiencies, we provide a method to assess the potential effects of color deficiencies in using color displays.
17. Key Words
18. Distribution Statement
Document is available to the public through the Defense Technical Information Center, Ft. Belvior, VA 22060; and the National Technical Information Service, Springfield, VA 22161
Air Traffic Control, Displays, Color Vision Deficiency, Design, Redundant Cue 19. Security Classif. (of this report)
Unclassified Form DOT F 1700.7
20. Security Classif. (of this page)
Unclassified
(8-72)
21. No. of Pages
22. Price
18 Reproduction of completed page authorized
�
ACKNOWLEDGMENTS We thank Drs. Carol Manning and Larry Bailey for their valuable comments on the manuscript. We also express our appreciation of the support from Mr. Dino Piccione and Stephen Cooley. We thank Janine King for her enormous help in editing an early version of the manuscript. We appreciate the FAA reviewers and editors whose efforts greatly improved this report.
iii
Reexamination of Color Vision Standards, Part II. A Computational Method to Assess the Effect of Color Deficiencies in Using ATC Displays INTRODUCTION
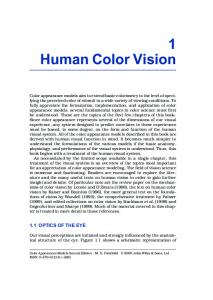
to form the observer’s perception of the image. Figure 1 shows a simulation sample obtained from the Vischeck program. The figure presents the images seen by deuertanopes and protanopes after transformation of each pixel of the original image. Figure 1 indicates that most colors appear darker and less saturated for CDs. For example, red and green appear dark yellowish. Overall, CDs generally
People with normal color vision have three types of cone receptors in their retinas to perceive color. Each type of cone receptors contains a photopigment that responds to a restricted range of the light spectrum corresponding to red, green, or blue. Color deficient individual (CD) is a term denoted to a person who has abnormal or incomplete cone receptors. Compared to color-normal individuals (CN), CDs perceive a reduced range of color because of the absence of some types of cones. Roughly 8-10% of all males are CDs, while very few females are CDs. There are three types of CDs. 1) Anomalous trichromats have all three types of cones but one cone type is rare. Such individuals can see all color categories but have difficulty in discriminating color that a normal vision person can easily distinguish. 2) Dichromats have only two primary cones; one type is missing. Dichromats are further classified into three types: protanope, deuteranope, and tritanope. Protanopes and deuteranopes constitute the majority of CD populations. They have red-green color deficiencies and see only yellow and blue. The tritanope is analogously blue-yellow color deficient. 3) Monochromats have no cones and therefore no color vision at all. They are very rare, about one in ten million people. Given that color displays are being widely used in many professions including air traffic control (ATC), it is important to understand how CDs perceive colors. Brettel, Vienot, and Mollon proposed an algorithm to simulate for normal observers the appearance of a color image for individuals with dichromatic types of color deficiencies (Brettel, Vienot, & Mollon, 1997; Vienot, Brettel, & Mollon, 1999). Inspired by Brettel’s work, Dougherty developed a computer program, called Vis check, to simulate the entire color process of human vision (see www.vischeck.com for reference). The Vischeck model can be divided into three stages. The first stage includes the physical properties of display devices, ambient lighting, and physiological factors. The second stage describes the transformation of an optical image on the retina into a neural representation of that image. This stage used Brettel’s algorithm to model the effects of dichromats. The final stage is a model of human cortical vision. This stage includes mechanisms in which color, spatial patterns, and motion are combined and processed in the visual cortex
Figure 1: An example of colordeficit simulation produced by the Visckeck program. The top image shows some colorful hats seen by color-normal observers; the middle is the image as seen by a person with deuteranopia; the bottom is the image as seen by a person with protanopia. �
can see colors to a certain extent, but they have trouble distinguishing between some shades of red and green or blue and yellow. They also cannot differentiate some colors that are perceptually close to each other. Our previous study (Xing & Schroeder, 2005) demonstrated that the color vision standards currently used by the FAA have allowed certain types of CDs to pass the practical color vision screening tests for air traffic control specialists. However, in the past five years there has been an increased use of color in displays being introduced in ATC facilities. Controllers with color vision deficiencies may experience difficulties in using color-coded information appropriately, because color deficiency was not a consideration at the ATC display design. Simulation programs such as Vischeck provide a means to explore how the ATC displays would appear to CDs. However, not only do we need to know how colors appear to CDs, but we also need to determine how reduced color perception affects task performance. Our previous study has shown that colors on ATC displays are used for three purposes: 1) to capture attention; salient colors are often chosen to encode information that needs to be attended to immediately, such as an alert or emergency; 2) to identify categories of information so that searching for specific information in a complex image can be done more effectively; in this case, each color is associated with a distinctive meaning; 3) to segment complex images in a display into distinctive groups so that information belonging to the same category can be organized together. In this application, color does not have inherent meanings. Therefore, we use three terms to refer to color-related tasks throughout this report: attention, identification, and segmentation. We synthesized the literature for studies on the use of color in these types of tasks. Using the experimental data in the literature as criteria, we were able to assess the potential effects of color use for CDs. Our previous observations of ATC displays revealed that color was often used along with achromatic redundant cues (ibid). Presumably, redundant cues would allow CDs to perform the tasks. However, redundant cues may not be as effective as colors in supporting task performance. Therefore, when assessing the effects of color vision deficiencies on task performance, we have to consider the effectiveness of redundant cues, together with the reduced color perception of CDs. In this report, we analyzed the effects of achromatic cues relative to colors, and we developed a set of computational algorithms to compare the effectiveness of colors for CDs versus CNs. Furthermore, we applied the algorithms to the general use of color in ATC displays. The results are presented in several look-up tables that can easily be used to assess the effects of color vision deficiencies for a given display.
This report has two major parts: 1) rationales for the effectiveness of color based on research data in the literature; and 2) algorithms we developed to assess the effects of colors for CDs. We also discuss the potential applications and limitations of the algorithms in evaluating ATC color displays with respect to CDs.
RESULTS Rationale for the usefulness of color This section synthesizes the research literature to provide a rationale for the effectiveness of color in displays. Such a rationale is the basis for the algorithms described in the following section. Given that colors in ATC displays are used mainly for three types of tasks: Attention, Identification, and Segmentation, this section is focused on visual studies in which subjects performed tasks involving those activities. In addition, we also reviewed studies of text readability associated with colors. Reading text from displays is an important part of ATC tasks. Even though the use of colors in a display is not designed to influence text readability, applying color to text nevertheless affects readability. Color can be specified by two factors: luminance and chromaticity (hue). Our literature review was intended to elucidate the relationship between the effects of color use and color specifications. In particular, we sought to determine the threshold point for color specifications, below which color is no longer effective for a given purpose, and the saturation point, beyond which the effectiveness of color does not increase further. Since these critical points might vary with experimental conditions, we relied more on studies conducted using complex images on large displays (mimicking the situations of ATC). Introduction to color systems A color system refers to the mathematical description of colors. A full description of color includes two factors: chromaticity (hue) and luminance (brightness). There are many kinds of color systems developed for different purposes. Here, we briefly introduced several systems used in this report. As mentioned earlier, human retinas have three types of cones that are sensitive to colors. Each type is sensitive to a special region of the light spectrum (Long, Medium, and Short). Thus, a cone is referred to as L-, M-, or Scone, each for its sensitive region of the light spectrum. An L-cone has its peak sensitivity to red; an M-cone is most sensitive to green, and an S-cone spreads over the blue region of the light spectrum. The excitation of each type is denoted with L, M, and S. Therefore, a color can be specified with these three values of cone excitation. �
Attention Critical information presented on ATC displays needs to be detected immediately without serial searching through a display. Therefore, the target should become obvious immediately to capture an observer’s attention. This phenomenon is called “pop-out.” Treisman and Gelade (1980) found that a number of visual attributes could induce pop-out and by doing so allow information to be extracted in parallel across a large visual field. By parallel, we mean that the amount of visual stimuli on a display has little effect on the time and accuracy of target detection. Pop-out of color-coded information is extremely efficient and desirable at display design (Treisman & Gelade, 1980). Colors help when targets need to be detected in large displays. By popping out, targets located in the peripheral visual field can be brought quickly to the fovea for detailed inspection. Christ (1975) also confirmed that introducing colors on large displays helps detection because information could be processed in parallel. Many studies have been devoted to the effectiveness of visual attributes in drawing attention. Christ (1975) compared the data in the literature and concluded that color was the most effective cue to draw attention in complex scenes, followed by luminance and shape. On the other hand, Banks and Weimer (1992) examined subjective evaluations using visual features to highlight alert messages. Their results indicated that flashing was ranked as the top choice, followed by brightness (luminance), color, and then attributes such as size and shape. While flashing is most effective in drawing attention, its use should be limited because it produces tunnel vision, in which the observer focuses on the target and ignores other information in the visual field. A number of studies have demonstrated that visual conspicuity draws attention instantly. For static visual stimuli, the conspicuity of a target is mainly determined by two factors: color and luminance differences between the target and other stimuli in the visual field (referred to as distractors). Johnson, Liao, and Granada (2002) reported that visual conspicuity of aircraft symbols increased linearly with the target luminance. Their results suggested that there was no saturation point for the effectiveness of luminance in drawing attention. Wyszecki and Fielder (1971a) reported that the threshold luminance difference for Attention is about 75 times the threshold at which the target and distractors could be discriminated. Nagy and Sanchez (1992) found that the threshold luminance difference varied with the size of displays and stimuli. They demonstrated that, if the luminance difference between the target and distractors was larger than ~10 cd/cm2 on a small display field and ~20 cd/ cm2 for small stimuli (~1.5cm, 0.5 degree) on
The proportion of stimulated L-, M-, and S-cones determines the chromaticity of a color, while the luminance of a color is the sum of excitation of all cones, i.e., (L+M+S). This system is best suitable to describe color deficiencies because certain types of cones are absent in CDs (Wandell, 1995). While the LMS systems describe the activity in the retinas induced by a color, its variables cannot be measured directly. On the other hand, The International Committee of Illumination (CIE) defined color chromaticity coordinates to describe color perception. In this definition, a color can be specified by three parameters: L, x, and y, where L is the luminance of a color and x and y determine the chromaticity. A colorimeter can measure the Lxy values of a surface. Because of its ease of measurement and independence from observers, CIE chromaticity is the most widely used color system. However, one of the greatest disadvantages of the CIE chromaticity systems is that visually they are not equally spaced. Thus, distortions occur in attempting to relate perceived colors to locations of the CIE chromaticity diagram. Based on the Lxy systems, the CIE adopted the Lu´v´ systems that were more nearly uniformly spaced with respect to color perception. Therefore, the chromaticity difference between two colors can be ½ computed as ((∆u´) 2 + (∆v´) 2) . The values of u´ and v´ can be computed from x and y through two non-linear equations. A computer display generates a color through three phosphor channels: red, green, and blue. The amount of phosphors emitted from each channel is specified with the digital value of the channel: r, g, or b, each for red, green, or blue phosphors. Computer programmers use these numbers to specify a color on displays. For example, rgb values of (255, 0, 0) are for red and (255, 255, 0) are for yellow. The relationship between the rgb and Lxy systems can be easily specified with a nonlinear transformation and a linear matrix transformation. The process of determining the transformations is called color calibration. Besides the above color systems, there are many other mathematic descriptions of color. The good news is that these color systems can be transformed from one to another by a set of mathematical equations. In this report, we used the CIE uniform chromaticity systems (Lu´v´) to describe color differences. While the results in the literature were expressed in different systems, we converted those data into Lu´v´ specifications. Since the transformation from rgb values to other color systems requires calibration of the monitor, we adopted the default monitor calibration parameters used in the Vischeck program, as shown in the Appendix A. �
a large display field, observers could detect the target instantly without searching among distractors. They also showed that there was no advantage for combining a luminance difference with a chromaticity difference when the target was brighter than the distractors. On the other hand, a target dimmer than distractors could hardly capture attention. In that situation, an additional chromaticity difference might be helpful. Much effort has been made to determine the threshold chromaticity difference between a target and distractors in attention capture. Carter and Carter (1981) concluded that the difference should be at least 7~13 times the color-discrimination threshold (the one determined by Wyszecki & Fielder, 1971a,b). Nagy and his colleagues performed a series of studies to determine the threshold difference by varying display size, stimulus size, and stimulus location in the visual field (Nagy & Sanchez, 1990; Nagy, Sanchez, & Hughes, 1990). The situation that was most similar to ATC displays was the combination of small stimuli (~1.5cm, 0.5 degree) and large display fields. Under these conditions, they estimated that the threshold chromaticity difference is about 20~60 times the color discrimination threshold. Given that the Wyszecki-Fielder threshold is typically taken as 0.004 in the CIE uniform chromaticity systems, 60 times that threshold would be 0.24.
of a known location on an aircraft cockpit display unit. Their results demonstrated that color-coding was not more helpful than achromatic coding. Also, Kahneman and Treisman (1984) found that attending to a red-colored letter only facilitated attention to redness but not to the meaning of the letter. Thus, they claimed that color helped search tasks but not identification. Nevertheless, the majority of studies have demonstrated that color is the most effective attribute for labeling information in visual displays. In particular, for large displays with complex images, results in the literature are generally consistent about the superior role of color to achromatic cues (Christ, 1975). In a large display, a colored target can be found more quickly than achromatic targets, and the performance difference increases as the display size increases. When used to identify information such as aircraft shapes, geometric shapes, and alphanumeric signs, colors were significantly better (in terms of accuracy) than size, brightness, shape, and text. Christ further indicated that the identification of colors became increasingly superior to achromatic features as the difficulty of identifying achromatic features increased. Moreover, colors became increasingly more effective as recall was delayed. Little research has been devoted to determining the threshold and saturation points of the effectiveness of color for identification. However, considerable data have been accumulated about color naming. Given that a task of using color for identification is essentially the task of color naming, we could determine the critical points based on color-naming studies. Berlin and Kay (1969) suggested that there might be only 11 categories of basic colors; each associated with a well-learned name and possibly unique physiological substrates. The 11 categories were: red, green, yellow, blue, purple, brown, orange, pink, and three achromatic names: black, white, and gray. Boynton and Olson (1990) confirmed this contention. They found that basic colors were maximally segregated in the color space. Boynton and Olson further showed that basic colors were superior to other colors in identification tasks because targets were identified more quickly and reliably. However, Smallman and Boynton (1990) found that the efficiency of color in identification is largely determined by color differences. They demonstrated that a set of nonbasic colors with the same color differences as the basic colors had about the same effect in identifying targets, even though basic colors still had some superiority when the identification tasks involved complex scenes. The threshold point for color in identification can be inferred from the color-naming threshold, which has been well examined by Boynton and his colleagues. Boynton, MacLaury, and Uchikawa (1989) reported that the color-naming threshold was about nine times the
Identification Color is often used denotatively to identify an object. Tasks using color for identification essentially involve color naming, in which observers can associate targets with specific color names in their mental processing. For example, colors may be used to identify different aircraft on ATC displays. In real life, identification of two stimuli is usually performed at separate spatial locations and times. Typically, an observer remembers the color by its name and then identifies the target by the color name. Color has been shown to be the most effective visual cue for identification tasks (Young & Nagy, 2003). On the other hand, several studies have demonstrated that labeling information with different levels of luminance did not help much in tasks involving quickly identifying targets, especially when memory was required (Sachtler & Zaidi, 1992). There exist some controversial debates about the effects of color in identification tasks. Color and shapes are processed independently in the brain. When both codes are present, color is generally dealt with first, which makes sense in a search task but may not be the optimum strategy when the target location is known. Therefore, it was not a surprise that some studies suggested that color has little advantage in identification. For example, Luder and Barber (1984) asked subjects to identify the status �
color discrimination threshold. In a different approach, Poirson and Wandell (1993) found that the threshold for identifying a target by the color name is about seven times the color discrimination threshold. Poirson and Wandell asked subjects to detect a color target in a set of briefly presented objects. This kind of identification task was easier because subjects were asked only to identify one color at a time, while air traffic controllers often need to associate several colors with different types of information in ATC displays. Thus, the threshold determined by Boynton et al. (1989) is more appropriate to assess the effectiveness of color in ATC displays. We took nine times the discrimination threshold as the critical threshold point for identification tasks, which is 9×0.004=0.036. On the other hand, the differences between basic colors are at least 40 times the discrimination threshold; therefore, we took the color difference of 40x0.004 = 0.16 as the saturation point for Identification tasks.
and symbols. Thus, we should review the literature in texture segmentation for the threshold points. The luminance discrimination threshold has been well studied. The ratio between the threshold and the baseline luminance of an object is a constant for most of the luminance range produced by a display. The ratio is about 0.05 for uniform stimulus areas placed side-byside. McIlhagga, Hine, Cole, and Snyder (1990) reported that the ratio for texture fields is about 0.15~0.2. Two texture regions with a luminance difference above the threshold ratio can be reliably segmented. Hence, we took 0.2 as the critical luminance threshold point for segmentation. As for color, the typical color discrimination threshold is about 0.004 for uniform stimuli placed side-by-side. The threshold increases as the stimulus areas become less uniform. Industries typically use three times the standard color discrimination threshold for texture discrimination. We thus took 3×0.004 as the threshold point of chromaticity difference for segmentation. There is little data about the saturation point for segmentation in the literature. However, it is reasonable to assume that the effectiveness of color in segmentation increases with chromaticity difference.
Segmentation When viewing a complex scene, the human visual system first organizes the scene into meaningful objects. To appreciate what and where particular objects are present, the visual input is organized by a filtering procedure that has been termed segmentation (Pinker, 1984). Segmentation becomes crucial when dealing with an automation system that is usually characterized by a cluttered display and varying task demands. Since color is processed separately from achromatic features by the visual system, it is one of the ways to segment a display into separate regions. Segmentation is based on uniformity and consistency. An area composed of uniform elements can be segmented easily from its surround. Hence, in a real display, color is usually more effective than form cues for segmentation because form cues are used with explicit meaning. Nothdurft (1993) compared the effectiveness of visual cues that involved texture segmentation. He reported that, while color and luminance differences were both effective in producing regional segmentation and figure-ground organization, color information is dealt with first before achromatic cues. On the other hand, the experiment performed by Yamagishi and Melara (2001) indicated that luminance information was more effective than color to extract boundary representations, while chromaticity information is more effective in regional segmentation. In the ideal situation, where the objects are homogeneous visual stimuli, the threshold color differences for segmentation are the same as the discrimination thresholds. However, completely homogeneous stimuli carry little information. That is a rare situation in ATC displays, which are typically composed of various text
Text readability ATC tasks involve considerable text reading because text comprises a relatively large part of the materials on displays. Text readability is defined as the property that permits an observer to read text easily on a screen irrespective of their meanings. In visual displays, readability is measured as the time required to find and read given text, or the number of words read per minute. Many experiments have demonstrated that text readability is predominately determined by the luminance contrast between the text and its background. Luminance contrast of text can be defined in several ways. Among those, Michelson’s contrast definition is most widely used. It is defined as follows: C=(Lt-Lb) / (Lt+Lb) Where Lt is text luminance and Lb is background luminance. The contrast C varies between 0 and 1. The effect of color in text reading is not as clear as that of luminance. Knoblauch, Arditi, and Szlyk (1991) examined the role of color in text reading. They found that, when luminance contrast is greater than 0.1, reading performance was unaffected by the presence of chromatic contrast over a range of character sizes varying 30-fold; only when luminance contrast was reduced to near the threshold for reading did chromatic contrast sustain reading. Ojanpaa and Näsänen (2003) measured the reading rate at different luminance contrasts while keeping the �
color contrast constant. Interestingly, the results showed that reading rate decreased strongly when the luminance contrast approached zero. Thus moderate color contrast was not sufficient for effective visual search or reading when the luminance contrast was small. These findings may be because at high spatial frequencies, such as text, contrast sensitivity for pure color information is considerably lower than for luminance information. Other studies seem to suggest a stronger role of color in reading. Pastor (1990) evaluated displayed colors by having subjects rank text readability. The results showed that color saturation had the most important influence on ratings. A similar experiment performed by Van Nes (1986) also demonstrated that white, yellow, cyan, and green yielded higher rating scores than magenta, blue, and red. In addition, Cowan and Ware (1987) reported that high brightness colors received high rankings for readability. However, all these results can be explained by the fact that the colors yielding great readability were the ones with high luminance. Legge and his colleagues have performed a series of quantitative studies on text readability (Legge, Parish, Luebker, & Wurm, 1990). They measured reading speed as a function of luminance contrast, color contrast, or both. They found that reading speed decreased by approximately a factor of two when text contrast (Michelson contrast) decreased from 100% to 20%. This result implied that there was no saturation point in the effect of luminance contrast on reading. However, below 20% reading speed slowed much more rapidly and was significantly below the normal reading speed. Thus, a text contrast of 20% can be referred to as the threshold point for reading. This threshold choice is supported by other studies. For example, Scharff and Ahumada (2002) measured text readability as the time needed to search and read given text. The results indicated that text readability increased with contrast and deteriorated significantly for contrasts below 20~30%. In addition, Travis, Bowles, Seton, and Peppe (1990) suggested that luminance contrast should be about 50% for text reading on displays, to stay away from the threshold contrast for reading.
If a task was to identify one attribute as the critical target feature and allowed one or more attributes to vary uncorrelatedly, that was also non-redundant. Color and redundant cues may have different efficiencies in various color-related tasks. For example, a flashing signal is more effective than colors in drawing attention because the majority of the visual field is more sensitive to dynamic signals than to static ones. Among static visual features, while colors have been shown to be the most effective cue for attention and target search (Young & Nagy, 2003), a number of achromatic visual features, such as luminance, shape, and texture orientation, can also produce pop-out (Treisman & Souther, 1985). Another cue is the spatial location, provided that the information always appears at the same location, and one can easily remember it. Yantis and Jonides (1996) have demonstrated that sudden onset of a target at a known location captured attention. Christ (1975) summarized the data in the literature about the effectiveness of colors relative to achromatic attributes. He calculated a difference score, which was the difference between performance with color in displays and without color in displays divided by the results obtained without colors. The maximum scores reported in the literature for Identification tasks were 202% for geometric shape, 176% for size, 62% for other shapes, 46% letters, and 19% for digits. The scores for Attention tasks were 53% for geometric shapes and 69% for other shapes. The positive values of these scores indicated that color was the most effective cue in both types of tasks. The effectiveness of achromatic cues relative to each other could also be inferred from the differences in the scores. Algorithms to assess the effectiveness of colorcoding and achromatic redundant cues for CDs The goal of this section was to develop a computational method to assess how CDs use color-coded information relative to CNs. We approached the goal through the following steps: 1. Assess the effectiveness of color for CDs relative to CNs. This could be done by combining a dichromate simulation program and the experimental results of effectiveness of color reviewed in the previous section. While the effectiveness of color might vary continuously with color parameters in most situations, we classified the results of comparisons into three levels: “E” referred to situations where color was equal to or more effective for CDs than for CNs; “L” represented situations where color was less effective for CDs than for CNs; and “NE” meant that color was not effective for CDs. In addition, we used “NA” to denote the “not applicable” situation where color was not even effective for CNs. No comparison of color effects between CDs
Redundant cues When achromatic visual features are used in addition to colors to code information, those features are considered as redundant cues. Christ (1975) defined redundant cue as follows: “Target attributes were considered to be redundant if the target could be identified either in terms of colors or achromatic visual features.” By this definition, the color and redundant cues of a target should be perfectly correlated. Target attributes were considered to be non-redundant if the targets could be identified or located only in terms of their color or achromatic features. �
3. Compute color and luminance differences between the target and background, denoted as ∆Ctb and ∆Ltb; color difference is computed as ∆Ctb = ((∆u´)2 ½ + (∆v´)2) ; 4. Compute color and luminance differences between the target and distractors, denoted as ∆Ctd and ∆Ltd; 5. Compute color and luminance differences between the target and distractors / background for CNs; 6. Compare the differences with the threshold and saturation points to determine the effects of color for CDs: If ∆Ctb < 0.24 and ∆Ltb < 20 for CNs, then the effect is “NA” If ∆Ctd < 0.24 and ∆Ltd < 20 for CNs, then the effect is “NA” If ∆Ctb < 0.24 and ∆Ltb < 20 for CDs, then the effect is “NE” If ∆Ctd < 0.24 and ∆Ltd < 20 for CDs, then the effect is “NE” Else, If both ∆Ltb and ∆Ltd for CDs are equal to or greater than those for CNs, then the effect is “E” If ∆Ctb and ∆Ctd for CDs are equal to or greater than those for CNs, then the effect is “E” If ∆Ltb or ∆Ltd is less for CDs than for CNs, then the effect is “L” If ∆Ctb or ∆Ctd is less for CDs than for CNs, then the effect is “L”
and CNs was made for “NA” situations. 2. Assess the effectiveness of achromatic redundant cues. We also used a three-level scale, E, L, and NE, to classify the effects of color relative to achromatic cues. Once again, “NA” represented the situation where color was not effective for CDs. 3. The usefulness of color for CDs depended on both types of effectiveness. The overall usefulness was determined by a “winner-takes-all” rule, i.e., by the higher level of the two. For example, if the effect of color is “L” while the effect of redundant cues is “E,” the overall effect is “E.” It means that CDs, with the aid of redundant cues, could perform the color-related task equally well as did CNs. We could use either the algorithm developed by Brettel et al. (1997) or Dougherty’s Vischeck program to compute the perceived color for CDs. The two methods are equivalent for simple color stimuli. For complex scenes, the Vischeck program simulates color perception more accurately because it takes spatial interaction of color into consideration. Both methods allow simulations of deuteranopia, protanopia, and tritanopia. Since tritanopia is rare, we do not include this type in our analysis below. We analyzed the effects of color for deuteranopes and protanopes, respectively, and then combined the effects as the final assessment for CDs. The combination rule was opposite of “winner-takes-all,” i.e., the final effectiveness of color for CDs was determined by the lower value of the effectiveness for deuteranopes and protanopes.
We applied the above procedure to ATC displays. While an ATC display may have many colors and luminance, it should have one or two default colors with which the majority of materials are displayed, and they are not considered as color-coding. In primary ATC displays such as Display System Replacement (DSR), the default colors are white, green, or yellow-green. The background color is typically black or dark blue. One problem with ATC displays is that controllers can adjust screen brightness to their own preferences, and sometimes they can adjust the luminance of different types of displayed messages individually. We mimicked these two situations by a) having the target and distractors all in the 100% luminance of the given color, mimicking that controllers adjust the overall brightness of the screen; and b) having the target in 100% luminance and distractors in 50% luminance, mimicking that controllers adjust the brightness of the default color (such as that of datablocks) but not the overall brightness. We computed the effectiveness of some target colors for Attention. The computation was made for the ten colors that are frequently used to draw attention in ATC displays: red, green, yellow, blue, orange, brown, pink,
Attention The effects of color in drawing attention depend on the visual conspicuity of the target, which, in turn, depends on the color and luminance differences between the target and distractors. Most visual displays have a dark background, so conspicuity of a target usually increases with the luminance of the target. According to our literature review, there is no saturation point in the relationship between conspicuity and the effectiveness of color in drawing attention. The threshold luminance difference for attention is 20cd/cm2. The threshold chromaticity difference is 0.24 in the CIE uniform chromaticity systems. We computed the effects of color on Attention using the following steps: 1. Convert the images from a color display into the images that would be perceived by CDs; 2. Determine chromaticity values (Lxy) for target, distractors, and background. This could be done either by colorimeter measurements or by formula transformation from rgb values on the display; �
4. Compute the color difference ∆C for each pair of colors for CDs and color difference ∆C0 for CNs. 5. Compare the color differences with critical points to determine the effects of color for CDs: If ∆C0 < 0.036, then the effect is “NA” For the situations where ∆C 0>=0.08, If ∆C =0.16, then the effect is “E” When 0.036 = 0.012 for CDs and ∆C is equal or greater for CDs than for CNs, then the effect is “E” If ∆C >= 0.012 for CDs and ∆C is less for CDs than for CNs, then the effect is “L” If ∆C < 0.012 for CDs and ∆RL >=0.2 for CDs, the effect is “L”
We applied the above algorithm to ATC displays to compute the effects of color for Segmentation by CDs. The results are listed in Table 3, with rows for object color and columns for surround color. Notice that, except the identical object-surround colors (those along the diagonal line of the Table), all the other combination of colors are effective for segmentation by CDs and CNs. The comparisons between CDs and CNs are either “E” or “L,” but not “NE,” indicating that color is an effective cue in segmentation tasks even for CDs. Furthermore, some “less effective” color combinations for CDs do not necessarily mean less effective in real-life task performance. As long as an object, such as the menu bar of a display, can be segmented from its surround, observers can direct their eyes to that location, regardless of greater or less segmentation. Text readability Text readability is mainly determined by luminance contrast between the text and background. Readability increases with luminance contrast. When luminance contrast is near the threshold for reading, a color difference can sustain reading but is not as effective as the luminance factor. Moreover, there is no additive effect between color contrast and luminance contrast in readability. Therefore, we only considered the contribution of the luminance factor to reading. Based on the literature review, we took 20% Michelson contrast as the threshold point for reading. Hence, we computed the effects of color in text readability for CDs using the following steps: 1. Convert the images from a color display into the images that would be perceived by CDs; 2. Determine the chromaticity values of text and background colors for CDs;
�
Table 3: Effect of color in Segmentation for CDs relative to CNs. Red Green Yellow Blue Purple Brown Orange Pink Cyan Magenta Black White Gray Yellowgreen
Red NA L L L L L L L L L L L L L
Green L NA L E E L L L E E L L L L
Yel L L NA L E L E L L E E E L L
Blu L E L NA L L L E E L L L L E
Pur L E E L NA L L E E L E E E E
Bro L L L L L NA E L L E L L L L
Oran L L E L L E NA L L L L L L L
3. Determine the chromaticity values of text and background colors for CNs; 4. Compute Michelson contrast for CDs: C=(Lt-Lb)/ (Lt+Lb), where Lt is the text luminance and Lb is the background luminance; 5. Compute Michelson contrast C0 for CNs; 6. Compare the contrasts to critical points for text readability to determine the effects of color for reading: If C0 < 0.2, then the effect is “NA” Else If C < 0.2, then the effect is “NE” When C >=0.2 , If C >=C0, then the effect is “E” If C