Dublin Institute of Technology
ARROW@DIT Conference Papers
School of Mechanical and Transport Engineering
2006-01-01
Refinements in using Historical Process Data to Optimize Tolerance Allocation Kevin Delaney Dublin Institute of Technology,
[email protected]
Pat Phelan University of Limerick,
[email protected]
Follow this and additional works at: http://arrow.dit.ie/engschmeccon Part of the Engineering Commons Recommended Citation Delaney, K., Phelan, P.: Refinements in Using Historical Process Data to Optimize Tolerance Allocation. Proceedings of the 23rd International Manufacturing Conference, 30 August - 1 September, 2006.
This Conference Paper is brought to you for free and open access by the School of Mechanical and Transport Engineering at ARROW@DIT. It has been accepted for inclusion in Conference Papers by an authorized administrator of ARROW@DIT. For more information, please contact
[email protected],
[email protected].
This work is licensed under a Creative Commons AttributionNoncommercial-Share Alike 3.0 License
Refinements in using historical process data to optimize tolerance allocation K.D. Delaney1, P. Phelan1 1. Manufacturing and Operations, University of Limerick, Ireland. ABSTRACT Tolerance allocation for new products calls for experience and judgment. Whenever products are manufactured using production processes that are similar to existing products it is likely that the trend in production tolerances for both the new and existing products will be similar. It must be assumed that there have been no improvements to the tooling, modifications to the machines being used, or a change in process stability. The data employed to understand and exploit these trends is commonly referred to as process capability data and it is stored in a Process Capability DataBase (PCDB). There are several challenges to be addressed when creating a truly useful PCDB. A useful PCDB is of great benefit to companies because it helps them to reduce time to market by getting things “right first time” and eliminating a trial and error approach to tolerance allocation. A simple example to illustrate how a PCDB can be used to evaluate the capability of a design is presented and this shows how process capability data can be used as an integral part of the design process. The paper builds upon an experimental PCDB and describes the authors’ continuing experiences in creating a PCDB for use by a multinational company that manufactures electromechanical devices. The authors’ work in developing strategies on what data to include in a PCDB and prioritizing the geometry list to be used for data entry to make it as useful as possible is described. The method of indexing data in a PCDB for efficient retrieval by design engineers is explained. By correctly using a PCDB a product designer can more easily predict whether a tolerance is achievable or not based on historical process capability information. KEYWORDS Process Capability DataBase (PCDB) 1. BACKGROUND Manufacturing companies make a profit by giving customers the product that they really want or need. A model to describe the gaps between a customer’s “ideal” product and the actual product delivered by the supplier has been proposed by Delaney et al [1]. This model highlighted tolerance allocation as a contributor to this gap. Tolerance allocation for new products calls for experience and judgment. Designers can often face difficulty in assigning tolerances unless they are familiar with the capability of the process being used or unless they can get the knowledge from another source such as a process expert. The authors are currently developing a tool to help connector designers improve tolerance allocation.
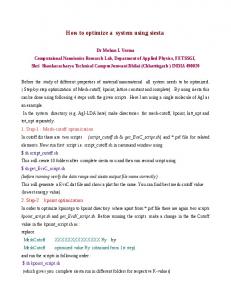
A connector is an electromechanical component that facilitates electrical contact by mechanical means to create a force between the two halves of the connector. Figure 1 shows a typical connector profile used in a mobile phone to connect the phone battery to the main printed circuit board (PCB). The solder foot, which will be soldered to the PCB, can be seen in addition to the curved radius that forms a removable mating interface with a battery. The housing (insulating dielectric) that holds the terminals in position and supports them can be clearly seen. A common connector configuration is where several such terminals are inserted into such a dielectric and soldered to the PCB.
Figure 1: showing a generic connector terminal. The total height of the connector, normally specified by and critical to the customer, is clearly indicated. A common customer requirement is to specify the overall height of the connector from the bottom of the solder foot to the highest point that will first make contact with the battery. In addition customers may specify a tolerance and a process capability value to be achieved. To eliminate a “trial and error” approach to connector development designers endeavor to ensure that their design is capable of meeting such requirements prior to producing any physical parts. The steps that a designer could follow in designing a connector are: 1) The designer could look at the concept system and use his/her judgment to separate the full assembly into constituent repeating geometries. Figure 2 shows one possible break-up of the example geometry into basic components. Since the dielectric does not directly affect the overall height it can be ignored for the purposes of this analysis. 2)
Using the additive law of variances the engineer can calculate the predicted variance/standard deviation for the overall system if the values for σh1 and σh2 are known.
σ htotal = σ h1 + σ h2 2
2
2
(1)
Figure 2: showing the terminal from Figure 2 separated into the 2 basic geometries that it comprises of.
3)
This predicted value for the system standard variation can be used to predict the capability value based on the tolerance band requested by the customer.
C pk = Where:
σh
total
∆T
6σ htotal
(2)
= standard deviation for the overall terminal height
∆T = Total Tolerance band (Given by the customer)
In situations where the predicted capability value does not meet the customer’s requirements the designer may have to look at different geometries/materials that might improve the overall design capability. Alternatively the customer may ask what tolerance can achieve a specific capability index and this can be calculated by re-arranging equation (2). To use this system engineers must have access to consistent and realistic data values for σh1 and σh2. Such information may be available from process experts with sufficient experience in manufacturing. The authors are currently studying how real inspection data, recorded as inprocess manufacturing checks, can be used to form a database of such manufacturing information. The objective is to present the data in the form of a Process Capability DataBase (PCDB). A PCDB is of great benefit to companies because it helps them to reduce time to market by getting product design “right first time”. It does this by giving inexperienced designers the opportunity to capitalise from parts produced in the past. In addition to being used by design engineers to help with tolerance allocation a PCDB can be useful to several other groups in a company. Data could be used by management to rate a manufacturing facility or by quality engineers to understand where to focus process improvement efforts. Where data is available from suppliers sourcing groups could use this information to compare suppliers. This is one reason why suppliers tend to be very cautious in sharing their capability data with customers. Such process capability information stored in a PCDB can also be used to validate tolerances during
process qualification. The authors’ initial experience based on the experimental PCDB software developed by Kern and Thornton [2] has been previously described [3]. This paper describes the authors’ continuing experiences in creating a PCDB and populating it with existing production data for use by design engineers from a multinational company that manufactures electromechanical devices. This relates to what data to include in a PCDB and prioritizing the data entry in addition to how the data should be analysed and presented to users. By correctly using a PCDB which contains the right information a product designer can more easily understand whether a tolerance is achievable or not based on historical process capability information. 2. POPULATING THE PCDB Data was selected from a number of geometries. Dimensional data measured at constant time intervals was analysed for a number of batches. The number of components produced in each batch varied between 100,000 and 10,000,000 approximately. The following sections will describe how the data was analysed and presented. The first will describe how the geometries were prioritised. 2.1 PRIORITIZING GEOMETRIES TO BE INCLUDED In conjunction with company management the authors made a decision to focus improvement efforts on the stamping and forming process where it is believed that maximum benefit can be achieved. This is backed up by data relating to the frequency of design iterations after the part is in mass production in addition to previous internal company studies. The procedure outlined in the introduction shows how design engineers can split the total system geometry into fundamental repeating geometries and such a list is needed when creating a PCDB. Several products being produced by the company for at least 3-5 years were studied and the repeating geometries and materials listed. These are high-volume connectors used in consumer products. They have been optimized during their years in production and would be considered to be world class when compared to both internal and external data available to the company. This is important since the process should be running close to acceptance limits for maximum benefit to be derived from the resulting data. The criteria used by the authors when selecting geometries for consideration were: 1) The geometry must be re-occurring in multiple projects; 2) The geometry must be produced from a material that will be used long-term; 3) The process must be qualified (the process must be capable and stable); 4) Must be a process where PCDB information will be useful to designers; To prioritize the geometries to be included a survey was conducted within the company. Those involved included three senior design engineers, two tool designers and two quality engineers. Their responses used to prioritize the geometries and materials for which data should be entered into the PCDB. Once the geometries were chosen the related data values needed to be filtered and added into the PCDB.
2.2 DATA INTEGRITY The data available for populating the PCDB is that recorded as part of in-process dimensional quality checks during production. This data is recorded at the start of production and thereafter at constant time-intervals. The authors have identified a number of potential error sources and these are: - Operator error - Measurement gauge error - Environmental changes - Round-off errors - Not measuring the correct features - Incomplete tooling/design change history These potential sources of error were reviewed and the authors believe that their effect will be negligible based on the following rationale: - Operators are trained in accordance with company standards to ensure consistency. It is assumed that there is no variation between the results that would be reported by several trained operators after measuring the same part. - All gauges that are used to measure parts must pass a gauge qualification process to ensure that it is both reliable and repeatable. - The stamping presses are enclosed within sound booths they remain at a relatively constant temperature the effects of temperature changes and/or associated lubrication/tooling changes are believed to be negligible. - Round-off errors are assumed to be negligible. - Data is measured using a programmed microscope. As long as the correct program is selected and the operator follows the correct procedures there is a very small possibility of not measuring the correct features. - Engineering change history is documented in accordance with quality policies and are available for review and cross-reference with each part number. 2.3 DISPLAYING PCDB DATA We have seen how the data for the PCDB was based on a number of measurements from production batches of different geometries. This data was loaded into a Microsoft Excel spreadsheet with a filter-down system to search the various fields in the PCDB. It is expected that a future implementation would see the data being available through the company intranet using a web browser. Different access levels may be available for design engineers, process engineers, sourcing or management depending upon what data they are trying to retrieve.
Table 1: this shows some of the indexing fields being used by the authors for the trial PCDB. The plant field is shown for reference only.
A PCDB user will select their desired combination of process/material/geometry/plant and retrieve data based on this. Several interfaces in the literature present the resulting data as a point value. Examples include the PCDB developed by Kern and Thornton [2] and that proposed by Bauer [4]. The authors have decided to present their capability data in the form of a Process Capability Map similar to that proposed by Booker et al [5]. The next section describes how the authors are analysing historical process data and presenting it graphically to design engineers. 3. ANALYSIS OF THE DATA The initial filtering method used by the authors to eliminate outliers from the data has been previously described [3]. This described how single outliers were eliminated when they could be attributed to special cause variation but when more than one data point is outside or drifting towards the specification limits common cause variation is likely and the outlier data points cannot be ignored. Table 2 shows data for the σh1 dimension from the connector terminal shown in Figure 2. The average value of measurments from each batch and their standard deviation (relative to the design nominal) was calculated as shown in the right-hand columns. Factory order # 1 2 3 4 …
Data value Data value Data value Data value 1 2 3 4 3.900 4.015 3.954 3.873 …
3.961 4.042 3.997 3.885 …
3.994 3.984 3.936 3.837 …
3.973 4.026 3.964 3.845 …
….. … … … … …
Factory order average 3.855 3.96 4.003 3.973 …
Factory order Sigma 0.0238 0.0424 0.0171 0.0206 …
Table 2: showing the calculations performed on the data after initial filtering
This data for several hi values was plotted as shown in Figure 3. All hi were of a different physical size but produced from the same material by the same process over a similar time period. Such data shows a design engineer the spread of various contact heights over time.
Figure 3: showing σh1 and average values from several different batches for 4 different h1 target values
Using this data regions can be created where the process will be “capable“ and where it will not be capable based on equation (2). Such regions for Cpk > 2 is shown in Figure 4. Some companies may be prepared to accept Cpk values less than 2 based on their individual requirements. Design engineers can read the relevant tolerance values from the vertical axis of the graph and assign (+/-) this tolerance to their products. Since these tolerances are based on historical data the engineers will have a high level of confidence that these values will be achieveable in the future assuming that the process is stable. Cpk > 2 Cpk < 2
Figure 4: showing the data from Figure 4 scaled for several capability ratios. The areas where Cpk is > and < 2 is clearly indicated.
Strictly speaking the data will be valid only for the specific characteristic lengths originally measured. However presenting the data in graphical form allows the user to gain an increased understanding of the variation range that could be expected during mass production and allows some engineering discretion regarding interpolation between data points. 4. CONCLUDING REMARKS Section 1 outlined the process that a design engineer might follow when designing a connector terminal. Sections 2 and 3 described how the authors populated the PCDB and analyzed data in addition to showing the method used to graphically present the data to users. Important points to consider when creating a PCDB are: 1. The geometries included must be the most useful for future designs. 2. Potential sources of error in the data must be identified and the data stored in the PCDB must be reliable. 3. PCDB data must be searchable with an easy to use interface. 4. The authors decided to display data graphically. One aspect not addressed was how data in the PCDB should be updated. Since the process is assumed to be stable it is unlikely that the data for a given entry in the PCDB will need to be modified frequently. A fully automatic system could be technically
difficult and expensive to establish while a manual-based system would be much cheaper to establish but more expensive to maintain. The authors believe that the optimum method is to have a dedicated person within an organization responsible for updating the PCDB based on the production data recorded. This person must be knowledgeable about the process for which the data is being uploaded. This individual should review the data and evaluate if there has been a change that would require an update of the PCDB. If so then the PCDB should be updated and released for use by engineers. This person must also understand how developments within the process/material technology may result in data within the PCDB becoming obsolete. Examples of such a situation would be where new tool manufacturing techniques or new lubricant might reduce tooling wear resulting in the ability to produce a product with less variation. This paper makes the authors’ practical experience in creating a PCDB for a highspeed stamping operation available to other companies. Work is continuing to further improve the usefulness of the data by adding a confidence interval to the data and also further optimise strategies to identify and remove outliers. REFERENCES [1] K. D. Delaney, P. Phelan, and D. Delaney, "A Gap Model for Understanding the Variation of the Real Product from the Ideal," presented at Challenges Facing Manufacturing - The 22nd International Manufacturing Conference, Institute of Technology, Tallaght, Dublin, Ireland, 2005. [2] Kern and Thornton, "www.PCDb.org." Last accessed: 28 March 2005. [3] K. D. Delaney and P. Phelan, "Using Historical Process Data to Optimise Tolerance Allocation," presented at Challenges Facing Manufacturing - The 22nd International Manufacturing Conference, Institute of Technology, Tallaght, Dublin, Ireland, 2005. [4] L. W. Bauer, "Process Capability Modeling," General Electric Corporation 2002GRC038, 2002. [5] J. D. Booker, M. Raines, and K. G. Swift, Designing Capable and Reliable Products, First ed. Oxford: Butterworth-Heinemann, 2001.