B. Dave, A. I. Li, N. Gu, H.-J. Park (eds.), New Frontiers: Proceedings of the 15th International Conference on Computer-Aided Architectural Design Research in Asia CAADRIA 2010, 29–38. ©2010, Association for Research in Computer-Aided Architectural Research in Asia (CAADRIA), Hong Kong
REFINING A COMPUTATIONAL FRACTAL METHOD OF ANALYSIS Testing Bovill’s architectural data JOSEPHINE VAUGHAN and MICHAEL J. OSTWALD The University of Newcastle, NSW, 2308, Australia.
[email protected] [email protected]
Abstract. In 1996 Bovill applied Mandelbrot’s fractal method for calculating the approximate visual complexity of images to architecture. This method is one of only a limited number of quantifiable approaches to provide a measure of the relative complexity of an architectural form. However, the method has rarely been tested despite many scholars uncritically repeating Bovill’s conclusions. While Bovill’s original work was calculated manually, a software program, Archimage, is presently being developed by the authors as a tool to assist architectural designers and researchers to understand the visual complexity of building designs. The present research returns to Bovill’s original architectural data (elevations of famous buildings) and re-calculates the results published therein using Archimage and the commercial software Benoit. These results are then compvared with those produced by Bovill (1996) and Lorenz (2003), to determine if any consistency can be found between the sets. The level of consistency will assist in determining the validity of Bovill’s method and provide important data in the ongoing process to refine the Archimage software and the analytical method. Keywords. Computational analysis tools; design analysis; visual complexity.
1. Introduction In 1996 Carl Bovill published Fractal geometry in architecture and design, in which he expands upon Benoit Mandelbrot’s fractal dimension calculations of the visual complexity of images (Mandelbrot 1982). The fractal dimension
30
J. VAUGHAN AND M.J. OSTWALD
approximates the visual complexity (degree of detail present) in an image as it is observed over multiple scales. Importantly, Bovill applies a box-counting method of fractal analysis to line drawings of elevations of iconic buildings by the architects Frank Lloyd Wright and Le Corbusier, determining their fractal dimensions and thereby comparing one measure of their visual complexity. Bovill’s work is the first to apply the box-counting method to architecture on a broad scale and if valid, it could provide one of a limited number of quantifiable measures of the fractal dimension, also often called “characteristic complexity”, of an architectural design. Since that time many scholars have reproduced Bovill’s results but his method has rarely been the subject of intense scrutiny and his original results have never been consistently tested. Wolfgang Lorenz (2003) re-analysed several of Bovill’s images. Even though the original data have since been used by many scholars, they have remained untested and no attempt has been made to quantify the difference between the computational and manual results produced by the method. One reason why Bovill’s original work has resisted testing is simply that his process was completely manual; a laborious process involving repeated drawing, counting and calculating. Because of the difficulty of achieving consistent results with this method a software program, Archimage, is being developed by the authors. Based on Bovill’s box-counting method, this program is specifically intended to be a tool to assist architects to analyse the fractal dimension of buildings and thereby aid designers and researchers to understand the visual complexity of building forms. The Archimage software calculates the approximate fractal dimension of plans and elevations, producing comparable quantitative results, and the authors have developed and consistently tested this software previously on 160 elevations by notable architects. This paper is part of ongoing research to determine the validity of Bovill’s box-counting method and this present research aims to strengthen the calibration of the Archimage software by comparatively testing three variations of the method. These variations are: 1. Bovill’s original manual method (with existing data provided by Bovill and Lorenz), 2. Archimage, a program developed by the authors. 3. Benoit, a TruSoft program designed for the general fractal analysis of images.
Significantly, all three of these approaches for calculating fractal dimension rely on subtle variations of the box-counting approach. The comparative study contained in the present paper uses the very first examples of architectural testing provided by Bovill; three images in total, comprising one elevation each of Frank Lloyd Wright’s Unity Temple and Robie House and Le
REFINING A COMPUTATIONAL METHOD OF FRACTAL ANALYSIS
31
Corbusier’s Villa Savoye. The paper will first provide a brief background of the use of the box-counting method, covering the common features of this method. Bovill’s manual box-counting method, as repeated by Lorenz, will be described next, followed by an outline of any methodological variations present in the Archimage and Benoit programs. The set of architectural images which have been analysed for fractal dimensions by Bovill and Lorenz will then be re-tested by Archimage and Benoit. Finally, the paper compares and contrasts all four sets of results, providing an analysis of the accuracy of the results and any limitations and discrepancies, to determine if any consistency can be found between the three sets, and what importance these results could have for the architectural computational community. 2. Fractal analysis of architecture Bovill’s 1996 work was the first major exploration of the relationship between fractal geometry and art, music, design and architecture. In particular, in this work Bovill demonstrates a mathematical way of measuring and comparing the fractal dimension of several important historical buildings. Bovill calculated the fractal dimension of these buildings using an application of Benoit Mandelbrot’s box-counting technique, to determine the approximate fractal dimension, or characteristic visual complexity, of architectural plans and elevations. Bovill’s box-counting method has since been employed to calculate the fractal dimension of a range of ancient buildings, including Mesoamerican pyramids (Burkle-Elizondo and Valdez-Cepeda, 2006) and the fractal dimensions of the Doric, Corinthian and Composite orders of architecture (Capo, 2004). Sala reproduces Bovill’s work on Frank Lloyd Wright’s Robie house without any additional interpretation (2002) and Gozubuyuk, Cagdas and Ediz (2006) apply the box-counting method to digital design methods to create a new building that might respond to existing architectural “languages” of a district. In the last two years a computational variation of the fractal analysis method has been developed and tested on the built works of Le Corbusier and Frank Lloyd Wright (Ostwald, Vaughan and Tucker, 2008) partially confirming Bovill’s original results. This computational method has since been used to analyse the domestic architecture of Eileen Gray (Ostwald and Vaughan, 2008), Peter Eisenman (Ostwald and Vaughan, 2009) and Kazuyo Sejima (Ostwald, Vaughan and Chalup, 2009). 3. The Box-counting method The process of box-counting any architectural form involves translating the
32
J. VAUGHAN AND M.J. OSTWALD
subject into a line drawing, such as the elevation of a building (figure 1a). A grid is placed over this image and the number of squares which contain part of the image are noted (figure 1b). This grid is then replaced by another with closer spacing, and the number of squares are counted once again (figure 1c). This sequence progresses for a set number of iterations. The decreasing grid size allows for levels of detail in the image over different scales to be discovered. By plotting a comparison of the grid sizes with the number of counted boxes on a log-log graph, the slope of the resulting graph provides the fractal dimension; in the case of an image, this is a number between 1.0 and 2.0 (Bovill, 1996; Lorenz, 2003). The higher this number is (that is, the closer the number is to 2.0) the closer the image is to appearing as a two-dimensional object and thus the higher the fractal dimension of the object.
Figures 1a, 1b and 1c (from left to right). The box-counting process.
4. Methods of Box-Counting 4.1 BOVILL’S MANUAL METHOD
Bovill undertakes the box-counting method manually in his 1996 publication. To determine the starting box size, Bovill considers the optical actions of the eye focusing at different scales and assumes the location of the standing viewer at an observation point somewhere between 40–80 feet away. Bovill calculates that the appropriate box-counting grid size for a building would range between 1.4′ and 29.1′. Bovill considers that “[t]he starting grid size should generally be small enough so that not all the boxes are counted” (1996: 121). For the Robie House analysis this translates to a starting grid size of 24′, for the unity temple: 15′ and the Villa Savoye: 8′. Beyond the visual range proposal, Bovill does not clarify why this initial box dimension is selected for each building. Presumably it relates to the actual size of the elevation. The south elevation of the Robie House is actually 161′6″ long, while Bovill’s 8 box-row starting grid provides 192′ (8 × 24′) to fit the elevation, leaving approximately 15′ of white space on each side of the elevation to create a starting image, which matches the image provided by Bovill. However, for the Unity Temple North elevation, the starting grid provided is a total of 150′ wide
REFINING A COMPUTATIONAL METHOD OF FRACTAL ANALYSIS
33
(10 box row × 15′ grid size), and the width of the actual northern elevation is only 91′6″, providing nearly 30′ on each side of the temple as white space, which does not match Bovill’s image. Likewise the Villa Savoye is accorded 5′ of white space on each side, which is not clearly repeated in Bovill’s drawings, and confusingly, the placement of the Villa Savoye in the grid is offset to the left, providing no white space on that side and only a small amount on the right. As Bovill progresses in the scale change of the calculations, the successive grid size is always half the size of the previous, and a total of 2 to 3 iterations are calculated for each image. It is not clear why Bovill stops at this point, when he does mention that for the Robie house calculations “[t]he design interest of the Robie House does not stop at […this] scanning range […]. The window mullion pattern has not affected the box count yet.”(1996, 124). It is possible that the small scale required for these further grid sizes would prove very difficult to reproduce manually. In 2003 Lorenz produced an in-depth study re-testing and expanding Bovill’s work. In order to re-calculate several of Bovill’s original images, Lorenz uses the same manual method as Bovill, however, some of the images are analysed at different scales of observation, and Lorenz occasionally calculates an additional iteration. It is assumed that Lorenz calculated these results directly from copies of Bovill’s original published images. 4.2 ARCHIMAGE
Archimage software was developed primarily to analyse line drawings of buildings, although a variation for analysing photographs is also under development. The original version (1.0) was authored in 2005 and it has been tested, refined and expanded since that time. The current version (2.1) uses a range of mathematical, geometric and computational approaches to provide quantitative information about architecture. One of the analytical approaches Archimage uses for line drawings is the box-counting method. For Archimage to undertake a box-counting analysis, line drawings are imported into the program. The first stage scales the imported image to a certain pixel length and then uses a Sobel line detection algorithm to convert the imported image into a line drawing, with no lines wider than a single pixel. The Sobel algorithm is used to ensure consistency for the images loaded into Archimage. Once images have been converted to consistent line drawings, the program assesses them to determine the size of the image in pixels (length × height). Archimage then uses an aspect ratio system to regulate this initial image size in order to determine the starting box size ratio required to calculate the image’s fractal dimension, ensuring an equal division of whole boxes. Starting aspect ratios of 4:4, 4:3, 3:2 or 4:2 are determined by an algorithm
34
J. VAUGHAN AND M.J. OSTWALD
which adds, if necessary, white space around the figure in order to grow it to conform to one of these starting ratios. If the image must be expanded in size to conform to a starting ratio, the shorter dimension of the image is expanded evenly on both sides with white space. While Bovill halves the size of each grid being used for the analysis, Archimage decreases the box dimension by a coefficient of √2; this provides a much higher degree of accuracy. The process continues until a minimum box dimension of 5 × 5 or 4 × 4 pixels is reached. The approximate fractal dimension is calculated from these box counts using a linear regression algorithm in much the same way that Bovill’s method does. However, unlike Bovill’s method in which only 2–3 calculations are performed per image, Archimage typically produces 10–15 results per image. Archimage’s adjustment of the imported image’s scale does allow for a consistent number of iterations across the different imported images, however the final number of iterations for each image does vary due to the combination of the scaled image and the aspect ratio. The resulting fractal dimension is presented numerically (to three decimal places) and graphically. The graphical form shows the box count (log) values in the y-axis and the box size in pixels (log scale) on the x-axis. A blue and red line on this fractal dimension graph show the actual results and the fractal dimension slope respectively. These lines are important because they demonstrate the limits of the calculation. The points of the graph which do not closely approximate the slope of the line generated by them determine the limits of the accuracy of the result. The largest grid sizes tend to produce the greatest divergences from the line if there are any at all. Intermediate grid sizes are typically more closely aligned with the overall result. 4.3 BENOIT
Benoit is a commercial program that was developed by TruSoft in the late 1990s for the computational analysis of the fractal dimension of complex natural features. Benoit (1.31) uses the most complex version of the boxcounting method applied in any available software tool today, but this very complexity means that to develop consistent results can be difficult. Moreover, Benoit is not well optimized for architecture; a subject matter which is much simpler that the natural forms Benoit was designed to investigate. Benoit has a wide range of flexible scaling ratios meaning that comparisons between grids can be made at an extremely fine scale and the analysis parameters were set to match those of Archimage for the present paper. Benoit also uses an innovative grid rotation system to reduce the impact of “double-counting lines” (Ostwald, Vaughan and Tucker, 2008). One major difference between Benoit and Archimage is that while the latter adds white space
REFINING A COMPUTATIONAL METHOD OF FRACTAL ANALYSIS
35
to the starting image to achieve an optimal grid, the former appears to clip white space to achieve an appropriate starting grid. This difference in tactics is expected to produce a subtle variation in the results. The Benoit results are included in this paper because the software to replicate the results is relatively accessible and this means that the result of the present paper can be independently tested. 5. Method of comparison Four sources of data, generated from the same three images, are used in this present study. The three architectural images published in Bovill’s 1996 publication are redrawn for analysis by Archimage and Benoit, and it is presumed Lorenz followed the same procedure in his 2003 study. However, it is not known at what line thickness Lorenz reproduced Bovill’s original images. Bovill’s images vary in their line width and when redrawn for testing by Archimage and Benoit in this research, all image lines were reduced to 1 pixel width (figures 2–4). Bovill presents 2–3 calculations per image, without an overall result for each image. To find a comparative figure for this study, Bovill’s results are averaged into one final composite result for each particular image. The same process is undertaken on Lorenz’s results. Archimage and Benoit produce a single result from several iterations (10–13), and these single results are used in the comparison.
Figures 2. Robie House.
Figure 3, Villa Savoye (left). Figure 4, Unity Temple (right). All images are redrawn from Bovill’s originals at 1 pixel line weight.
36
J. VAUGHAN AND M.J. OSTWALD
6. Results and Discussion 6.1 LE CORBUSIER’S VILLA SAVOYE (1928)
Bovill undertakes two calculations on the northern elevation of the Villa Savoye (figure 3), (D(14-28)=1.42; D(28-56)=1.33). Lorenz uses a different set of scales to achieve an identical result: D(16-32)=1.42; D(32-64)=1.33 (see table 1); and includes an additional calculation: D(64-128)=1.17. The average results for Bovill and Lorenz are therefore close, whereas the result for the Villa Savoye using Benoit and Archimage are significantly higher; respectively D = 1.433 and D = 1.544. Table 1. Comparison of results. Results
Bovill (1996)
Lorenz (2003)
Archimage (2009)
Benoit (2009)
D(range)
%gap
D(Villa Savoye)
1.3775
1.306
1.544
1.433
0.238
11.9%
D(Unity Temple)
1.550
1.513
1.574
1.506
0.068
3.4%
D(Robie House)
1.520
1.575
1.689
1.620
0.169
8.45%
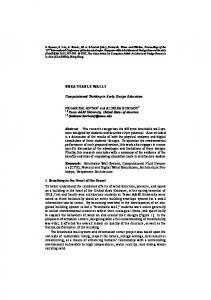
6.2 FRANK LLOYD WRIGHT’S UNITY TEMPLE (1908)
Bovill uses the northern elevation of the Temple (figure 4) for his analysis, undertaking 2 calculations to produce an average result of D = 1.550. Lorenz uses 3 grids, with different scales to Bovill (D = 1.513) and, as seen from the log-log scale graph, Archimage processed 13 iterations, resulting in a fractal dimension of 1.574 (figure 5). The Unity Temple calculations from all methods show a great coherence of results with a percentage gap difference of all the results at around 3%.
Figure 5. Archimage log-log scale graphs showing the fractal dimensions for, from left to right, the Villa Savoy (north elev.), Unity Temple (north elev.), and of the Robie House (south elev.).
REFINING A COMPUTATIONAL METHOD OF FRACTAL ANALYSIS
37
6.3 FRANK LLOYD WRIGHT’S ROBIE HOUSE (1910)
Bovill undertakes 3 calculations for the south elevation of the Robie house (figure 2), with an average result of D = 1.520. Lorenz also provides three measurements, additionally including an overall calculation of D = 1.57, which matches the average of his results D = 1.575. 6.4 COMPARATIVE ANALYSIS
The comparative graph (figure 6) shows variation between the three methods, with tight clustering of results for the Unity Temple (1.506 < D < 1.574) and the wider ranges for the Villa Savoye (1.306 < D < 1.544) and the Robie House (1.520 < D < 1.689). The grouped results for each building do match the historically proposed level of complexity for each building: that the Robie house with its progression of detail is the most complex, and the Villa Savoye, with its plain, geometric exterior, has the lowest visual detail of the three images. The graph shows that for these three images, Archimage produces a higher result than the other methods, and that this result is consistently higher than that of Benoit. This may be due to the smaller final grid size that Archimage calculates to, since with a smaller grid size, increased detail can be captured. It is most likely Lorenz’s utilization of Bovill’s manual method and images that produce the similarity with their results, with a difference in scale and hand production explaining the slight variation. Likewise, the greater variation in the two computational programs may be based on several of the differences in method, such as line width, number of iterations, and image placement.
Fractal Dimension ( D )
1.7 1.65 1.6 Bovill (1996)
1.55
Lorenz (2003
1.5
Archimage (2
1.45
Benoit (2009
1.4 1.35 1.3 S
Figure 6. Comparative graph
7. Conclusion Comparing the results produced by Bovill’s three elevations of iconic buildings is useful to demonstrate the subtle variations in the box-counting method. Generally, the results from the three methods do contribute to the credibility of the box-counting approach for fractal analysis of architecture. Although the
38
J. VAUGHAN AND M.J. OSTWALD
Archimage results fit into a numerical cluster, they do show a consistent difference to the other methods, yet it is not clear if this is due to increased accuracy or whether fine-tuning may be required. Further testing which isolates aspects of the box-counting method such as line thickness, image placement and the statistical divergence of results is necessary to refine this program for use by the architectural computing community. Acknowledgements This research was supported by an Australian Research Council, Discovery Project grant (ARCDP): DP0770106.
References Bovill C.: 1996, Fractal geometry in architecture and design, Birkhäuser, Boston. Burkle-Elizondo, G. and Valdez-Cepeda, R. D.: 2006, Fractal analysis of Mesoamerican pyramids, Nonlinear dynamics, psychology, and life sciences, 10,105–122. Capo, D.: 2004, The fractal nature of the architectural orders, Nexus network journal, 6, 30–40. Gozubuyuk, G., Cagdas, G. and Ediz, O.: 2006, Fractal based design model for different architectural languages, in K. Oosterhuis and L. Feireiss (eds.), The architecture co-laboratory: GameSetandMatch II, Episode Publishers, Rotterdam, 280–286. Lorenz, W. E.: 2003, Fractals and fractal architecture, Department of Computer Aided Planning and Architecture, Vienna University of Technology, Vienna. Mandelbrot, B. B.: 1982, The fractal geometry of nature, Freeman, San Francisco. Ostwald, M. J., and Vaughan, J.: 2009, Calculating visual complexity in Peter Eisenman’s architecture, CAADRIA 2009, Taiwan, 75–84. Ostwald, M. J., and Vaughan, J.: 2008, Determining the fractal dimension of the architecture of Eileen Gray, ANZAScA 2008, Newcastle, Australia, 9–16. Ostwald, M. J., Vaughan, J. and Chalup, S.: 2009, A computational investigation into the fractal dimensions of the architecture of Kazuyo Sejima, Design principles and practices: an international journal, 3, 231–244. Ostwald, M. J., Vaughan, J. and Tucker, C.: 2008, Characteristic visual complexity: fractal dimensions in the architecture of Frank Lloyd Wright and Le Corbusier, in K. Williams (ed.), Nexus VII: architecture and mathematics, Kim Williams Books, Turin, 217–231. Sala, N.: 2002, Fractals in architecture: some examples, in G. A. Losa, T. F. Nonnenmacher, D. Merlini and E. R. Weibel (eds.), Fractals in biology and medicine volume III, Birkhäuser, Basel, 347–358. Vaughan, J. and Ostwald, M. J.: 2009, A quantitative comparison between the formal complexity of Le Corbusier’s pre-modern (1905–1912) and early modern (1922–1928) architecture, Design principles and practices: an international journal, 3, 359–372.