1.1. PCM registration with sub-pixel resolution. PCM capitalizes on the well known fact that coordinate shifts in the spatial domain correspond to linear phase.
REGISTRATION OF MULTI-DIMENSIONAL IMAGE DATA VIA SUB-PIXEL RESOLUTION PHASE CORRELATION W. Scott Hoge1 , Dimitris Mitsouras2 , Frank J. Rybicki1 , Robert V. Mulkern1 , and Carl-Fredrik Westin1 (1) Department of Radiology, Brigham and Women’s Hospital and Harvard Medical School, Boston, MA, USA (2) Lab for Computer Science, Massachusetts Institute of Technology, Cambridge, MA ABSTRACT This method is an extension of the phase correlation method for image registration to multi-dimensional data sets. Through use of a high-order singular value decomposition, phase correlation can be used to identify translational displacements independently along each dimension with subpixel resolution. The validity of this approach is demonstrated using multiple 3D MRI data sets. 1. INTRODUCTION With increasingly powerful hardware, modern medical imaging applications are now moving from traditional twodimensional imaging to multi-dimensional analysis. This is particularly true in MRI and CT where visualization of anatomical structures and pathology diagnosis is made easier through 3D visualization. An example we provide below is the registration of 3D MRI data to provide a highresolution estimate from multiple low-resolution data sets. Our approach to the translational alignment of multidimensional image data is an extension of the phase correlation method (PCM)[1]. We build upon this approach by applying a singular value decomposition (SVD) tailored to multi-dimensional data, denoted the high-order SVD. This provides the independent identification of the translation between two data sets along all dimensions, with subpixel resolution of the translation estimates. In addition, it is as robust to noise as the previous PCM algorithm(s) from which it is derived. 1.1. PCM registration with sub-pixel resolution PCM capitalizes on the well known fact that coordinate shifts in the spatial domain correspond to linear phase changes in the Fourier domain. Specifically, if a pair of two dimensional functions, A and B, are spatially related by a simple translational shift, the elements of the Fourier representation of B, denoted B, are related to A by B(l1 , l2 ) = A(l1 , l2 ) exp(−(l1 t1 + l2 t2 )) This work supported by NIH T32 PA-103-00 grant funding.
where (l1 , l2 ) are the Fourier domain coordinates and t1 and t2 are the amount of horizontal and vertical displacement between A and B. To follow the original PCM approach, one first computes the phase correlation matrix Q(l1 , l2 )
∗
B(l1 ,l2 )A (l1 ,l2 ) = |A(l ∗ 1 ,l2 )A (l1 ,l2 )| = exp(−(l1 t1 + l2 t2 )).
(1)
Computing the inverse Fourier transform of Q results in a matrix where the peak value location identifies the translation. In ideal cases, this function could be represented as Q(x, y) = δ(x − t1 , y − t2 ).
(2)
PCM is widely used because it is exceptionally robust in the presence of noise [2]. However, sub-pixel translations will cause the peak in Q(x, y) to spread to neighboring pixels. In addition, the resolution of the peak can degrade due to the presence of aliasing and edge-effects [3]. To address these issues, a number of extensions to PCM have been proposed, two of which are briefly reviewed below. In [3], Stone, et. al., performed sub-pixel translation estimation via a 2D least-squares fit to the phase of Q. They showed that two sources of spectrum distortion can degrade the estimate quality: aliasing during image acquisition, and edge effects produced by the discrete Fourier transform (DFT). To overcome these effects, they apply a spatial domain envelope to the images to ensure smooth transitions at the image edges, and perform the estimate using only those elements of the phase correlation matrix Q with significant signal information via an appropriate mask. It was recently shown [4] that robust translation parameter estimation can be performed in the presence of these spectrum distortions by first finding the dominant singular vectors of Q. The Eigen-filtering nature of the SVD effectively suppresses noise in the phase correlation matrix and isolates the vertical and horizontal translation phase contributions. This allows phase unwrapping along each dimension independently, rather than 2D phase unwrapping as in [3]. The SVD approach greatly simplifies the translation es-
pg. 707-710 of Proc. IEEE Intl Conf Image Processing. Barcelona, Spain. 14-17 Sept 2003. Copyright IEEE
timation, and can be easily extended to higher dimensional data sets by utilizing the high-order SVD. 1.2. The high order SVD The high-order SVD (hoSVD) extends the singular value decomposition to tensors [5]. In general, the SVD is used to identify the dominant column and row subspaces for twodimensional matrices. The SVD is defined as A = U ΣV H where U, V are unitary matrices, and Σ is a diagonal matrix of non-negative singular values, σi . The columns of U and V are composed of singular vectors. The dominant left singular vector corresponds to the largest singular value, and is the solution to maxu kAH uk2 with uH u = 1. For data organized in a multi-dimensional coordinate system, the high-order SVD is defined using tensor operators as A = S ×1 U (1) ×2 U (2) · · · ×N U (N ) .
(3)
Here the U (i) are unitary matrices and S is a tensor of same size as A which contains the singular values. Note that S is typically not diagonal. Instead, it is allorthogonal, meaning that the inner-product of any two lines along a single mode is identically zero. For example, in MATLAB-style matrix notation this would be written as hS(:, i, :), S(:, j, :)i = 0, ∀ i 6= j for lines along the second dimension. The n-mode product, ×n , of an N-dimensional tensor with a matrix along the nth dimension is defined as (A ×n U )P = i1 ,i2 ,···,in−1 ,j,in+1 ,···,iN a in i1 ,i2 ,···,in−1 ,in ,in+1 ,···,iN ujn ,in .
un
The linear phase change along un corresponds to the amount of spatial translation, tn , along mode n between the two data sets. To estimate tn , the phase of un is unwrapped, and a line is fit to this data minimizing the least mean square error. The slope of this line, c, corresponds to the shift as tn = c ln /(2π), where ln is the length of the vector un . To spatially align the two data sets, one can introduce a phase shift to the Fourier domain image data. Specifically, to correct for a shift tn between images A and B, one can construct a linear phase change vector ϕn (x) = exp(j2π tn x/ln ) for x = 1, 2, ..., ln , and form a diagonal matrix Φn with ϕn along the main diagonal. After all of the translational shifts tn have been calculated, they may be applied to the Fourier representation of B via Bcorrected = B ×1 Φ1 ×2 Φ2 ×3 Φ3 .
(6)
Finally, the registered image can be reconstructed by performing an inverse Fourier transform on Bcorrected .
In practice, n-mode multiplication is performed by first unfolding the tensor along a given mode to create a 2D matrix, performing the multiplication along that mode, and then folding the data back to the tensor form. For a three dimensional tensor of size L1 by L2 by L3 , the unfolding operation can be written in MATLAB-style notation as unfold1 (A) = [ A(:, 1, :) A(:, 2, :) · · · A(:, L2 , :) ] unfold2 (A) = [ A(:, :, 1)T A(:, :, 2)T · · · A(:, :, L3 )T ] unfold3 (A) = [ A(1, :, :)T A(2, :, :)T · · · A(L1 , :, :)T ] The multiplication along mode n can then be implemented as A ×n U = foldn (U unfoldn (A))
is contained in the phase of the dominant singular vector for each dimension of the phase correlation matrix, Q. The phase correlation matrix is determined in the same manner as the 2D case, (1). Masking of Q to concentrate the algorithm on data closest to the DC coordinate in the Fourier domain is often practical, especially in the case of very large multi-dimensional data sets. The dominant singular vector along each dimension of Q is calculated by first unfolding Q along a given dimension n, and solving ° ° max °(unfoldn (Q))H un °2 . (5)
(4)
For example, the familiar SVD can be written in tensor form as A = U ΣV H = Σ ×1 U ×2 V ∗ = Σ ×1 U (1) ×2 U (2) . 2. SPATIAL REGISTRATION OF N-D IMAGE DATA To estimate the rigid spatial domain translation between multi-dimensional data sets, all of the relevant information
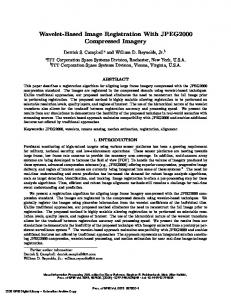
3. 3D MR DATA REGISTRATION RESULTS To demonstrate the validity of this method, below is an example employing the combination of three low resolution MR data sets to construct a single high resolution image set. Three 3D fast-spin-echo (FSE) [6], T1 weighted, MR acquisitions were performed, each acquiring a 128 × 128 × 32 cube of k-space (i.e. Fourier domain data) but with the low resolution dimension along orthogonal directions. Fig. 1 shows the layout in k-space of these three data sets. A central cube of 32×32×32 data points centered around the DC coordinate is the only overlapping region across all three data sets. The mask used for Q covered this central cube during registration. Edge effects in MR images are minor, as there are typically large regions of relatively low signal at the edges of MR images. Likewise, MR image data is (typically) acquired directly in the Fourier encoding domain, thus spatial aliasing is not an issue. Thus, no spatial-domain envelope preprocessing of the images was required. The acquisition protocol did introduce different spatial-domain
pg. 707-710 of Proc. IEEE Intl Conf Image Processing. Barcelona, Spain. 14-17 Sept 2003. Copyright IEEE
dimension 3
42 21 0 −22 −43 −64 64
42
21
dimension 1
64 42 0 21 0 −22 −22 −43 −43 −64 −64 dimension 2
Fig. 1. Orientation of three k-space data sets with one low resolution dimension along orthogonal axes, each represented by a different gray level. phase variations across the reconstructed data, so for registration purposes the data was first transformed to the spatial domain, the phase information eliminated, and then the image data was transformed back to the Fourier domain. Fig. 2 shows the details of the registration process for two of the low resolution data sets. Figs. 2(a) and 2(b) show the phase variation of the full phase correlation matrix along two separate slices. The dominant feature is a consistent linear variation of the phase across the plane shown. This indicates that the difference between the two data sets is predominantly a translation. The phase component of the dominant singular vectors of Q is shown in Fig. 2(c). The lines are quite linear, providing very high quality estimates of the sub-pixel translational shift between the two data sets. In this case the estimated shift values are t1 = −0.19355, t2 = 0.52966, and t3 = −0.54707. After estimating and correcting for the shifts between the three data sets, the data was combined in the Fourier domain according to the number of data sets contributing to a particular coordinate of k-space. Thus, in the central cube, the data values were divided by three and then summed. In the “arms” of the overlap where two data sets contribute, the data values were divided by two and then summed. In the non-overlap regions the data was left unaltered. Fig. 3 shows a comparison between images constructed from one of the original low-resolution data sets, images constructed from the data combination result, and images formed from a 128 × 128 × 128 data set acquired directly from the MR scanner. The images from the combined data in the central column of the figure show improved resolution over the low-resolution data, with comparable quality to the true high-resolution images. In FSE MRI acquisitions, the image acquisition time is roughly proportional to the amount of k-space data acquired. For this example, the acquisition time for all three low resolution data sets is approximately 25% less (i.e. 3 · 32/128 = 0.75) than the acquisition time of the high
2
22
1
0
0
−21
−1
−42
−2
−64 −64 −43 −22 0 21 42 64 coordinate index along dimension 2 [ l 2 ]
−3
2
3
43
64
Phase values along Q(64,:,:) 3
43
2
22
1
0
0
−21
−1
−42
−2
−64 −64 −43 −22 0 21 42 64 coordinate index along dimension 3 [ l 3 ]
−3
(a) Phase of Q for a slice along l3 (b) Phase of Q for a slice along l1 4
Phase character of dominant singular vectors
3 2 phase (in radians)
64
Phase values along Q(:,:,64)
64
coordinate index along dimension 2 [ l ]
coordinate index along dimension 1 [ l 1 ]
k−space distribution of the three data sets
1 0 −1 −2
dimension 1 dimension 2 dimension 3
−3 −4 −15
−10
−5 0 5 10 coordinate index [ l 1 , l 2 , or l 3 ]
15
(c) phase variation across each dominant singular vector of Q
Fig. 2. Analysis of phase correlation matrix Q to determine magnitude of the translational shift between two data sets. resolution data set. The images in Fig. 3 were acquired via broad-band excitation, exciting all of the tissue spins in the magnet. We anticipate that improved acquisition times, via better low-resolution to high-resolution ratios, will be possible by exciting spins only in the field of view to be acquired. Such selective excitation methods would provide further reduction of the 3D image acquisition time, with negligible loss in image quality. 4. CONCLUDING REMARKS The method described above is a straight-forward extension of the subspace identification method in [4] to multidimensional data. Thus, all of the features of robustness to noise, simplicity of implementation, and subpixel resolution found in the original method are directly applicable here. Proficient use of the method was demonstrated via construction of a 3D high resolution image from three separate low-resolution data sets. We are currently investigating including rotation in the 3D-PCM registration, following the ideas given in [7]. 5. REFERENCES [1] C. D. Kuglin and D. C. Hines, “The phase correlation image alignment method,” in Proc. Int. Conf. on Cyber-
pg. 707-710 of Proc. IEEE Intl Conf Image Processing. Barcelona, Spain. 14-17 Sept 2003. Copyright IEEE
(a) Sagital View. 1 Data Set.
(b) Sagital View. 3 data sets combined.
(c) Sagital View. True 3D data set.
(d) Axial View. 1 Data Set.
(e) Axial View. 3 data sets combined.
(f) Axial View. True 3D data set.
(g) Coronal View. 1 Data Set.
(h) Coronal View. 3 data sets combined.
(i) Coronal View. True 3D data set.
Fig. 3. Images reconstructed from a single 3D data set compared to full resolution data merged from three data sets. Images in the left column are formed from a single 128 × 128 × 32 data set with low resolution along the left-right axis. Images in the center column are formed after registration and combination of three low resolution sets. The high resolution images so formed are of comparable quality to the full high-resolution 3D data images, shown in the right column. netics and Society, pp. 163–165, IEEE, Sep. 1975. [2] H. Foroosh, J. B. Zerubia, and M. Berthod, “Extension of phase correlation to subpixel registration,” IEEE Trans. Image Processing, vol. 11, no. 3, pp. 188–200, Mar. 2002. [3] H. S. Stone, M. Orchard, E.-C. Chang, and S. Martucci, “A fast direct Fourier-based algorithm for subpixel registration of images,” IEEE Trans. Geosci. Remote Sensing, vol. 39, no. 10, pp. 2235–2243, Oct. 2001. [4] W. S. Hoge, “Subspace identification extension to the phase correlation method,” IEEE Trans. Medical Imaging, vol. 22, no. 2, pp. 277–280, Feb. 2003.
[5] L. De Lathauwer, B. De Moor, and J. Vandewalle, “A multilinear singular value decomposition,” SIAM J. Matrix Anal. Appl., vol. 21, no. 4, pp. 1253–1278, 2000. [6] J. P. Mugler, 3rd, S. Bao, R. V. Mulkern, C. R. Guttmann, R. L. Robertson, F. A. Jolesz, and J. R. Brookeman, “Optimized single-slab three-dimensional spin-echo MR imaging of the brain,” Radiology, vol. 216, no. 3, pp. 891–9, Sep. 2000. [7] B. S. Reddy and B. N. Chatterji, “An FFT-based technique for translation, rotation, and scale-invariant image registration,” IEEE Trans. Image Processing, vol. 5, no. 8, pp. 1266–1271, Aug. 1996.
pg. 707-710 of Proc. IEEE Intl Conf Image Processing. Barcelona, Spain. 14-17 Sept 2003. Copyright IEEE