Temperature in degrees Celsius (°C) may be converted to degrees Fahrenheit (°F) as follows: ... and 08070200 East Fork San Jacinto River near New Caney,.
Prepared in cooperation with the City of Houston
Regression Model Development and Computational Procedures to Support Estimation of Real-Time Concentrations and Loads of Selected Constituents in Two Tributaries to Lake Houston near Houston, Texas, 2005–9
Scientific Investigaitons Report 2012–5006
U.S. Department of the Interior U.S. Geological Survey
Regression Model Development and Computational Procedures to Support Estimation of Real-Time Concentrations and Loads of Selected Constituents in Two Tributaries to Lake Houston near Houston, Texas, 2005–9 By Michael T. Lee, William H. Asquith, and Timothy D. Oden
Prepared in cooperation with the City of Houston
Scientific Investigaitons Report 2012–5006
U.S. Department of the Interior U.S. Geological Survey
U.S. Department of the Interior KEN SALAZAR, Secretary U.S. Geological Survey Marcia K. McNutt, Director
U.S. Geological Survey, Reston, Virginia: 2012
This and other USGS information products are available at http://store.usgs.gov/ U.S. Geological Survey Box 25286, Denver Federal Center Denver, CO 80225 To learn about the USGS and its information products visit http://www.usgs.gov/ 1-888-ASK-USGS
Any use of trade, product, or firm names is for descriptive purposes only and does not imply endorsement by the U.S. Government. Although this report is in the public domain, permission must be secured from the individual copyright owners to reproduce any copyrighted materials contained within this report.
Suggested citation: Lee, M.T., Asquith, W.H., and Oden, T.D., 2012, Regression model development and computational procedures to support estimation of real-time concentrations and loads of selected constituents in two tributaries to Lake Houston near Houston, Texas, 2005–9: U.S. Geological Survey Scientific Investigations Report 2012–5006, 40 p.
iii
Contents Abstract ...........................................................................................................................................................1 Introduction.....................................................................................................................................................1 Purpose and Scope ..............................................................................................................................3 Description of Study Area ...................................................................................................................3 Methods..................................................................................................................................................4 Streamflow Measurements ................................................................................................................4 Continuous Water-Quality Monitoring...............................................................................................4 Discrete Water-Quality Sample Collection, Analysis, and Results ..............................................5 Sample Design and Collection ...................................................................................................5 Sample Analysis ...........................................................................................................................5 Quality Control ..............................................................................................................................8 Regression Model Development .................................................................................................................8 Retransformation Bias Correction ............................................................................................9 Analysis of Censored Data .......................................................................................................10 Censored Data at Spring Creek and East Fork San Jacinto River Site ............................10 Regression Analysis Summaries and Presentation of Equations......................................10 Computational Procedures of Concentration and Loads ......................................................................23 Summary........................................................................................................................................................23 References ....................................................................................................................................................24 Appendixes ...................................................................................................................................................27
Figures 1.
2.
3.
4.
5.
6.
7.
Lake Houston watershed and tributary subwatersheds and location of U.S. Geological Survey streamflow-gaging stations 08068500 Spring Creek near Spring, Texas, and 08070200 East Fork San Jacinto River near New Caney, Tex ...........................................................2 Flow duration curve and corresponding discrete water-quality samples, (A) Spring Creek near Spring, Texas, and (B) East Fork San Jacinto River near New Caney, Tex .............................................................................6 Abbreviations of mathematical functions and statistical terms related to regression analysis of water-quality constituents shown in figures 4–14 ...........................................................................................................11 Summary of regression analysis for nitrite plus nitrate nitrogen for U.S. Geological Survey streamflow-gaging station 08068500 Spring Creek near Spring, Texas, 2005–9 ..........................................................................12 Summary of regression analysis for total phosphorus for U.S. Geological Survey streamflow-gaging station 08068500 Spring Creek near Spring, Texas, 2005–9 ..........................................................................13 Summary of regression analysis for total organic carbon for U.S. Geological Survey streamflow-gaging station 08068500 Spring Creek near Spring, Texas, 2005–9 ..........................................................................14 Summary of regression analysis for Escherichia coli for U.S. Geological Survey streamflow-gaging station 08068500 Spring Creek near Spring, Texas, 2005–9 ..........................................................................15
iv
8.
9.
10.
11.
12.
13.
14.
Summary of regression analysis for atrazine for U.S. Geological Survey streamflow-gaging station 08068500 Spring Creek near Spring, Texas, 2005–9. .........................................................................16 Summary of regression analysis for suspended sediment for U.S. Geological Survey streamflow-gaging station 08068500 Spring Creek near Spring, Texas, 2005–9. .........................................................................17 Summary of regression analysis for nitrite plus nitrate nitrogen for U.S. Geological Survey streamflow-gaging station 08070200 East Fork San Jacinto River near New Caney, Texas, 2005–9. ......................................18 Summary of regression analysis for total phosphorus for U.S. Geological Survey streamflow-gaging station 08070200 East Fork San Jacinto River near New Caney, Texas, 2005–9. ......................................19 Summary of regression analysis for total organic carbon for U.S. Geological Survey streamflow-gaging station 08070200 East Fork San Jacinto River near New Caney, Texas, 2005–9. ......................................20 Summary of regression analysis for Escherichia coli for U.S. Geological Survey streamflow-gaging station 08070200 East Fork San Jacinto River near New Caney, Texas, 2005–9. ......................................21 Summary of regression analysis for suspended sediment for U.S. Geological Survey streamflow-gaging station 08070200 East Fork San Jacinto River near New Caney, Texas, 2005–9. ......................................22
Tables 1. 2.
Subwatershed drainage areas for tributaries to Lake Houston near Houston, Texas ...............................................................................................................4 Summary statistics for samples collected at two tributaries to Lake Houston near Houston, Texas, 2005–9 ...................................................................6
v
Conversion Factors, Datums, and Water-Quality Units Inch/Pound to SI Multiply
By
inch (in.)
Length 25.4
mile (mi)
1.609
To obtain millimeter (mm) kilometer (km)
Area square mile (mi )
2.590
2
square kilometer (km2)
Flow rate cubic foot per second (ft /s) 3
0.02832
cubic meter per second (m3/s)
Mass pound, avoirdupois (lb)
0.4536
kilogram (kg)
Temperature in degrees Celsius (°C) may be converted to degrees Fahrenheit (°F) as follows: °F=(1.8×°C)+32
Datums Vertical coordinate information is referenced to the North American Vertical Datum of 1988 (NAVD 88). Horizontal coordinate information is referenced to the North American Datum of 1983 (NAD 83). Altitude, as used in this report, refers to distance above the vertical datum.
Water-Quality Units Specific conductance is given in microsiemens per centimeter at 25 degrees Celsius (µS/cm at 25 °C). Concentrations of chemical constituents in water are given in either milligrams per liter (mg/L) or micrograms per liter (µg/L). Bacteria are given in most-probable number per 100 milliliters (MPN/100 mL). Turbidity is given in Formazine Nephelometric Units (FNU).
Regression Model Development and Computational Procedures to Support Estimation of Real-Time Concentrations and Loads of Selected Constituents in Two Tributaries to Lake Houston near Houston, Texas, 2005–9 By Michael T. Lee, William H. Asquith, and Timothy D. Oden
Abstract In December 2005, the U.S. Geological Survey (USGS), in cooperation with the City of Houston, Texas, began collecting discrete water-quality samples for nutrients, total organic carbon, bacteria (Escherichia coli and total coliform), DWUD]LQH��DQG�VXVSHQGHG�VHGLPHQW�DW�WZR�86*6�VWUHDPÀRZ� gaging stations that represent watersheds contributing to Lake Houston (08068500 Spring Creek near Spring, Tex., and 08070200 East Fork San Jacinto River near New Caney, Tex.). Data from the discrete water-quality samples collected during 2005–9, in conjunction with continuously monitored UHDO�WLPH�GDWD�WKDW�LQFOXGHG�VWUHDPÀRZ�DQG�RWKHU�SK\VLFDO� ZDWHU�TXDOLW\�SURSHUWLHV��VSHFL¿F�FRQGXFWDQFH��S+��ZDWHU� temperature, turbidity, and dissolved oxygen), were used to develop regression models for the estimation of concentrations of water-quality constituents of substantial source watersheds to Lake Houston. The potential explanatory variables LQFOXGHG�GLVFKDUJH��VWUHDPÀRZ ��VSHFL¿F�FRQGXFWDQFH��S+�� water temperature, turbidity, dissolved oxygen, and time (to account for seasonal variations inherent in some water-quality data). The response variables (the selected constituents) at each site were nitrite plus nitrate nitrogen, total phosphorus, total organic carbon, E. coli, atrazine, and suspended sediment. The explanatory variables provide easily measured quantities to serve as potential surrogate variables to estimate concentrations of the selected constituents through statistical regression. Statistical regression also facilitates accompanying estimates of uncertainty in the form of prediction intervals. Each regression model potentially can be used to estimate concentrations of a given constituent in real time. Among other regression diagnostics, the diagnostics used as indicators of general model reliability and reported herein include the adjusted R-squared, the residual standard error, residual plots, and p-values. Adjusted R-squared values for the Spring Creek models ranged from .582–.922 (dimensionless). The residual standard errors ranged from .073–.447 (base-10 logarithm). Adjusted R-squared values for the East Fork San Jacinto River models ranged from .253–.853 (dimensionless). The residual
standard errors ranged from .076–.388 (base-10 logarithm). In conjunction with estimated concentrations, constituent loads can be estimated by multiplying the estimated concentration E\�WKH�FRUUHVSRQGLQJ�VWUHDPÀRZ�DQG�E\�DSSO\LQJ�WKH� appropriate conversion factor. The regression models SUHVHQWHG�LQ�WKLV�UHSRUW�DUH�VLWH�VSHFL¿F��WKDW�LV��WKH\�DUH� VSHFL¿F�WR�WKH�6SULQJ�&UHHN�DQG�(DVW�)RUN�6DQ�-DFLQWR�5LYHU� VWUHDPÀRZ�JDJLQJ�VWDWLRQV��KRZHYHU��WKH�JHQHUDO�PHWKRGV� that were developed and documented could be applied to most perennial streams for the purpose of estimating real-time water quality data.
Introduction Houston, Texas, is the fourth largest city in the United States, with an estimated population of about 5.9 million people in 2009 (Texas State Data Center, 2011). Historically, groundwater has been the major source of supply for the &LW\�RI�+RXVWRQ��KRZHYHU��GHYHORSPHQW�RI�JURXQGZDWHU� resources has contributed to deleterious water-level declines DQG�ODQG�VXUIDFH�VXEVLGHQFH��.DVPDUHN�DQG�6WURP�������� Kasmarek and others, 2010). Lake Houston is a surface-water- supply reservoir for the city of Houston and currently (2011) supplies between 10 and 20 percent of the total source-water supply (City of Houston, 2011). Furthermore, as a result of regulations restricting groundwater withdrawals for the purpose of mitigating or arresting land-surface subsidence, Lake Houston is expected to become the primary source of ZDWHU�IRU�WKH�FLW\�LQ�WKH�IXWXUH��WKH�RYHUDOO�JRDO�LV�WR�LQFUHDVH� the use of surface water to no less than 80 percent of the total demand by 2030 (Harris-Galveston Subsidence District, 1999). Because Lake Houston is a major source of potable water and also a recreation resource for the Houston area, the possible effects of urbanization on the water quality of tributaries to Lake Houston are of interest to water managers and planners. Two of the seven tributaries to Lake Houston, 6SULQJ�&UHHN�DQG�(DVW�)RUN�6DQ�-DFLQWR�5LYHU��¿J��� ��
2
Regression Model Development and Computational Procedures in Two Tributaries to Lake Houston, 2005–9
95°30'
East Fork San Jacinto River
WALKER
30°30'
West Fork San Jacinto River GRIMES
SAN JACINTO
Lake Conroe
WESTERN SUBBASIN
EASTERN SUBBASIN
95°00'
Peach Creek LIBERTY
MONTGOMERY
Caney Creek 08070200
WALLER
Spring Creek
Luce Bayou
08068500
Lake Houston
HARRIS 30°00'
Cypress Creek Lake Houston 0
Base from Houston-Galveston Area Council, 2004 Lake Houston watershed, 1:602,933 Universal Transverse Mercator projection, Zone 15
EXPLANATION
0
10 10
20 MILES 20 KILOMETERS
Study area
Subbasin boundary Subwatershed boundary U.S. Geological Survey
08068500 streamflow-gaging station
TEXAS
and number
Houston
Lake Houston watershed
Location of study area and Houston, Texas
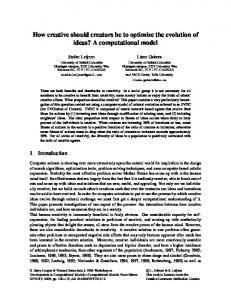
Figure 1. Lake Houston watershed and tributary subwatersheds and location of U.S. Geological Survey streamflow-gaging stations 08068500 Spring Creek near Spring, Texas, and 08070200 East Fork San Jacinto River near New Caney, Tex.
Introduction representing approximately 31 percent of the drainage area for tributaries to Lake Houston, are the focus of this report. In compliance with the Federal Clean Water Act, the Texas Commission on Environmental Quality compiles and maintains an inventory, commonly known as the “303(d) list,” of water bodies that are either impaired (do not meet applicable State water-quality standards) or threatened (are not expected to meet standards in the future) (Texas Commission on Environmental Quality, 2011). Lake Houston �VHJPHQW����� �¿UVW�DSSHDUHG�LQ������DQG�DJDLQ�LQ������RQ� the inventory for bacteria. All of Spring Creek (segment 1008) has been listed on the 303(d) list for bacteria since 1996, and one portion of Spring Creek has been listed for depressed dissolved oxygen concentrations that are not conducive to healthy ecosystems since 1996. In addition, the East Fork San -DFLQWR�5LYHU��VHJPHQW����� �¿UVW�DSSHDUHG�RQ�WKH�����G �OLVW� in 2006 for bacteria and was still listed in the 2008 303(d) list. The U.S. Geological Survey (USGS) and the City of Houston maintain a cooperative program to monitor water quality in Lake Houston and its contributing watersheds. Watershed water-quality monitoring began in December 2005 and is currently (2012) ongoing. Continuous, real- WLPH�PRQLWRULQJ�RI�VWUHDPÀRZ�DQG�ZDWHU�TXDOLW\�SURSHUWLHV� �VSHFL¿F�FRQGXFWDQFH��S+��ZDWHU�WHPSHUDWXUH��WXUELGLW\��DQG� dissolved oxygen) in Spring Creek and East Fork San Jacinto River are collected to alert drinking-water managers to potential changes in quality of water entering Lake Houston. 7KH�FRQWLQXRXVO\�PRQLWRUHG�VWUHDPÀRZ�DQG�ZDWHU�TXDOLW\� properties, in conjunction with regression-equation modeling using those data as surrogates for selected constituents (nitrite plus nitrate nitrogen, total phosphorus, total organic carbon, Escherichia coli, atrazine, and suspended sediment) can be used to estimate concentrations for constituents lacking continuous record. The estimated concentrations can be used to compute estimated constituent loads (a value proportional to WKH�SURGXFW�RI�VWUHDPÀRZ�DQG�FRQFHQWUDWLRQ ��2GHQ�DQG�RWKHUV� (2009) developed regression models to estimate constituent concentrations on Spring Creek and East Fork San Jacinto River based on data collected from 2005–7. With near real-time water-quality data for the tributaries (every 15 minutes), water managers and planners will be able WR�LGHQWLI\�SRWHQWLDO�HIIHFWV�RI�WULEXWDU\�LQÀRZV�RQ�WKH�ZDWHU� TXDOLW\�RI�/DNH�+RXVWRQ�ZLWK�VXI¿FLHQW�DOHUW�WLPH�DQG�DGMXVW� drinking-water plant operations accordingly. In addition, over time the results of tributary water-quality monitoring will contribute to the broader understanding of watershed LQÀXHQFHV�RQ�/DNH�+RXVWRQ�DQG�WKH�HIIHFWV�RI�WKRVH�LQÀXHQFHV� on Lake Houston as a drinking water and recreational resource.
Purpose and Scope This report documents updates that were made to SUHYLRXVO\�SXEOLVKHG��2GHQ�DQG�RWKHUV������ �UHJUHVVLRQ� models developed using data collected during 2005–7 to estimate real-time concentrations of nitrite plus nitrate,
3
total phosphorus, total organic carbon, E. coli, atrazine, and suspended sediment in two tributaries to Lake Houston: Spring Creek and East Fork San Jacinto River. The regression models were updated using data collected during 2005–9. Real-time (every 15-minutes), continuously measured VWUHDPÀRZ�DQG�ZDWHU�TXDOLW\�SURSHUWLHV��VSHFL¿F�FRQGXFWDQFH�� S+��ZDWHU�WHPSHUDWXUH��WXUELGLW\��DQG�GLVVROYHG�R[\JHQ �� discrete water-quality samples analyzed for nitrite plus nitrate, total phosphorus, total organic carbon, E. coli, atrazine, and VXVSHQGHG�VHGLPHQW��DQG�WLPH�DV�DQ�DGGLWLRQDO�H[SODQDWRU\� variable for seasonality were used in the models. The data ZHUH�FROOHFWHG�DW�WZR�86*6�VWUHDPÀRZ�JDJLQJ�VWDWLRQV�� 08068500 Spring Creek near Spring, Tex. (hereinafter the Spring Creek site), and 08070200 East Fork San Jacinto River near New Caney, Tex. (hereinafter the East Fork San Jacinto River site). The regression models for each constituent are presented for each site. Lastly, examples of detailed computational analysis are provided to give the reader a step-by-step algorithmic or procedural guideline to independently use the regression models herein to calculate constituent concentrations, 90-percent prediction intervals, and instantaneous loads. Results from these regression models can be used to EHWWHU�XQGHUVWDQG�ÀXFWXDWLRQV�RI�FRQFHQWUDWLRQ�DQG�ORDGV� GXULQJ�FKDQJLQJ�VHDVRQV�DQG�ÀRZ�FRQGLWLRQV�DQG�WR�DVVHVV� water-quality conditions relative to total maximum daily load goals and water-quality standards. The information also is useful for evaluating loading characteristics, such as range and variability, and for determining effectiveness of best management practices (Rasmussen and others, 2008). :KLOH�WKLV�UHSRUW�VHUYHV�SULPDULO\�DV�DQ�XSGDWH�WR�2GHQ� and others (2009), the 2 years of additional data used to XSGDWH�WKH�PRGHOV�DOVR�H[WHQGV�WKH�VFLHQWL¿F�DQG�VWDWLVWLFDO� XQGHUVWDQGLQJ�EHWZHHQ�FRQWLQXRXVO\�PHDVXUHG�VWUHDPÀRZ� and water-quality properties and constituent concentrations measured in the laboratory. The regression models presented in this report are therefore considered to represent actual conditions more accurately than the earlier report and should serve as a replacement to previous models and the primary source for constituent concentration and load calculations.
Description of Study Area Lake Houston is about 25 miles northeast of Houston, Tex. The watershed of Lake Houston comprises the subwatersheds of seven tributaries and the area immediately DGMDFHQW�WR�WKH�ODNH�LQ�SDUWV�RI�VHYHQ�FRXQWLHV��¿J��� �� including large areas of densely populated Harris and Montgomery Counties. Sneck-Fahrer and others (2005) divided the Lake Houston watershed into eastern and western subbasins, primarily on the basis of relative amounts of development, with the eastern subbasin being less developed than the western subbasin. The western subbasin encompasses three tributary subwatersheds, and the eastern subbasin encompasses four tributary subwatersheds (table 1). The study area of this report consists of subwatersheds from the western
4
Regression Model Development and Computational Procedures in Two Tributaries to Lake Houston, 2005–9
Table 1. Subwatershed drainage areas for tributaries to Lake Houston, near Houston, Texas (modified from Sneck-Fahrer and others, 2005). Subwatershed
Drainage area (square miles)
Western subbasin West Fork San Jacinto River
998
Spring Creek1
453
Cypress Creek
305 Eastern Subbasin
East Fork San Jacinto River1
404
Peach Creek
151
Caney Creek
222
Luce Bayou
210
1 Subwatershed for which regression analysis was used to develop predictive equations in this report.
and eastern subbasins— Spring Creek in the western subbasin and East Fork San Jacinto River in the eastern subbasin. The Spring Creek subwatershed in the western subbasin is the second most densely populated of the seven Lake Houston subwatersheds, with a population density in 2000 of about 390 people per square mile (U.S. Census Bureau, 2000). Urban and agricultural land account for about 41 percent of the 453 square miles of the subwatershed and the predominant ODQG�XVH�FODVVL¿FDWLRQ�LV�IRUHVW�����SHUFHQW ��0XOWL�5HVROXWLRQ� Land Characteristics Consortium, 2003). The East Fork San Jacinto River subwatershed in the eastern subbasin is the least densely populated of the seven subwatersheds that drain to Lake Houston, with a population density in 2000 of about 80 people per square mile (U.S. Census Bureau, 2000). Urban and agricultural land together account for about 18 percent of the 404 square miles of the subwatershed and, as in the Spring Creek subwatershed, the SUHGRPLQDQW�ODQG�XVH�FODVVL¿FDWLRQ�LQ�WKH�VXEZDWHUVKHG�LV� forest (47 percent) (Multi-Resolution Land Characteristics Consortium, 2003). 7KH�FOLPDWH�LQ�WKH�VWXG\�DUHD�LV�FODVVL¿HG�DV�KXPLG� subtropical (Texas State Climatologist, 2011), characterized by cool, temperate winters and long, hot summers with high humidity. During 2005–9, annual rainfall ranged from 41.2 to 65.5 inches at George Bush Intercontinental Airport, Houston, 7H[���1DWLRQDO�2FHDQLF�DQG�$WPRVSKHULF�$GPLQLVWUDWLRQ�� 2011).
Methods Streamflow Measurements 6WUHDPÀRZ�LV�WKH�YROXPH�RI�ZDWHU�SDVVLQJ�DQ�HVWDEOLVKHG� reference point in a stream at a given time. Methods used to GHWHUPLQH�VWUHDPÀRZ��GLVFKDUJH �DUH�GHVFULEHG�LQ�%XFKDQDQ� and Somers (1969) and Turnipseed and Sauer (2010). 6WUHDPÀRZ�PHDVXUHPHQWV�GXULQJ�WKH�FRXUVH�RI�WKH�VWXG\� �����±� �ZHUH�PDGH�DERXW�¿YH�WLPHV�SHU�\HDU�DW�WKH�6SULQJ� &UHHN�VLWH�DQG�DERXW�¿YH�WLPHV�SHU�\HDU�DW�WKH�(DVW�)RUN�6DQ� Jacinto River site. Stage, or gage height, was measured every 15 minutes by using submersible pressure transducers (or other conventional stage-measurement technology as needed) to the nearest 0.01 foot at the Spring Creek and East Fork San Jacinto River sites. The data were electronically recorded and transmitted by satellite to a downlink site and then to the USGS Texas Water Science Center in Austin, Tex. Discharge measurements in this study were made to verify and modify a VWDJH�GLVFKDUJH�UHODWLRQ�GHYHORSHG�RQ�WKH�EDVLV�RI�VWUHDPÀRZ� measurements and the stage of the stream at the time of measurement (Kennedy, 1984). These unique relations were XVHG�WR�FRPSXWH�D�FRQWLQXRXV�UHFRUG�RI�VWUHDPÀRZ��.HQQHG\�� 1983) from the stage record at each site. Instantaneous stage DQG�VWUHDPÀRZ�YDOXHV�DUH�VWRUHG�LQ�WKH�86*6�1DWLRQDO�:DWHU� Information System (NWIS) database (U.S. Geological Survey, 2011).
Continuous Water-Quality Monitoring Continuous monitoring of four physical properties �VSHFL¿F�FRQGXFWDQFH��S+��ZDWHU�WHPSHUDWXUH��DQG�GLVVROYHG� oxygen) began at the Spring Creek site in November 1999 by using a multiparameter monitor. In November 2005, a multiparameter monitor was installed at the Spring Creek site to include turbidity. Continuous monitoring of VSHFL¿F�FRQGXFWDQFH��S+��ZDWHU�WHPSHUDWXUH��WXUELGLW\��DQG� dissolved oxygen began at the East Fork San Jacinto River VLWH�LQ�1RYHPEHU�������(DFK�RI�WKH�¿YH�VHQVRUV�RQ�WKH� multiparameter monitors were calibrated as described in the USGS “National Field Manual for the Collection of Water- 4XDOLW\�'DWD´��8�6��*HRORJLFDO�6XUYH\��YDULRXVO\�GDWHG ��WKH� continuous monitor and record were maintained as outlined in Wagner and others (2006). The Spring Creek and East Fork San Jacinto River sites feature a swinging well design for monitoring real-time water- quality properties. Swinging wells respond to and swing in WKH�GLUHFWLRQ�RI�WKH�IRUFH�RI�WKH�ÀRZLQJ�ZDWHU��7KH�ZHOOV�DUH� constructed of schedule 80 polyvinyl-chloride pipe with holes in the lower 3 feet, allowing water to pass through wherever
Introduction
5
a multiparameter monitor is located. Each multiparameter PRQLWRU�LV�SRVLWLRQHG�QHDU�WKH�FHQWURLG�RI�EDVH�ÀRZ�LQ�HDFK� stream in a swinging well. The data from each multiparameter monitor were electronically recorded and transmitted by satellite to a downlink site and then to the USGS Texas Water 6FLHQFH�&HQWHU�LQ�$XVWLQ��7H[��6SHFL¿F�FRQGXFWDQFH��S+�� water temperature, turbidity, and dissolved oxygen data are stored in the USGS NWIS database in 15-minute intervals. The Spring Creek and East Fork San Jacinto River sites at WKH�SUHVHQW������ �UHPDLQ�RSHUDWLRQDO�IRU�WKHVH�¿YH�SK\VLFDO� water-quality properties.
the sampling design during the course of the study (in terms RI�WLPLQJ�RU�UHVSRQGLQJ�WR�VSHFL¿F�K\GURORJLF�HYHQWV �DGGHG� considerable complexity to the effort of assessing temporal trends in the selected water-quality constituents. Discrete water-quality samples were collected either by ZDGLQJ��ZKHQ�ÀRZ�FRQGLWLRQV�SHUPLWWHG��RU�E\�VDPSOLQJ�IURP� EULGJHV�GXULQJ�KLJKHU�ÀRZV��$OO�VDPSOHV�ZHUH�FROOHFWHG�DQG� processed as described in the USGS “National Field Manual for the Collection of Water-Quality Data” (U.S. Geological Survey, variously dated). Depth-integrated samples were FROOHFWHG��E\�XVLQJ�D�7HÀRQ�ERWWOH�DQG�QR]]OH��HLWKHU�E\� multiple verticals when stream velocities were less than about ����IHHW�SHU�VHFRQG�RU�E\�WKH�ÀRZ�ZHLJKWHG��HTXDO�ZLGWK� Discrete Water-Quality Sample Collection, increment method when stream velocities were greater than Analysis, and Results about 1.5 feet per second. Samples from each vertical were FRPELQHG�LQ�D�7HÀRQ�FKXUQ��GLVSHQVHG�LQWR�DSSURSULDWH�VDPSOH� Discrete water-quality samples were manually collected containers, and shipped at 4 degrees Celsius (°C) by overnight at each sampling site. For this analysis, 58 samples were courier to appropriate laboratories. Samples for bacteria collected at the Spring Creek site, and 51 samples were collected at the East Fork San Jacinto River site. Samples were analysis were collected directly from the approximate centroid analyzed for nutrients, total organic carbon, bacteria, atrazine, RI�ÀRZ�LQ�VWHULOH��DXWRFODYHG�ERWWOHV� and suspended sediment. The actual number of results reported varied by constituent because of a variety of reasons, Sample Analysis for example, broken sample bottles, lost samples, or samples were determined to fail internal quality-assurance checks and Samples collected and analyzed for nutrients and total therefore reviewed and rejected. organic carbon were analyzed by the USGS National Water
Sample Design and Collection Hydrologic conditions in the Spring Creek and East Fork San Jacinto River sites vary and might affect chemical constituent concentrations, so discrete water-quality samples ZHUH�FROOHFWHG�RYHU�D�ZLGH�UDQJH�RI�VWUHDPÀRZ�FRQGLWLRQV� �¿J��� ��'LVFUHWH�ZDWHU�TXDOLW\�VDPSOHV�IRU�WKH�¿UVW�\HDU� (December 2005–November 2006) of this study were collected about every 2 weeks to facilitate detection of VHDVRQDO�SDWWHUQV�LQ�ZDWHU�TXDOLW\��6DPSOHV�DW�WKHVH�¿[HG� frequency sample times were collected as scheduled without regard to hydrologic condition, such as rising, falling, or VWDEOH�VWUHDPÀRZV��'XULQJ�VWRUPV�RU�SHULRGV�RI�KLJK�ÀRZ�� unscheduled samples were also periodically collected during WKH�¿UVW�\HDU�RI�WKH�VWXG\��'XULQJ�WKH�VHFRQG�DQG�WKLUG�\HDU�RI� the study (December 2006–December 2008) discrete water- quality samples were collected approximately once a month at both the Spring Creek and East Fork San Jacinto River sites. During the fourth year of the study (December 2008– December 2009), an approximate monthly sampling schedule was maintained for the Spring Creek site, whereas samples collected at East Fork San Jacinto River site were reduced WR�D�TXDUWHUO\�VFKHGXOH��,QVWHDG�RI�¿[HG�IUHTXHQF\�VDPSOLQJ� during the second through fourth years of the study, sampling focused on stormwater-runoff whenever possible. Changes to
Quality Laboratory, Denver, Colo., by using published methods. Methods for nutrient analysis are documented in Fishman (1993), U.S. Environmental Protection Agency �������PHWKRG������ ��DQG�3DWWRQ�DQG�7UXLWW������ ��7RWDO� organic carbon analysis is documented in Wershaw and others (1987). Suspended-sediment samples were analyzed by the USGS Sediment Laboratory in Baton Rouge, La. (December �����±�6HSWHPEHU����� ��RU�/RXLVYLOOH��.\���2FWREHU�����±� �� by using procedures described in Guy (1969) and Mathes and others (1992). Atrazine samples were analyzed by the 86*6�2UJDQLF�*HRFKHPLVWU\�5HVHDUFK�/DERUDWRU\��/DZUHQFH�� Kansas, by using the Enzyme-Linked Immunosorbent Assay (ELISA) method documented in Aga and Thurman (1997). E. coli and total coliform bacteria were analyzed at the Houston Lab at Shenandoah, Tex., within the Gulf Coast Program 2I¿FH�RI�WKH�86*6�7H[DV�:DWHU�6FLHQFH�&HQWHU�E\�XVLQJ�WKH� GH¿QHG�VXEVWUDWH�PHWKRG�GRFXPHQWHG�LQ�$PHULFDQ�3XEOLF� Health Association and others (2005) and were reported as most probable number per 100 milliliters (MPN/100 mL) with FRQ¿GHQFH�LQWHUYDOV�� Summary statistics of the discrete water-quality samples are summarized in table 2. The data for the Spring Creek and East Fork San Jacinto River sites are stored in the USGS NWIS database and can be publicly accessed online (U.S. Geological Survey, 2011).
6
Regression Model Development and Computational Procedures in Two Tributaries to Lake Houston, 2005–9 10,000 7,000 5,000
Streamflow, in cubic feet per second
A
3,000 2,000 1,000 700 500 300 200 100 70 50 30 20 10
0.1
1
2
5
10
20
30
50
70
80
90
95
98 99
99.9
Nonexceedance probability EXPLANATION Flow-duration curve of daily mean streamflow for October 1998–September 2010 Concurrent streamflow with water-quality sample for December 2005–October 2009
Figure 2. Flow duration curve and corresponding discrete water-quality samples, (A) Spring Creek near Spring, Texas, and (B) East Fork San Jacinto River near New Caney, Tex. B
10,000 7,000 5,000
Table 2. Summary statistics for samples collected from two tributaries to Lake Houston near Houston, Texas, 2005–9.
U.S. Geological Survey streamflow-gaging station name Spring Creek near Spring, Tex.
Streamflow, in cubic feet per second
3,000 1 >Q��QXPEHU�RI�VDPSOHV�����OHVV�WKDQ���(��HVWLPDWHG ��EROG�YDOXHV�LQGLFDWH�FKDQJH�LQ�VXPPDU\�VWDWLVWLF�IURP�2GHQ�DQG�RWKHUV������ �UHSRUW@ 2,000 1,000 700 500
U.S. 300 Geological 200 Survey stream100 flow-gaging station 70 number 50
08068500 30 20 10
East Fork San Jacinto River near New Caney, Tex.
0.1
08070200
Ammonia plus organic nitrogen, water, filtered (milligrams per liter as nitrogen)
Ammonia plus organic nitrogen, water, unfiltered (milligrams per liter as nitrogen)
Ammonia, water, filtered (milligrams per liter as nitrogen)
Minimum
0.48
0.64
�����
0.11
0.005
Maximum
1.25
2.28
0.41
8.08
0.24
2.12
0.037
Summary statistic
Median 1
2
Number of Samples
5
10
0.82 57
20
30
50
1.21
70
80
57 Nonexceedance probability
90
0.06 95
57
98 99
Nitrite plus nitrate, water, filtered (milligrams per liter as nitrogen)
57
Nitrite, water, filtered (milligrams per liter as nitrogen)
99.9
EXPLANATION Flow-duration curve of daily mean streamflow 2010������ Minimum 0.14 0.23for October 1998–September ����� Concurrent streamflow with water-quality sample for December 2005–October 2009
Maximum 0.74 1.29 0.05 0.51 Figure 2. Flow duration curve and corresponding discrete water-quality samples, (A) Spring Creek near Spring, Tex., and Median 0.43 E0.02 0.10 (B) East Fork San Jacinto River near New Caney, Tex.0.37 Number of 49 51 51 51 Samples Concentrations measured as less than the long-term method detection level (LT-MDL) are reported as less than the laboratory reporting level (LRL). Concentrations measured between the LT-MDL and LRL are reported but given an “E” remark code to indicate that they are semiquantitative (Childress and others, 1999). 1
57
��������
0.03 0.003 51
EXPLANATION Flow-duration curve of daily mean streamflow for October 1998–September 2010 Concurrent streamflow with water-quality sample for December 2005–October 2009
B
Introduction
10,000 7,000 5,000
Streamflow, in cubic feet per second
3,000 2,000 1,000 700 500 300 200 100 70 50 30 20 10
1
0.1
2
5
10
20
30
50
70
80
90
95
98 99
99.9
Nonexceedance probability EXPLANATION Flow-duration curve of daily mean streamflow for October 1998–September 2010 Concurrent streamflow with water-quality sample for December 2005–October 2009
Figure 2. Flow duration curve and corresponding discrete water-quality samples, (A) Spring Creek near Spring, Tex., and (B) East Fork San Jacinto River near New Caney, Tex.
Orthophosphate, water, filtered (milligrams per liter as phosphorus)
Phosphorus, water, filtered (milligrams per liter)
Phosphorus, water, unfiltered (milligrams per liter)
0.06
0.08
0.15
2.25
2.12
2.29
41,000
0.67
0.67
0.86
300
38,800
56
56
57
57
57
��������
0.013
0.054
0.059
0.075
0.25
0.02 51
0.034 51
0.098 51
Escherichia coli, Colilert Quantitray method, water (most probable number per 100 milliliters)
Total coliform, Colilert Quantitray method, water (most probable number per 100 milliliters)
20.00
13.20
43,500
2,420 1,300,000
1,000
260,250
108
9,200
49
49
Atrazine, water, filtered, recoverable, immunoassay, unadjusted (micrograms per liter)
Organic carbon, water, unfiltered (milligrams per liter)
Suspended sediment (milligrams per liter)
����
7.51
15
21.00
987
14 0.80 57
����
0.53 ���� 51
11.53
44.5
55
58
3.97
6
32.64
362
7.77
25
50
49
7
8
Regression Model Development and Computational Procedures in Two Tributaries to Lake Houston, 2005–9
Quality Control
UHVXOWV�DUH�UHSRUWHG�ZLWK�D����SHUFHQW�FRQ¿GHQFH�LQWHUYDO� DQG�XSSHU�DQG�ORZHU�FRQ¿GHQFH�LQWHUYDOV��6WRHFNHO�DQG� Quality-control (QC) samples were collected as described others, 2005). The RPD exceeded 30 percent for 8 of 38 in the USGS “National Field Manual for the Collection bacteriological sample pairs. Mean and median RPDs for all of Water-Quality Data” (variously dated) and analyzed by bacteriological samples, however, were 19 percent and 15 the same laboratories and methods as the environmental SHUFHQW��UHVSHFWLYHO\��7KH�FRQ¿GHQFH�LQWHUYDOV�IRU�WKH�HLJKW� VDPSOHV��4&�VDPSOHV�LQFOXGHG�HTXLSPHQW�EODQNV��¿HOG�EODQNV�� replicate samples with RPDs exceeding 30 percent overlapped, and split replicate samples. QC samples were collected to LQGLFDWLQJ�WKHUH�ZHUH�QR�VWDWLVWLFDOO\�VLJQL¿FDQW�GLIIHUHQFHV� between replicate samples. Additionally, seven of the eight evaluate any contamination as well as bias and variability replicate samples with RPDs that exceeded 30 percent of the water chemistry data that might have resulted from originated from the Spring Creek site. Environmental sample sample collection, processing, transportation, and laboratory analysis. Equipment blanks were collected about annually in a and associated QC sample pair results are listed in appendix 1. controlled environment to determine if the cleaning procedures for sample containers and the equipment for sample collection DQG�VDPSOH�SURFHVVLQJ�ZHUH�VXI¿FLHQW�WR�SURGXFH�FRQWDPLQDQW� free samples. Field blanks were collected and processed at sampling sites prior to the collection of environmental samples The R environment for statistical computing (R Split replicate samples (referred to as replicate samples in this Development Core Team, 2010) was used to develop report) were collected and are prepared by dividing a single algebraically representable, multiple-linear regression volume of water into multiple samples to provide a measure HTXDWLRQV��)DUDZD\��������+HOVHO�DQG�+LUVFK�������� of the variability of sample processing and analysis. Replicate +HOVHO��������0DLQGRQDOG�DQG�%UDXQ������ �WR�HVWLPDWH� samples were compared to the associated environmental concentrations for selected water-quality constituents and samples by calculating the relative percent difference (RPD) HVWLPDWH�SUHGLFWLRQ�LQWHUYDOV�RU�TXDQWL¿FDWLRQ�RI�XQFHUWDLQW\�� for each constituent. RPD was computed by using the equation The authors used an open-source computational environment (the R environment for statistical computing) because the code RPD = |C1 – C2| / ((C1 + C2)/2) x 100 (1) syntax in this environment accommodates the syntax required for mathematical operations, and because the R environment is where available free of charge to readers and is available for different C1 = concentration from environmental sample, and computer platforms. C2 = concentration from replicate sample. The regression models reported here are based on selected statistical relations between the constituent RPDs of 10 percent or less indicate good agreement concentration acquired during discrete sampling and EHWZHHQ�DQDO\WLFDO�UHVXOWV�LI�WKH�FRQFHQWUDWLRQV�DUH�VXI¿FLHQWO\� contemporaneous values of predictor variables that normally greater compared to the laboratory reporting level. The RPD are measured continuously at a particular site (East Fork exceeded 10 percent for 8 of the 80 sample pairs of nutrients, San Jacinto River or Spring Creek). Each equation provides 6 of 10 for total organic carbon, 3 of 11 for atrazine, and 6 of estimates of the concentration of a single constituent as 11 for suspended sediment. The RPD exceeded 10 percent opposed to multivariate equations/methods that can provide primarily when constituent concentrations were at or near the for simultaneous estimation and inference of an ensemble of LRL so that small variability in analysis caused large RPDs. FRQVWLWXHQWV��PXOWLYDULDWH�WHFKQLTXHV�DUH�RXWVLGH�RI�WKH�VFRSH� Cases for which the analyte in both of the samples either RI�WKLV�UHSRUW��7KH�UHODWLRQ�EHWZHHQ�VSHFL¿F�PHDVXUHPHQWV� was not detected or was detected at a concentration less than DQG�DVVRFLDWHG�UHJUHVVLRQ�HTXDWLRQV�DUH�VLWH�VSHFL¿F��DQG�HDFK� WKH�/5/�ZHUH�GH¿QHG�DV�LQ�DJUHHPHQW��&DVHV�IRU�ZKLFK�WKH� equation is uniquely applicable for a particular site, but the analyte was detected at a concentration equal to or greater than methods could be applied to most perennial streams for the the LRL in one of the samples and not detected or detected purpose of estimating real-time water quality data. DW�D�FRQFHQWUDWLRQ�OHVV�WKDQ�WKH�/5/�ZHUH�GH¿QHG�DV�EHLQJ� 7KH�SRWHQWLDO�SUHGLFWRU�YDULDEOHV�LQFOXGHG�VWUHDPÀRZ�� in nonagreement. This distinction was necessary because of VSHFL¿F�FRQGXFWDQFH��S+��ZDWHU�WHPSHUDWXUH��WXUELGLW\�� a few instances in which an analyte was not detected or was dissolved oxygen, and various trigonometric functions of detected at a concentration less than the LRL. time (days into the year). Time was used when necessary The 19 bacteriological replicate samples were analyzed to accommodate systematic seasonal variations of some in the same manner as the environmental samples. The constituents. The predictor variables are measured at the acceptable RPD for bacteriological replicate samples was comparatively frequent sampling rate of every 15 minutes set at 30 percent. The Colilert method used for E. coli and compared to the discrete sampling (intervals of every 2 weeks total coliform allows the simultaneous detection of E. coli or longer) for the constituents. Lastly, the instantaneous and total coliform and is reported as most probable number. daily load of a constituent can be estimated by multiplying Most probable number analyses result in a statistical estimate the estimated constituent concentration (mass per volume) RI�WKH�RULJLQDO�QXPEHU�RI�FHOOV�LQ�D�NQRZQ�YROXPH�RI�ZDWHU�� E\�FRQWHPSRUDQHRXV�VWUHDPÀRZ��YROXPH�SHU�WLPH ��
Regression Model Development
Regression Model Development accommodation of requisite unit-conversion factors, and applying an appropriate bias correction factor. The application of multiple-linear regression equations to estimate constituent concentration and subsequent load HVWLPDWLRQ�LV�ZHOO�GRFXPHQWHG��IRU�H[DPSOH��VHH�&KULVWHQVHQ� and others (2000), Ryberg (2006), and Rasmussen and others (2009). Normally distributed response and explanatory variables with linear relations and constant variance are required for highly reliable equations. Logarithmic transformations on the response and explanatory variables are commonly used to improve linearity and to mitigate for nonnormality and heteroscedasticity (nonconstant variance about the regression line) in model residuals (Helsel and Hirsch, 2002). Consideration of nonlogarithmic WUDQVIRUPDWLRQV�KDYH�EHHQ�SUHYLRXVO\�PDGH��2GHQ�DQG� others, 2009) with a subset of the data considered in this UHSRUW��KRZHYHU��DGGLWLRQDO�DQDO\VLV�DQG�LPSOHPHQWDWLRQ� considerations resulted in a decision by the authors to exclusively use logarithmic transformation (base-10) trigonometric operations. 7KH�FRHI¿FLHQW�RI�GHWHUPLQDWLRQ��5�VTXDUHG��GHVFULEHV� the proportion of the total sample variability in the response H[SODLQHG�E\�WKH�UHJUHVVLRQ�PRGHO��7KH�FRHI¿FLHQW�ZLOO�RQO\� increase as additional explanatory variables are added to the model, thus it might not be an appropriate criterion for determining the usefulness of a model that has numerous explanatory variables. The adjusted R-squared statistic compensates for this by assessing a “penalty” for the number RI�H[SODQDWRU\�YDULDEOHV�LQ�WKH�PRGHO��DGGLQJ�DGGLWLRQDO� explanatory variables increases the value of adjusted R-squared only when the predictive capability of the model increases. Choosing a model with the highest adjusted R-squared value is equivalent to choosing a model with the lowest mean standard error (Helsel and Hirsch, 2002). For the current (2012) investigation, reader attention is drawn to adjusted R-squared values provided with each regression ¿JXUH��¿JV������ �EHFDXVH�WKH�DGMXVWHG�5�VTXDUHG�FDQ�SURYLGH� D�PRUH�UHDOLVWLF�HYDOXDWLRQ�RI�WKH�PRGHO�¿W�RU�DELOLW\�RI�WKH� model to characterize uncertainty in this study (Helsel and Hirsch, 2002). The residual standard errors (RSE) of the regression equations reported here are exclusively reported in logarithmic units, which is consistent with the application of the logarithmic transformation of the response (water-quality constituent concentration). The authors use base-10 logarithms because these logarithms are conventionally most accessible to water-resources managers and the supporting engineering community. After the transformation or transformations for the response and explanatory variables are selected, the analysis continues with the selection of explanatory variables that produce reliable regression models. The preferred regression model contains the fewest explanatory variables for which model diagnostics (including adjusted R-squared, the residual standard error, residual plots, and p-values) are acceptable. The p-value represents the probability (ranging from zero to
9
one), that the statistical test result could have occurred if the null hypothesis (the hypothesis representing no change or no difference) was true (Helsel and Hirsch, 2002). When the S�YDOXH�LV�OHVV�WKDQ�D�VSHFL¿HG�VLJQL¿FDQFH�OHYHO������LQ�RXU� application), the null hypothesis is rejected. Preferable models are those judged to have an acceptable balance between model ¿W�DQG�WKH�QXPEHU�RI�YDULDEOHV�LQ�WKH�PRGHO��9DULDEOHV�ZLWK� VPDOO�VWDWLVWLFDO�VLJQL¿FDQFH�DQG��RU �VXEVWDQWLDO�YDULDQFH� LQÀDWLRQ�SRWHQWLDO�DUH�H[FOXGHG��+HOVHO�DQG�+LUVFK������ � 9DULDQFH�LQÀDWLRQ�IDFWRUV��9,) �DUH�XVHG�WR�FKHFN�IRU� high collinearity between explanatory variables (Stine, 1995). Explanatory variables carrying similar information about the response have a high collinearity, and when such variables are all included in the model, give rise to increased variance LQ�WKH�HVWLPDWLRQ�RI�WKH�UHJUHVVLRQ�FRHI¿FLHQWV�DQG�UHTXLVLWH� H[SDQVLRQ�RI�SUHGLFWLRQ�LQWHUYDOV��$�9,)�UHSUHVHQWV�WKH� increase in variance because of correlation between predictive variables, whereas a minimum value of 1 occurs when no FRUUHODWLRQ�LV�SUHVHQW��7\SLFDOO\��9,)V�QXPHULFDOO\�JUHDWHU�WKDQ� 10 are a cause of concern and indicate that a poor estimate of WKH�DVVRFLDWHG�UHJUHVVLRQ�FRHI¿FLHQW�KDV�EHHQ�SURGXFHG�E\�WKH� PRGHO��$VVHVVPHQW�RI�9,)V�ZDV�PDGH�DQG�QR�YDOXHV�JUHDWHU� than 10 were present for the variables shown in the regression equations reported here. Graphical analysis is a vital component of regression DQDO\VLV�DQG�VXEVHTXHQW�LQWHUSUHWDWLRQ��LW�IDFLOLWDWHV�YLVXDO� LQVSHFWLRQ�DQG�YHUL¿FDWLRQ�RI�GDWD�SDWWHUQV�VXFK�DV�OLQHDULW\� and constant variance underlying linear regression equation theory. The patterns seen in residual plots facilitate judgments in model reliability and are used to check if regression HTXDWLRQV�¿W�WKH�REVHUYHG�GDWD��
Retransformation Bias Correction When a water-quality constituent is transformed (that is, into logarithmic units) as part of the building of a regression equation, the constituent must be retransformed to obtain an estimate in the original units. Estimates of constituent concentration that are unbiased in the transformed scale will be biased upon retransformation to the original scale. Retransformation bias corrections are made to mitigate RU�UHPRYH�ELDV��WKH�IRUP�RI�WKH�ELDV�FRUUHFWLRQ�IDFWRU�ZLOO� depend on the transformation used in the regression analysis �'XDQ�������+HOVHO�DQG�+LUVFK������ � Because logarithmic transformation was used for the current (2012) investigation, a bias correction is necessary because retransformation yields a median estimate of a FRQVWLWXHQW��PHGLDQ�HVWLPDWHV�WHQG�WR�XQGHUHVWLPDWH�WKH�DFWXDO� arithmetic mean for the data considered here. Simply inverting a log-transformed response will return a biased low and therefore inconsistent estimate of the arithmetic mean. This ELDV�JUHDWO\�LQÀXHQFHV�KRZ�ORDGLQJV��VD\�LQ�XQLWV�RI�WRQV�SHU� unit time) are computed. Extensive research has been done by RWKHUV�WR�¿QG�HVWLPDWRUV�WKDW�UHWXUQ�WKH�H[SHFWHG�YDOXH��PHDQ � RI�WKH�VWUHDPÀRZ�ORDG�RI�D�FRQVWLWXHQW�LI�WKH�UHVSRQVH�ZDV�
10
Regression Model Development and Computational Procedures in Two Tributaries to Lake Houston, 2005–9
log-transformed, for example Duan (1983), Crawford (1991), and Cohn (2005). $�PLQLPXP�YDULDQFH�XQELDVHG�HVWLPDWRU��098( �ZDV� derived by Finney (1941). This estimator adjusts for bias DQG�UHWXUQV�DQ�HI¿FLHQW�HVWLPDWH�RI�WKH�PHDQ��7KH�)LQQH\� estimator is a commonly used and a reliable choice when the log-normal model is correct and the residual errors are normally distributed. However, the requirement that the residuals are normally distributed is an assumption that is GLI¿FXOW�WR�DFKLHYH��DVVHVV��RU�LQWHUSUHW�IRU�WKH�ZDWHU�TXDOLW\� data considered in this report. Nonparametric estimators can provide a useful alternative to the retransformation methods. Duan (1983) derived a “smearing” estimator that requires only the residuals to be independent and homoscedastic (constant variance about the regression line). In the case of a log- transformation, the correction factor involves re-expressing the residuals in the original units and computing their mean. This factor for a given regression equation is to be multiplied to the regression equation in circumstances involving the FRPSXWDWLRQ�RI�ORDGV��FRQFHQWUDWLRQ�PXOWLSOLHG�E\�VWUHDPÀRZ� along with necessary unit conversions).
Analysis of Censored Data 7R�DYRLG�IDOVH�SRVLWLYH�TXDQWL¿FDWLRQ�RI�D�FRQVWLWXHQW�� very low concentrations are censored and reported as a “less than” value by the laboratory (Childress and others, 1999). This kind of reporting results in what is referred to as left- censored observations (Helsel, 2005). Another complicating feature of water-quality data is that the censored values can vary depending on the laboratory reporting level (LRL) at the time the analyses were done. Censored values are those less than the laboratory reporting level applicable at the time the analyses were done. The mathematical theory is thoroughly described by Helsel (2005). For this report, the foundational computational scripts were constructed by the authors to auto-adapt to the presence of left-censored data values, identify these values, and subsequently apply a maximum-likelihood estimator (MLE) for regression in lieu of conventional ordinary least-squares �2/6 �UHJUHVVLRQ��%RWK�UHJUHVVLRQ�HVWLPDWLRQ�WHFKQLTXHV�DUH� provided by the R environment for statistical computing and VWDQGDUG�SDFNDJHV�RI�5��WKH�WZR�VSHFL¿F�IXQFWLRQV�IRU�2/6� and MLE are lm( ) (a linear regression modeling function) and survreg( ) (a survival regression modeling function), respectively (R Development Core Team, 2010). The end result for the current (2012) investigation is that the basic algebraic implementation of the equations, whether produced E\�2/6�RU�0/(�UHJUHVVLRQ��ZLOO�EH�IDPLOLDU�WR�ZDWHU�UHVRXUFHV� managers and the engineering community. To conclude the broader discussion of censored data, an additional remark concerning judgment exercised by the authors is needed. Along with censored data, the laboratory PLJKW�UHSRUW�HVWLPDWHG�YDOXHV��WKHVH�DUH�LGHQWL¿HG�LQ�WKH� National Water Information System database with an “E” remark code. A constituent concentration is considered
estimated by the laboratory when results are greater than the long-term method detection level (LT–MDL) and less WKDQ�WKH�/5/��WKDW�LV��D�GHWHFWLRQ�LV�FRQVLGHUHG�OLNHO\��EXW� QXPHULFDO�TXDQWL¿FDWLRQ�LV�FRQVLGHUHG�TXHVWLRQDEOH��)RU�WKLV� investigation, all occurrences of “E” were dropped and the remaining numerical values used in the regression analysis. Additionally, individual samples collected prior to 2008 that were deemed contaminated or determined to be substantial RXWOLHUV�E\�2GHQ�DQG�RWKHUV������ �DOVR�ZHUH�QRW�XVHG�LQ�WKH� development of the models reported herein. To further clarify, IRU�WKH�FXUUHQW������ �LQYHVWLJDWLRQ��WKH�GDWD�¿OHV�XVHG�E\� 2GHQ�DQG�RWKHUV������ �ZHUH�H[WHQGHG�E\�XVLQJ�GDWD�FROOHFWHG� after 2008.
Censored Data at Spring Creek and East Fork San Jacinto River Site The data for the Spring Creek and East Fork San Jacinto River sites used in this study are stored in the USGS NWIS database and can be publicly accessed online (U.S. Geological 6XUYH\������ ��2QO\�RQH�RI�WKH�DWUD]LQH�FRQFHQWUDWLRQV� measured in environmental samples collected at the Spring Creek site was less than the LRL of 0.10 mg/L. In contrast, most of the atrazine concentrations measured from East Fork San Jacinto River site were less than the LRL. Because of the large amount of censored atrazine data in discrete environmental samples collected at the East Fork San Jacinto River site, a defensible multilinear regression equation to estimate atrazine concentrations could not be developed. None of the nitrite plus nitrate concentrations measured in environmental samples collected at the Spring Creek site was less than the LRL of 0.06 mg/L, whereas four of the nitrite plus nitrate concentration measured in samples collected from the East Fork San Jacinto River site were less than the LRL.
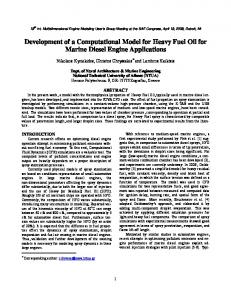
Regression Analysis Summaries and Presentation of Equations Summaries of the developed regression equations are SURYLGHG�LQ�¿JXUHV��±����)LJXUH���VKRZV�DEEUHYLDWLRQV� RI�WHUPV�XVHG�LQ�¿JXUHV�������(DFK�¿JXUH�HQFDSVXODWHV�DQ� LQGLYLGXDO�FRQVWLWXHQW�SHU�ORFDWLRQ�DQG�SURYLGHV�WKH�VLJQL¿FDQW� explanatory variables used in the model, diagnostics factors used as indicators of general model reliability (including adjusted R-squared, the residual standard error, residual plots, and p-values), summary statistics for the explanatory variables and calculated constituent, the algebraic representation of the resultant model, and additional statistical parameters required for calculating prediction intervals, which were computed to display the uncertainty associated with the estimate (Helsel and Hirsch, 2002). Regression equations for Spring Creek were developed for all constituents (table 2) analyzed for the study. A preliminary assessment (not reported here) of total ammonia plus organic nitrogen, dissolved ammonia plus organic
Regression Model Development nitrogen, ammonia nitrogen, nitrite nitrogen, orthophosphate phosphorus, dissolved phosphorus, and total coliform bacteria did not result in reliable equations because of large residual standard errors, and other unsatisfactory results from regression equation diagnostics. The regression equations developed for nitrite plus nitrate nitrogen, total phosphorus, total organic carbon, E. coli bacteria, atrazine, and suspended VHGLPHQW�DUH�GHVFULEHG�LQ�¿JXUHV��±���$GMXVWHG�5�VTXDUHG� values for the Spring Creek models ranged from .582–.922 (dimensionless). The residual standard errors ranged from .073–.447 (base-10 logarithm). Regression equations for East Fork San Jacinto River were developed for all constituents analyzed for the study (table 2), except atrazine. A preliminary assessment (not reported here) of total ammonia plus organic nitrogen,
11
dissolved ammonia plus organic nitrogen, ammonia nitrogen, nitrite nitrogen, orthophosphate phosphorus, dissolved phosphorus, and total coliform bacteria did not result in reliable equations because of large residual standard errors, and other unsatisfactory results from regression equation diagnostics. Furthermore, an atrazine regression equation was not developed for the study because more than 50 percent of the data were below the LRL. The regression equations developed for nitrite plus nitrate nitrogen, total phosphorus, organic carbon, E. coli bacteria, and suspended sediment DUH�GHVFULEHG�LQ�¿JXUHV���±����$GMXVWHG�5�VTXDUHG�YDOXHV� for the East Fork San Jacinto River models ranged from .253–.853(dimensionless). The residual standard errors ranged from .076–.388 (base-10 logarithm).
ABBREVIATIONS OF MATHEMATICAL FUNCTIONS AND STATISTICAL TERMS SHOWN IN FIGURES 4 THROUGH 14 Summary Statistics and Miscellaneous Min . Minimum 1 st Qu . First quartile 3 rd Qu . Third quartile Max . Maximum log10 () Base -10 logarithm cos2piD The cosine of the cosine of the products 2 * pi * ( Date ) sin2piD The sine of the sine of the products 2 * pi * ( Date ) cos4piD The cosine of the cosine of the products 4 * pi * ( Date ) sin4piD The sine of the sine of the products 4 * pi * ( Date ) pi A mathematical constant approximately equal to 3.1415. Date Julian days into year divided by 365.25 Regression Model , linear model ( ordinary least squares for uncensored data ) lm () Linear regression modeling function Std . Error Standard error t - value T - statistic for the t - test Pr ( >| t |) Probability of absolute value of t - value Signif . codes Default textual flags related to parameter significance R - squared Coefficient of determination F - statistic A statistic for the F - test DF Degrees of freedom p - value p - value ( a standard computed probability ) Regression Model , survival model ( for censored data ) survreg () Survival regression modeling function dist = " guassian " The normal distribution is used for model estimation Std . Error Standard error z Standard normal z - statistic for survreg () p - value p - value ( a standard computed probability ) Scale Equivalent to residual standard error in transformed units Loglik () Log - likelihood ( a statistic for method of maximum likelihood ) Chisq A statistic for the Chi - squared distribution
Figure 3. Abbreviations of mathematical functions and statistical terms related to regression analysis of water-quality conFigure 3. Abbreviations of mathematical functions and statistical terms related to regression analysis of water-quality stituents shown in figures 4–14. constituents shown in figures 4-14.
12
Regression Model Development and Computational Procedures in Two Tributaries to Lake Houston, 2005–9 Inflow Statistics of Applicable Explanatory Variables:
[Min., minimum, Qu., quartile, Max., maximum]
EXPLANATORY VARIABLE SUMMARY STATISTICS log10 ( Q ) log10 ( SC ) Min . :1.230 Min . :1.806 1 st Qu .:1.580 1 st Qu .:2.413 Median :1.914 Median :2.562 Mean :2.112 Mean :2.521 3 rd Qu .:2.346 3 rd Qu .:2.680 Max . :3.867 Max . :2.847
Summary of Regression Analysis for the Constituent of: nitrite plus nitrate (NO2 NO3 )
Nomenclature (all potential variables) . Q is streamflow, in cubic feet per second;
SUMMARY STATISTICS FOR NO2NO3 , IN LOG10 () milligrams per liter Min . 1 st Qu . Median Mean 3 rd Qu . Max . -0.9586 0.1239 0.3263 0.2678 0.6031 0.9074
. pH is pH, in standard units;
REGRESSION EQUATION lm ( formula = log10 ( NO2NO3 ) ~ log10 ( Q ) + log10 ( SC ) , data = the . data ) Residuals : Min 1 st Qu . Median -0.42257 -0.04910 0.02540
3 rd Qu . Max 0.06092 0.32012
. SC is specific conductance, in microsiemens per centimeter at 25° Celsius; . Turb is turbidity in Formazine Nephelometric Units; . Temp is water temperature, in ° Celsius; . Date is Julian day DOY (days into year) divided by 365.25; and
Coefficients : Estimate Std . Error t - value Pr ( >| t |) ( Intercept ) -3.38330 0.59894 -5.649 6.20 e -07 *** log10 ( Q ) -0.10225 0.06142 -1.665 0.102 log10 ( SC ) 1.53375 0.18900 8.115 6.44 e -11 *** --Signif . codes : 0 "***" 0.001 "**" 0.01 "*" 0.05 "." 0.1 " " 1
. log10 (x) is base-10 logarithm of x. Algebraic Equation
Residual standard error : 0.1241 on 54 degrees of freedom Multiple R - squared : 0.9245 , Adjusted R - squared : 0.9217 F - statistic : 330.7 on 2 and 54 DF , p - value : < 2.2 e -16
log10 (NO2 NO3 ) = − 3.3833
− 0.1023 log10 (Q)
+ 1.5338 log10 (SC)
Variance inflation factors : log10 ( Q ) log10 ( SC ) 7.0611 7.0611 Duan (1983) smearing factor : 1.037 = mean (10^[ residuals ( model ) ]) ( Detransformed estimates are to be multiplied this factor .)
Residual Plot for Regression ���
CORRELATION OF COEFFICIENTS NO2NO3 ( Intercept ) log10 ( Q ) log10 ( SC ) ( Intercept ) 1 -0.9537 -0.9963 log10 ( Q ) -0.9537 1 0.9265 log10 ( SC ) -0.9963 0.9265 1
0.2
●
●
●
●
0.0
●
● ● ●
●
●
● ●
●● ● ● ●● ● ●● ●
● ● ● ● ● ● ●● ● ●● ●● ● ● ● ● ●● ● ● ● ●
●●● ●
●
��
Residuals
●
●
●
● ●
��
●
EXPLANATION ●
●
0.1
0.2
0.5 1.0 2.0 Estimated nitrite plus nitrate, in milligrams per liter
ORIGIN LINE CONSTITUENT FOR STREAMFLOW-GAGING STATION
5.0
Comprehensive descriptions of abbreviations for the computer output related to the regression analysis documented in this figure are shown in figure 3.
Figure Summary of regression analysis nitrite plus nitrate (NO2 NO for 08068500 Spring Creek near Spring, Tex.station based Figure 4. 4.Summary of regression analysis forfor nitrite plus nitrate nitrogen for3 )U.S. Geological Survey streamflow-gaging on data as described in text for period 2005–09. 08068500 Spring Creek near Spring, Texas, 2005–9.
Regression Model Development Inflow Statistics of Applicable Explanatory Variables:
[Min., minimum, Qu., quartile, Max., maximum]
EXPLANATORY VARIABLE SUMMARY STATISTICS log10 ( SC ) log10 ( Turb ) sin2piD Min . :1.806 Min . :0.9956 Min . : -0.999761 1 st Qu .:2.411 1 st Qu .:1.2729 1 st Qu .: -0.736086 Median :2.565 Median :1.5796 Median : -0.175941 Mean :2.522 Mean :1.6364 Mean : 0.005503 3 rd Qu .:2.684 3 rd Qu .:1.9303 3 rd Qu .: 0.793275 Max . :2.847 Max . :2.4771 Max . : 0.999091
cos2piD Min . : -0.9976 1 st Qu .: -0.6996 Median : -0.2322 Mean : -0.1095 3 rd Qu .: 0.4928 Max . : 0.9839
Summary of Regression Analysis for the Constituent of: total phosphorus (Phos)
Nomenclature (all potential variables) 1 Q is streamflow, in cubic feet per second;
SUMMARY STATISTICS FOR PHOS , IN LOG10 () milligrams per liter Min . 1 st Qu . Median Mean 3 rd Qu . Max . -0.82390 -0.30550 -0.06299 -0.12350 0.05011 0.35980
1 pH is pH, in standard units; 1 SC is specific conductance, in microsiemens per centimeter at 25° Celsius;
REGRESSION EQUATION lm ( formula = log10 ( PHOS ) ~ log10 ( SC ) + log10 ( Turb ) + sin2piD + cos2piD , data = the . data ) Residuals : Min 1 st Qu . Median -0.24310 -0.05750 -0.00554
1 Turb is turbidity in Formazine Nephelometric Units; 1 Temp is water temperature, in ° Celsius;
3 rd Qu . Max 0.05387 0.22659
1 Date is Julian day DOY (days into year) divided by 365.25; and
Coefficients : Estimate Std . Error t - value Pr ( >| t |) ( Intercept ) -3.58078 0.26045 -13.749 < 2e -16 *** log10 ( SC ) 1.25921 0.07907 15.926 < 2e -16 *** log10 ( Turb ) 0.16780 0.04699 3.571 0.000786 *** sin2piD -0.02472 0.01722 -1.436 0.157185 cos2piD -0.06272 0.01973 -3.178 0.002519 ** --Signif . codes : 0 "***" 0.001 "**" 0.01 "*" 0.05 "." 0.1 " " 1
1 log10 (x) is base-10 logarithm of x. Algebraic Equation log10 (Phos) = − 3.5808
+ 1.2592 log10 (SC)
Residual standard error : 0.09536 on 51 degrees of freedom Multiple R - squared : 0.8838 , Adjusted R - squared : 0.8747 F - statistic : 96.96 on 4 and 51 DF , p - value : < 2.2 e -16 Variance inflation factors : log10 ( SC ) log10 ( Turb ) sin2piD 2.0915 2.1556 1.0197
13
+ 0.1678 log10 (Turb) − 0.0247 sin[2π(Date)]
− 0.0627 cos[2π(Date)]
cos2piD 1.0297
Duan (1983) smearing factor : 1.0222 = mean (10^[ residuals ( model ) ]) ( Detransformed estimates are to be multiplied this factor .)
Residual Plot for Regression CORRELATION OF COEFFICIENTS PHOS ( Intercept ) log10 ( SC ) log10 ( Turb ) sin2piD cos2piD ( Intercept ) 1 -0.9777 -0.8447 -0.0966 -0.0567 log10 ( SC ) -0.9777 1 0.7190 0.0750 0.0324 log10 ( Turb ) -0.8447 0.7190 1 0.1310 0.1361 sin2piD -0.0966 0.0750 0.1310 1 -0.0164 cos2piD -0.0567 0.0324 0.1361 -0.0164 1
0.2
●
●
●
● ●
● ● ●
0.0
●
●
●
● ●
● ●
● ●
● ● ● ● ● ●
● ● ● ● ●● ● ● ● ● ● ● ● ● ●● ● ● ● ● ●● ● ● ● ● ●●● ●
●
EXPLANATION
��
��
Residuals
0.1
●
●
●
0.1
0.2 0.5 1.0 Estimated total phosphorus, in milligrams per liter
ORIGIN LINE CONSTITUENT FOR STREAMFLOW-GAGING STATION
2.0
Comprehensive descriptions of abbreviations for the computer output related to the regression analysis documented in this figure are shown in figure 3.
Figure Summary of regression analysis total phosphorus for 08068500 Spring Creek near Spring, Tex. based on Spring Figure 5. 5.Summary of regression analysis forfor total phosphorus for(Phos) U.S. Geological Survey streamflow-gaging station 08068500 data as described in text for period 2005–09. Creek near Spring, Texas, 2005–9.
14
Regression Model Development and Computational Procedures in Two Tributaries to Lake Houston, 2005–9 Inflow Statistics of Applicable Explanatory Variables:
[Min., minimum, Qu., quartile, Max., maximum]
EXPLANATORY VARIABLE SUMMARY STATISTICS log10 ( Q ) log10 ( Turb ) Min . :1.230 Min . :0.9956 1 st Qu .:1.580 1 st Qu .:1.2899 Median :1.914 Median :1.5911 Mean :2.115 Mean :1.6457 3 rd Qu .:2.349 3 rd Qu .:1.9414 Max . :3.867 Max . :2.4771
Summary of Regression Analysis for the Constituent of: total organic carbon (OrgC)
Nomenclature (all potential variables) / Q is streamflow, in cubic feet per second;
SUMMARY STATISTICS FOR ORGC , IN LOG10 () milligrams per liter Min . 1 st Qu . Median Mean 3 rd Qu . Max . 0.8751 0.9800 1.0610 1.0640 1.1480 1.3220
/ pH is pH, in standard units;
REGRESSION EQUATION lm ( formula = log10 ( ORGC ) ~ log10 ( Q ) + log10 ( Turb ) , data = the . data ) Residuals : Min 1 st Qu . Median -0.11713 -0.05173 -0.01510
3 rd Qu . Max 0.03307 0.18542
/ SC is specific conductance, in microsiemens per centimeter at 25° Celsius; / Turb is turbidity in Formazine Nephelometric Units; / Temp is water temperature, in ° Celsius; / Date is Julian day DOY (days into year) divided by 365.25; and
Coefficients : Estimate Std . Error t - value Pr ( >| t |) ( Intercept ) 0.71382 0.04244 16.819 < 2e -16 *** log10 ( Q ) 0.02522 0.02233 1.130 0.264 log10 ( Turb ) 0.18017 0.04054 4.444 4.65 e -05 *** --Signif . codes : 0 "***" 0.001 "**" 0.01 "*" 0.05 "." 0.1 " " 1
/ log10 (x) is base-10 logarithm of x. Algebraic Equation
Residual standard error : 0.07333 on 52 degrees of freedom Multiple R - squared : 0.597 , Adjusted R - squared : 0.5815 F - statistic : 38.51 on 2 and 52 DF , p - value : 5.479 e -11
log10 (OrgC) = 0.7138 + 0.0252 log10 (Q) + 0.1802 log10 (Turb)
Variance inflation factors : log10 ( Q ) log10 ( Turb ) 2.6598 2.6598 Duan (1983) smearing factor : 1.0142 = mean (10^[ residuals ( model ) ]) ( Detransformed estimates are to be multiplied this factor .)
���
Residual Plot for Regression CORRELATION OF COEFFICIENTS ORGC ( Intercept ) log10 ( Q ) log10 ( Turb ) ( Intercept ) 1 0.1291 -0.693 log10 ( Q ) 0.1291 1 -0.790 log10 ( Turb ) -0.6930 -0.7900 1.000
●
●
●
●
���
● ● ●
●
���
● ●●● ●●●
● ● ●
��
● ●
● ● ●●
● ● ●
●
●
●●
●● ● ● ● ●●
��
Residuals
● ●
● ●
●
●
● ●
● ●
● ●
●
●
● ● ●
EXPLANATION ●
10 12 14 16 Estimated total organic carbon, in milligrams per liter
ORIGIN LINE CONSTITUENT FOR STREAMFLOW-GAGING STATION
18
Comprehensive descriptions of abbreviations for the computer output related to the regression analysis documented in this figure are shown in figure 3.
Figure 6. 6.Summary of regression analysis forfor total organic carbon for(OrgC) U.S. Geological Survey streamflow-gaging station 08068500 Figure Summary of regression analysis total organic carbon for 08068500 Spring Creek near Spring, Tex. based on Spring near Spring, 2005–9. dataCreek as described in textTexas, for period 2005–09.
Regression Model Development Inflow Statistics of Applicable Explanatory Variables:
[Min., minimum, Qu., quartile, Max., maximum]
EXPLANATORY VARIABLE SUMMARY STATISTICS log10 ( Q ) log10 ( Turb ) Min . :1.230 Min . :0.9956 1 st Qu .:1.564 1 st Qu .:1.2553 Median :1.860 Median :1.5623 Mean :2.079 Mean :1.6230 3 rd Qu .:2.283 3 rd Qu .:1.9303 Max . :3.867 Max . :2.4771
Summary of Regression Analysis for the Constituent of: Escherichia coli (ECB)
Nomenclature (all potential variables) 0 Q is streamflow, in cubic feet per second;
SUMMARY STATISTICS FOR ECB , IN LOG10 () most probable number per 100 milliliters Min . 1 st Qu . Median Mean 3 rd Qu . Max . 1.301 1.995 2.477 2.701 3.519 4.613 REGRESSION EQUATION lm ( formula = log10 ( ECB ) ~ log10 ( Q ) + log10 ( Turb ) , data = the . data ) Residuals : Min 1 st Qu . Median -0.73223 -0.33382 -0.06325
0 pH is pH, in standard units; 0 SC is specific conductance, in microsiemens per centimeter at 25° Celsius; 0 Turb is turbidity in Formazine Nephelometric Units; 0 Temp is water temperature, in ° Celsius;
3 rd Qu . Max 0.22911 1.21151
0 Date is Julian day DOY (days into year) divided by 365.25; and
Coefficients : Estimate Std . Error t - value Pr ( >| t |) ( Intercept ) -0.1913 0.2512 -0.762 0.449533 log10 ( Q ) 0.4969 0.1394 3.564 0.000782 *** log10 ( Turb ) 1.1458 0.2468 4.642 2.31 e -05 *** --Signif . codes : 0 "***" 0.001 "**" 0.01 "*" 0.05 "." 0.1 " " 1
0 log10 (x) is base-10 logarithm of x. Algebraic Equation log10 (ECB) = − 0.1913
Residual standard error : 0.4468 on 53 degrees of freedom Multiple R - squared : 0.7578 , Adjusted R - squared : 0.7487 F - statistic : 82.92 on 2 and 53 DF , p - value : < 2.2 e -16
+ 0.4969 log10 (Q) + 1.1458 log10 (Turb)
Variance inflation factors : log10 ( Q ) log10 ( Turb ) 2.7361 2.7361 Duan (1983) smearing factor : 1.8071 = mean (10^[ residuals ( model ) ]) ( Detransformed estimates are to be multiplied this factor .)
Residual Plot for Regression CORRELATION OF COEFFICIENTS ECB ( Intercept ) log10 ( Q ) log10 ( Turb ) ( Intercept ) 1 0.1167 -0.6759 log10 ( Q ) 0.1167 1 -0.7966 log10 ( Turb ) -0.6759 -0.7966 1
●
���
●
●
●
●
●
●
���
● ●
��
Residuals
���
● ●
● ● ●
●
● ● ●
●
● ●
●● ● ●● ● ● ●
●
● ●
●
● ● ●●
● ●
●
●
●
● ●
● ● ● ● ●
● ●
●
●
●
● ●
��
EXPLANATION ●
500 2000 5000 20000 Estimated Escherichia coli bacteria, in most probable number per 100 milliliters
ORIGIN LINE CONSTITUENT FOR STREAMFLOW-GAGING STATION
50 100
Comprehensive descriptions of abbreviations for the computer output related to the regression analysis documented in this figure are shown in figure 3.
Figure 7. 7.Summary of regression analysis forfor Escherichia colicoli for (ECB) U.S. Geological Survey streamflow-gaging 08068500 Spring Figure Summary of regression analysis Escherichia for 08068500 Spring Creek near Spring,station Tex. based on data Creek near Spring, Texas, as described in text for 2005–9. period 2005–09.
15
16
Regression Model Development and Computational Procedures in Two Tributaries to Lake Houston, 2005–9 Inflow Statistics of Applicable Explanatory Variables:
[Min., minimum, Qu., quartile, Max., maximum]
EXPLANATORY VARIABLE SUMMARY STATISTICS log10 ( Q ) log10 ( Turb ) sin2piD Min . :1.230 Min . :0.9956 Min . : -0.99976 1 st Qu .:1.580 1 st Qu .:1.2611 1 st Qu .: -0.71865 Median :1.894 Median :1.5796 Median : -0.05209 Mean :2.101 Mean :1.6314 Mean : 0.01822 3 rd Qu .:2.342 3 rd Qu .:1.9191 3 rd Qu .: 0.77246 Max . :3.867 Max . :2.4771 Max . : 0.99909
cos2piD Min . : -0.9976 1 st Qu .: -0.7164 Median : -0.2322 Mean : -0.1065 3 rd Qu .: 0.5273 Max . : 0.9839
Summary of Regression Analysis for the Constituent of: Atrazine (Atz)
cos4piD Min . : -0.99904 1 st Qu .: -0.71440 Median : -0.14635 Mean : -0.08866 3 rd Qu .: 0.57287 Max . : 0.99045
Nomenclature (all potential variables) 1 Q is streamflow, in cubic feet per second;
SUMMARY STATISTICS FOR ATZ , IN LOG10 () milligrams per liter The variable as " survival time " Min . 1 st Qu . Median Mean 3 rd Qu . Max . -1.00000 -0.28830 -0.09971 -0.03906 0.24180 1.14600 The variable as " survival status " Min . 1 st Qu . Median Mean 3 rd Qu . 0.0000 1.0000 1.0000 0.9828 1.0000
sin4piD Min . : -0.99901 1 st Qu .: -0.61393 Median : -0.02074 Mean : 0.03735 3 rd Qu .: 0.74837 Max . : 0.99948
1 pH is pH, in standard units; 1 SC is specific conductance, in microsiemens per centimeter at 25° Celsius; 1 Turb is turbidity in Formazine Nephelometric Units;
Max . 1.0000
REGRESSION EQUATION survreg ( formula = log10 ( ATZ ) ~ log10 ( Q ) + log10 ( Turb ) + sin2piD + cos2piD + sin4piD + cos4piD , data = the . data , dist = " gaussian ") Value Std . Error z p - value ( Intercept ) -0.8096 0.1537 -5.266 1.40 e -07 log10 ( Q ) -0.2253 0.0760 -2.966 3.02 e -03 log10 ( Turb ) 0.7473 0.1359 5.498 3.84 e -08 sin2piD 0.4027 0.0451 8.932 4.20 e -19 cos2piD -0.0718 0.0489 -1.469 1.42 e -01 sin4piD -0.0105 0.0497 -0.212 8.32 e -01 cos4piD -0.2353 0.0486 -4.847 1.25 e -06 Log ( scale ) -1.4200 0.0935 -15.181 4.70 e -52
1 Temp is water temperature, in ° Celsius; 1 Date is Julian day DOY (days into year) divided by 365.25; and 1 log10 (x) is base-10 logarithm of x. Algebraic Equation log10 (Atz) = − 0.8096
− 0.2253 log10 (Q)
Scale = 0.242 Gaussian distribution Loglik ( model ) = 0 Loglik ( intercept only ) = -35.6 Chisq = 71.35 on 6 degrees of freedom , p - value : Number of Newton - Raphson Iterations : 5 Sample size : 58
+ 0.7473 log10 (Turb) + 0.4027 sin[2π(Date)]
2.2 e -13
− 0.0718 cos[2π(Date)] − 0.0105 sin[4π(Date)]
Variance inflation factors are not computable for a survival regression using the DAAG ::: vif () function .. McFadden (1974) R - squared : 1.001 and adjusted R - squared : 0.8046 Bias correction factor : 1.0696 = 10^[( Scale * Scale ) /2] ( Detransformed estimates are to be multiplied this factor .)
− 0.2353 cos[4π(Date)]
Residual Plot for Regression ���
●
���
●
●
●
●
0.2
● ● ●
0.0
Residuals
●
●
●
�� �� ��
CORRELATION OF COEFFICIENTS ATZ ( Intercept ) log10 ( Q ) log10 ( Turb ) sin2piD cos2piD sin4piD cos4piD 1 0.0223 -0.6761 -0.2079 -0.1187 -0.4198 -0.0427 0.0223 1 -0.7376 0.0807 -0.0864 0.1763 0.1573 -0.6761 -0.7376 1 0.0791 0.1681 0.1588 -0.0654 -0.2079 0.0807 0.0791 1 0.0031 0.1904 0.0994 -0.1187 -0.0864 0.1681 0.0031 1 0.0582 0.1181 -0.4198 0.1763 0.1588 0.1904 0.0582 1 0.1052 -0.0427 0.1573 -0.0654 0.0994 0.1181 0.1052 1
( Intercept ) log10 ( Q ) log10 ( Turb ) sin2piD cos2piD sin4piD cos4piD
● ●
● ● ●● ●
● ●
●
● ● ●
● ●
●
●● ● ● ● ●
●● ● ● ●
● ● ● ● ● ● ● ●
●
●
● ●
●
●
● ● ●
●
EXPLANATION
●
●
●
0.5
1.0 2.0 Estimated Atrazine, in milligrams per liter
ORIGIN LINE CONSTITUENT FOR STREAMFLOW-GAGING STATION
5.0
Comprehensive descriptions of abbreviations for the computer output related to the regression analysis documented in this figure are shown in figure 3.
Figure Summary regression analysis Atrazine 08068500Survey Spring streamflow-gaging Creek near Spring, station Tex. based on data as Creek Figure 8. 8. Summary of of regression analysis forfor atrazine for(Atz) U.S.for Geological 08068500 Spring described in text for period 2005–09. near Spring, Texas, 2005–9.
Regression Model Development Inflow Statistics of Applicable Explanatory Variables:
[Min., minimum, Qu., quartile, Max., maximum]
EXPLANATORY VARIABLE SUMMARY STATISTICS log10 ( Q ) log10 ( Turb ) Min . :1.230 Min . :0.9956 1 st Qu .:1.580 1 st Qu .:1.2843 Median :1.919 Median :1.5966 Mean :2.135 Mean :1.6441 3 rd Qu .:2.351 3 rd Qu .:1.9191 Max . :3.867 Max . :2.4771
Summary of Regression Analysis for the Constituent of: suspended sediment (SS)
Nomenclature (all potential variables) / Q is streamflow, in cubic feet per second;
SUMMARY STATISTICS FOR SS , IN LOG10 () milligrams per liter Min . 1 st Qu . Median Mean 3 rd Qu . Max . 1.176 1.535 1.648 1.867 2.128 2.994
/ pH is pH, in standard units;
REGRESSION EQUATION lm ( formula = log10 ( SS ) ~ log10 ( Q ) + log10 ( Turb ) , data = the . data ) Residuals : Min 1 st Qu . Median -0.41044 -0.14107 -0.00053
3 rd Qu . Max 0.15352 0.29726
/ SC is specific conductance, in microsiemens per centimeter at 25° Celsius; / Turb is turbidity in Formazine Nephelometric Units; / Temp is water temperature, in ° Celsius; / Date is Julian day DOY (days into year) divided by 365.25; and
Coefficients : Estimate Std . Error t - value Pr ( >| t |) ( Intercept ) 0.23531 0.10339 2.276 0.0268 * log10 ( Q ) 0.42817 0.05009 8.548 1.13 e -11 *** log10 ( Turb ) 0.43664 0.09587 4.554 2.96 e -05 *** --Signif . codes : 0 "***" 0.001 "**" 0.01 "*" 0.05 "." 0.1 " " 1
/ log10 (x) is base-10 logarithm of x. Algebraic Equation
Residual standard error : 0.179 on 55 degrees of freedom Multiple R - squared : 0.8755 , Adjusted R - squared : 0.871 F - statistic : 193.4 on 2 and 55 DF , p - value : < 2.2 e -16
log10 (SS) = 0.2353 + 0.4282 log10 (Q) + 0.4366 log10 (Turb)
Variance inflation factors : log10 ( Q ) log10 ( Turb ) 2.5089 2.5089 Duan (1983) smearing factor : 1.0801 = mean (10^[ residuals ( model ) ]) ( Detransformed estimates are to be multiplied this factor .)
Residual Plot for Regression ���
CORRELATION OF COEFFICIENTS SS ( Intercept ) log10 ( Q ) log10 ( Turb ) ( Intercept ) 1 0.1478 -0.7223 log10 ( Q ) 0.1478 1 -0.7755 log10 ( Turb ) -0.7223 -0.7755 1
���
● ●● ● ● ●● ●
���
●
●
● ●
●
●
●
● ●
● ●
●●
●
●
● ●
●
● ●
●
●
●
● ●
●
● ● ● ● ●
● ●
●
●
●
●
��
●
●
● ●
��
Residuals
●
●
●
●
●
●● ●
●
20
50 100 200 500 Estimated suspended sediment, in milligrams per liter
EXPLANATION ●
ORIGIN LINE CONSTITUENT FOR STREAMFLOW-GAGING STATION
Comprehensive descriptions of abbreviations for the computer output related to the regression analysis documented in this figure are shown in figure 3.
Figure Summary of regression analysis suspended sediment 08068500Survey Spring streamflow-gaging Creek near Spring, Tex. based on Figure 9. 9.Summary of regression analysis forfor suspended sediment for(SS) U.S.for Geological station 08068500 data as described in text for period 2005–09. Spring Creek near Spring, Texas, 2005–9.
17
18
Regression Model Development and Computational Procedures in Two Tributaries to Lake Houston, 2005–9 Inflow Statistics of Applicable Explanatory Variables:
[Min., minimum, Qu., quartile, Max., maximum]
EXPLANATORY VARIABLE SUMMARY STATISTICS log10 ( Q ) sin2piD cos2piD Min . :1.041 Min . : -0.99894 Min . : -0.99777 1 st Qu .:1.568 1 st Qu .: -0.71442 1 st Qu .: -0.64457 Median :1.903 Median : 0.11502 Median : 0.04604 Mean :2.086 Mean : 0.03078 Mean : 0.03567 3 rd Qu .:2.474 3 rd Qu .: 0.77167 3 rd Qu .: 0.65656 Max . :3.899 Max . : 0.99998 Max . : 0.99336
Summary of Regression Analysis for the Constituent of: nitrite plus nitrate (NO2 NO3 )
Nomenclature (all potential variables) / Q is streamflow, in cubic feet per second;
SUMMARY STATISTICS FOR NO2NO3 , IN LOG10 () milligrams per liter The variable as " survival time " Min . 1 st Qu . Median Mean 3 rd Qu . Max . -1.5230 -1.2220 -1.0000 -0.9825 -0.7959 -0.2924 The variable as " survival status " Min . 1 st Qu . Median Mean 3 rd Qu . 0.0000 1.0000 1.0000 0.9216 1.0000
/ pH is pH, in standard units; / SC is specific conductance, in microsiemens per centimeter at 25° Celsius; / Turb is turbidity in Formazine Nephelometric Units;
Max . 1.0000
/ Temp is water temperature, in ° Celsius;
REGRESSION EQUATION survreg ( formula = log10 ( NO2NO3 ) ~ log10 ( Q ) + sin2piD + cos2piD , data = the . data , dist = " gaussian ") Value Std . Error z p - value ( Intercept ) -0.8938 0.1251 -7.144 9.05 e -13 log10 ( Q ) -0.0288 0.0596 -0.483 6.29 e -01 sin2piD 0.0289 0.0504 0.575 5.66 e -01 cos2piD -0.1911 0.0590 -3.241 1.19 e -03 Log ( scale ) -1.3788 0.1030 -13.390 6.94 e -41
/ Date is Julian day DOY (days into year) divided by 365.25; and / log10 (x) is base-10 logarithm of x. Algebraic Equation
Scale = 0.252 Gaussian distribution Loglik ( model ) = -3.7 Loglik ( intercept only ) = -10.3 Chisq = 13.2 on 3 degrees of freedom , p - value : Number of Newton - Raphson Iterations : 4 Sample size : 51
log10 (NO2 NO3 ) = − 0.8938
− 0.0288 log10 (Q)
+ 0.0289 sin[2π(Date)]
0.0042
− 0.1911 cos[2π(Date)]
Variance inflation factors are not computable for a survival regression using the DAAG ::: vif () function .. McFadden (1974) R - squared : 0.6412 and adjusted R - squared : 0.2527 Bias correction factor : 1.0758 = 10^[( Scale * Scale ) /2] ( Detransformed estimates are to be multiplied this factor .)
Residual Plot for Regression 0.6
CORRELATION OF COEFFICIENTS NO2NO3 ( Intercept ) log10 ( Q ) sin2piD cos2piD ( Intercept ) 1 -0.9572 -0.0923 0.4401 log10 ( Q ) -0.9572 1 0.0703 -0.4678 sin2piD -0.0923 0.0703 1 -0.0730 cos2piD 0.4401 -0.4678 -0.0730 1
●
0.4
●
●
●
0.0 ��
●
● ●
● ●
●
●● ●
● ●
●
●
●
● ●
��
Residuals
0.2
●
●
●
● ● ●
● ●
● ●
●
●
●
● ● ●
●
●
EXPLANATION
●
● ●
��
● ●
●
●
●
●
● ●
● ●
0.08 0.10 0.12 0.14 0.16 Estimated nitrite plus nitrate, in milligrams per liter
●
ORIGIN LINE CONSTITUENT FOR STREAMFLOW-GAGING STATION
Comprehensive descriptions of abbreviations for the computer output related to the regression analysis documented in this figure are shown in figure 3.
Figure Summary regression analysis nitrite plus nitrate (NO2 NO for 08070200 East Fork San Jacinto near New Figure 10.10.Summary of of regression analysis forfor nitrite plus nitrate nitrogen for3 )U.S. Geological Survey streamflow-gaging station Caney, Tex. based on data as described in text for period 2005–09. 08070200 East Fork San Jacinto River near New Caney, Texas, 2005–9.
Regression Model Development Inflow Statistics of Applicable Explanatory Variables:
[Min., minimum, Qu., quartile, Max., maximum]
EXPLANATORY VARIABLE SUMMARY STATISTICS log10 ( Q ) log10 ( Turb ) sin2piD Min . :1.041 Min . :0.8633 Min . : -0.99894 1 st Qu .:1.568 1 st Qu .:1.0792 1 st Qu .: -0.71442 Median :1.903 Median :1.2041 Median : 0.11502 Mean :2.086 Mean :1.3546 Mean : 0.03078 3 rd Qu .:2.474 3 rd Qu .:1.6127 3 rd Qu .: 0.77167 Max . :3.899 Max . :2.2304 Max . : 0.99998
cos2piD Min . : -0.99777 1 st Qu .: -0.64457 Median : 0.04604 Mean : 0.03567 3 rd Qu .: 0.65656 Max . : 0.99336
Summary of Regression Analysis for the Constituent of: total phosphorus (Phos)
1 Q is streamflow, in cubic feet per second; 1 pH is pH, in standard units; 1 SC is specific conductance, in microsiemens per centimeter at 25° Celsius;
REGRESSION EQUATION lm ( formula = log10 ( PHOS ) ~ log10 ( Q ) + log10 ( Turb ) + sin2piD + cos2piD + sin4piD + cos4piD , data = the . data )
1 Turb is turbidity in Formazine Nephelometric Units; 1 Temp is water temperature, in ° Celsius;
3 rd Qu . Max 0.055656 0.236860
1 Date is Julian day DOY (days into year) divided by 365.25; and
Coefficients : Estimate Std . Error t - value Pr ( >| t |) ( Intercept ) -1.458421 0.050022 -29.156 < 2e -16 *** log10 ( Q ) -0.081051 0.029817 -2.718 0.00935 ** log10 ( Turb ) 0.457366 0.056263 8.129 2.63 e -10 *** sin2piD -0.044349 0.016831 -2.635 0.01158 * cos2piD -0.019996 0.020621 -0.970 0.33750 sin4piD -0.003777 0.017487 -0.216 0.82998 cos4piD -0.052928 0.017576 -3.011 0.00430 ** --Signif . codes : 0 "***" 0.001 "**" 0.01 "*" 0.05 "." 0.1 " " 1
1 log10 (x) is base-10 logarithm of x. Algebraic Equation log10 (Phos) = − 1.4584
− 0.0811 log10 (Q)+
+ 0.4574 log10 (Turb)
Residual standard error : 0.08579 on 44 degrees of freedom Multiple R - squared : 0.7314 , Adjusted R - squared : 0.6948 F - statistic : 19.97 on 6 and 44 DF , p - value : 4.201 e -11 Variance inflation factors : log10 ( Q ) log10 ( Turb ) sin2piD cos4piD 3.4164 2.6701 1.0348 1.0567
cos4piD Min . : -0.99993 1 st Qu .: -0.74933 Median : -0.12020 Mean : -0.05625 3 rd Qu .: 0.69467 Max . : 0.99108
Nomenclature (all potential variables)
SUMMARY STATISTICS FOR PHOS , IN LOG10 () milligrams per liter Min . 1 st Qu . Median Mean 3 rd Qu . Max . -1.2680 -1.1110 -1.0000 -1.0070 -0.9393 -0.5986
Residuals : Min 1 st Qu . Median -0.207627 -0.060346 -0.001328
sin4piD Min . : -0.99919 1 st Qu .: -0.56101 Median : -0.08091 Mean : 0.04246 3 rd Qu .: 0.73417 Max . : 0.99926
cos2piD
sin4piD
1.3866
1.0624
− 0.0443 sin[2π(Date)]
− 0.0200 cos[2π(Date)] − 0.0038 sin[4π(Date)]
− 0.0529 cos[4π(Date)]
Duan (1983) smearing factor : 1.0172 = mean (10^[ residuals ( model ) ]) ( Detransformed estimates are to be multiplied this factor .)
Residual Plot for Regression CORRELATION OF COEFFICIENTS PHOS ( Intercept ) log10 ( Q ) log10 ( Turb ) 1 -0.0607 -0.5696 -0.0607 1 -0.7713 -0.5696 -0.7713 1 -0.1556 0.0769 0.0346 0.2165 -0.4853 0.2444 -0.0813 0.2306 -0.1423 -0.0310 0.2231 -0.1484
●
0.2
( Intercept ) log10 ( Q ) log10 ( Turb ) sin2piD cos2piD sin4piD cos4piD
●
●
●
0.1
●
●● ●
0.0
● ●
●
● ● ●
��
Residuals
●
●
●
●
● ● ● ●
● ●
● ●
● ●
cos2piD 0.2165 -0.4853 0.2444 -0.1018 1 -0.1299 -0.1356
sin4piD -0.0813 0.2306 -0.1423 -0.0213 -0.1299 1 0.0620
cos4piD -0.0310 0.2231 -0.1484 0.0660 -0.1356 0.0620 1
● ●
● ● ● ●
● ●
●
● ● ●
● ●
●
sin2piD -0.1556 0.0769 0.0346 1 -0.1018 -0.0213 0.0660
●●
●
●
●
●
��
●
0.05
EXPLANATION ● ●
0.10 0.15 Estimated total phosphorus, in milligrams per liter
ORIGIN LINE CONSTITUENT FOR STREAMFLOW-GAGING STATION
0.20
Comprehensive descriptions of abbreviations for the computer output related to the regression analysis documented in this figure are shown in figure 3.
Figure Summary of regression analysis total phosphorus for 08070200 East streamflow-gaging Fork San Jacinto near New08070200 Caney, Figure 11. 11.Summary of regression analysis forfor total phosphorus for(Phos) U.S. Geological Survey station Tex. based on data as described in text for period 2005–09. East Fork San Jacinto River near New Caney, Texas, 2005–9.
19
20
Regression Model Development and Computational Procedures in Two Tributaries to Lake Houston, 2005–9 Inflow Statistics of Applicable Explanatory Variables:
[Min., minimum, Qu., quartile, Max., maximum]
EXPLANATORY VARIABLE SUMMARY STATISTICS log10 ( Q ) log10 ( SC ) log10 ( Turb ) Min . :1.041 Min . :1.690 Min . :0.8633 1 st Qu .:1.568 1 st Qu .:2.161 1 st Qu .:1.0792 Median :1.908 Median :2.248 Median :1.2553 Mean :2.111 Mean :2.185 Mean :1.3653 3 rd Qu .:2.542 3 rd Qu .:2.328 3 rd Qu .:1.6232 Max . :3.899 Max . :2.442 Max . :2.2304
Summary of Regression Analysis for the Constituent of: total organic carbon (OrgC)
Nomenclature (all potential variables) 0 Q is streamflow, in cubic feet per second;
SUMMARY STATISTICS FOR ORGC , IN LOG10 () milligrams per liter Min . 1 st Qu . Median Mean 3 rd Qu . Max . 0.6021 0.7853 0.8865 0.9247 1.1140 1.2600
0 pH is pH, in standard units; 0 SC is specific conductance, in microsiemens per centimeter at 25° Celsius;
REGRESSION EQUATION lm ( formula = log10 ( ORGC ) ~ log10 ( Q ) + log10 ( SC ) + log10 ( Turb ) , data = the . data ) Residuals : Min 1 st Qu . Median -0.16068 -0.03881 -0.01109
0 Turb is turbidity in Formazine Nephelometric Units; 0 Temp is water temperature, in ° Celsius;
3 rd Qu . Max 0.04640 0.20723
0 Date is Julian day DOY (days into year) divided by 365.25; and
Coefficients : Estimate Std . Error t - value Pr ( >| t |) ( Intercept ) -0.53685 0.25485 -2.107 0.040767 * log10 ( Q ) 0.24611 0.02745 8.967 1.41 e -11 *** log10 ( SC ) 0.32656 0.09239 3.535 0.000958 *** log10 ( Turb ) 0.16730 0.04918 3.402 0.001413 ** --Signif . codes : 0 "***" 0.001 "**" 0.01 "*" 0.05 "." 0.1 " " 1
0 log10 (x) is base-10 logarithm of x. Algebraic Equation log10 (OrgC) = − 0.5369
+ 0.2461 log10 (Q)
Residual standard error : 0.07622 on 45 degrees of freedom Multiple R - squared : 0.8619 , Adjusted R - squared : 0.8527 F - statistic : 93.64 on 3 and 45 DF , p - value : < 2.2 e -16
+ 0.3266 log10 (SC) + 0.1673 log10 (Turb)
Variance inflation factors : log10 ( Q ) log10 ( SC ) log10 ( Turb ) 3.5481 2.9318 2.5231 Duan (1983) smearing factor : 1.0144 = mean (10^[ residuals ( model ) ]) ( Detransformed estimates are to be multiplied this factor .)
���
Residual Plot for Regression
���
● ●
���
Residuals
● ●
● ● ●
●
●
●●
●
● ●
●
●
● ● ●
●● ●
● ●
●
●
● ●
��
CORRELATION OF COEFFICIENTS ORGC ( Intercept ) log10 ( Q ) log10 ( SC ) log10 ( Turb ) ( Intercept ) 1 -0.5581 -0.9852 -0.3450 log10 ( Q ) -0.5581 1 0.5737 -0.4695 log10 ( SC ) -0.9852 0.5737 1 0.2378 log10 ( Turb ) -0.3450 -0.4695 0.2378 1
●
●
●●
●
●
●
●
●
●
● ●
●
●
● ●
●
●
● ●
EXPLANATION
��
● ●
5
10 15 Estimated total organic carbon, in milligrams per liter
ORIGIN LINE CONSTITUENT FOR STREAMFLOW-GAGING STATION
20
Comprehensive descriptions of abbreviations for the computer output related to the regression analysis documented in this figure are shown in figure 3.
Figure Summary of regression analysis total organic carbon for 08070200 East streamflow-gaging Fork San Jacinto near New08070200 Caney, Figure 12. 12.Summary of regression analysis forfor total organic carbon for(OrgC) U.S. Geological Survey station Tex. based on data as described in text for period 2005–09. East Fork San Jacinto River near New Caney, Texas, 2005–9.
Regression Model Development Inflow Statistics of Applicable Explanatory Variables:
[Min., minimum, Qu., quartile, Max., maximum]
EXPLANATORY VARIABLE SUMMARY STATISTICS log10 ( Turb ) I ( log10 ( Turb ) ^2) sin2piD Min . :0.8633 Min . :0.7453 Min . : -0.99894 1 st Qu .:1.0792 1 st Qu .:1.1646 1 st Qu .: -0.59438 Median :1.2041 Median :1.4499 Median : 0.13659 Mean :1.3642 Mean :1.9853 Mean : 0.08057 3 rd Qu .:1.6232 3 rd Qu .:2.6349 3 rd Qu .: 0.77665 Max . :2.2304 Max . :4.9749 Max . : 0.99998
cos2piD Min . : -0.99777 1 st Qu .: -0.66325 Median : 0.19970 Mean : 0.05389 3 rd Qu .: 0.67111 Max . : 0.99336
Summary of Regression Analysis for the Constituent of: Escherichia coli (ECB)
Nomenclature (all potential variables) 1 Q is streamflow, in cubic feet per second;
SUMMARY STATISTICS FOR ECB , IN LOG10 () most probable number per 100 milliliters Min . 1 st Qu . Median Mean 3 rd Qu . Max . 1.114 1.740 2.041 2.277 2.716 4.643 REGRESSION EQUATION lm ( formula = log10 ( ECB ) ~ log10 ( Turb ) + log10 ( Turb ) ^2 cos2piD , data = the . data ) Residuals : Min 1 st Qu . Median -0.7373 -0.1958 -0.0143
+ sin2piD +
1 pH is pH, in standard units; 1 SC is specific conductance, in microsiemens per centimeter at 25° Celsius; 1 Turb is turbidity in Formazine Nephelometric Units; 1 Temp is water temperature, in ° Celsius;
3 rd Qu . Max 0.2422 0.9307
1 Date is Julian day DOY (days into year) divided by 365.25; and
Coefficients :
1 log10 (x) is base-10 logarithm of x.
Estimate Std . Error t - value Pr ( >| t |) ( Intercept ) 4.21852 1.02533 4.114 0.000168 *** log10 ( Turb ) -4.43709 1.45936 -3.040 0.003970 ** log10 ( Turb ) ^2 2.06978 0.49393 4.190 0.000132 *** sin2piD -0.12086 0.07790 -1.552 0.127932 cos2piD 0.22499 0.08888 2.531 0.015009 * --Signif . codes : 0 "***" 0.001 "**" 0.01 "*" 0.05 "." 0.1 " " 1
Algebraic Equation log10 (ECB) = 4.2185 − 4.4371 log10 (Turb)
+ 2.0700 log10 (Turb)2
Residual standard error : 0.388 on 44 degrees of freedom Multiple R - squared : 0.7968 , Adjusted R - squared : 0.7783 F - statistic : 43.12 on 4 and 44 DF , p - value : 1.106 e -14
− 0.1209 sin[2π(Date)]
+ 0.2250 cos[2π(Date)]
Variance inflation factors : log10 ( Turb ) log10 ( Turb ) ^2 86.0980 87.7590
sin2piD 1.0155
cos2piD 1.2253
Duan (1983) smearing factor : 1.4893 = mean (10^[ residuals ( model ) ]) ( Detransformed estimates are to be multiplied this factor .)
���
Residual Plot for Regression CORRELATION OF COEFFICIENTS ECB ( Intercept ) log10 ( Turb ) log10 ( Turb ) ^2 1 -0.9929 0.9752 -0.9929 1 -0.9939 0.9752 -0.9939 1 -0.0179 -0.0012 0.0149 -0.3501 0.3715 -0.3929
●
●
( Intercept ) log10 ( Turb ) log10 ( Turb ) ^2 sin2piD cos2piD
●
���
● ●
��
���
● ●●
●
●
●
●
● ● ●
●
● ● ● ● ● ● ● ●●● ● ● ● ● ● ● ●
●
●
●
● ●
●
●
●
●
●
●
●
EXPLANATION
● ●
��
cos2piD -0.3501 0.3715 -0.3929 -0.0248 1
● ●
Residuals
sin2piD -0.0179 -0.0012 0.0149 1 -0.0248
●
200 500 2000 10000 50000 Estimated Escherichia coli bacteria, in most probable number per 100 milliliters
ORIGIN LINE CONSTITUENT FOR STREAMFLOW-GAGING STATION
50
Comprehensive descriptions of abbreviations for the computer output related to the regression analysis documented in this figure are shown in figure 3.
Figure Summary of regression analysis Escherichia for 08070200 East Fork San Jacinto near New08070200 Caney, Tex. Figure 13. 13.Summary of regression analysis for for Escherichia colicoli for (ECB) U.S. Geological Survey streamflow-gaging station based on data as described in text for period 2005–09. East Fork San Jacinto River near New Caney, Texas, 2005–9.
21
22
Regression Model Development and Computational Procedures in Two Tributaries to Lake Houston, 2005–9 Inflow Statistics of Applicable Explanatory Variables: EXPLANATORY VARIABLE SUMMARY STATISTICS Min . 1 st Qu . Median Mean 3 rd Qu . 0.8633 1.0790 1.2040 1.3610 1.6130
[Min., minimum, Qu., quartile, Max., maximum]
Max . 2.2300
Summary of Regression Analysis for the Constituent of: suspended sediment (SS)
Nomenclature (all potential variables) / Q is streamflow, in cubic feet per second;
SUMMARY STATISTICS FOR SS , IN LOG10 () milligrams per liter Min . 1 st Qu . Median Mean 3 rd Qu . Max . 0.7782 1.1900 1.4310 1.5460 1.7310 3.0370
/ pH is pH, in standard units; / SC is specific conductance, in microsiemens per centimeter at 25° Celsius;
REGRESSION EQUATION lm ( formula = log10 ( SS ) ~ log10 ( Turb ) , data = the . data ) Residuals : Min 1 st Qu . Median -0.59759 -0.18961 -0.05024
/ Turb is turbidity in Formazine Nephelometric Units;
3 rd Qu . Max 0.08017 1.03328
/ Temp is water temperature, in ° Celsius; / Date is Julian day DOY (days into year) divided by 365.25; and
Coefficients : Estimate Std . Error t - value Pr ( >| t |) ( Intercept ) 0.06566 0.19021 0.345 0.731 log10 ( Turb ) 1.08800 0.13538 8.037 1.68 e -10 *** --Signif . codes : 0 "***" 0.001 "**" 0.01 "*" 0.05 "." 0.1 " " 1
/ log10 (x) is base-10 logarithm of x. Algebraic Equation
Residual standard error : 0.3382 on 49 degrees of freedom Multiple R - squared : 0.5686 , Adjusted R - squared : 0.5598 F - statistic : 64.59 on 1 and 49 DF , p - value : 1.680 e -10
log10 (SS) = 0.0657 + 1.0880 log10 (Turb)
Variance inflation factors : log10 ( Turb ) 1 Duan (1983) smearing factor : 1.4908 = mean (10^[ residuals ( model ) ]) ( Detransformed estimates are to be multiplied this factor .)
���
Residual Plot for Regression CORRELATION OF COEFFICIENTS SS ( Intercept ) log10 ( Turb ) ( Intercept ) 1 -0.9685 log10 ( Turb ) -0.9685 1
● ● ●
���
● ● ● ● ●
���
● ● ● ●
��
Residuals
●
●
●● ● ● ● ●● ● ● ● ● ● ●
●
● ●●
●
● ●
●
●
● ●●
●● ● ● ●
● ●
● ●
●
��
EXPLANATION ●
10
20 20
50
100
ORIGIN LINE CONSTITUENT FOR STREAMFLOW-GAGING STATION
200
Estimated suspended sediment, Estimated suspended sediment, in milligrams per liter in milligrams per liter
Comprehensive descriptions of abbreviations for the computer output related to the regression analysis documented in this figure are shown in figure 3.
Figure Summary of regression analysis suspended sediment 08070200Survey East Fork San Jacinto nearstation New Caney, Figure 14. 14.Summary of regression analysis forfor suspended sediment for(SS) U.S.for Geological streamflow-gaging 08070200 Tex. based on data as described in text for period 2005–09. East Fork San Jacinto River near New Caney, Texas, 2005–9.
Summary
Computational Procedures of Concentration and Loads ,PSOHPHQWDWLRQ�RI�WKH����HTXDWLRQV�VKRZQ�LQ�¿JXUHV� 4-14 for estimation of constituent concentration is done in this report in the context of concurrent reporting of 90-percent prediction intervals. The prediction interval computation is important because the equations documented in this report are readily used for real-time estimation of the constituents. The regression equations documented in this report provide a computed constituent record available through the online USGS National Real-Time Water-Quality website (NRTWQ) (http://nrtwq.usgs.gov/ks). A thorough description and presentation of numerical results for a selected equation for selected stream conditions has been provided so that interested parties can verify the basic algorithmic framework needed to implement the equations in this report. Example algorithmic frameworks are described in succession in appendix 2 (for constituents with noncensored data) and appendix 3 (for constituents containing censored data). By way of example, these appendixes describe the application of the equations described LQ�¿JXUHV���DQG����IRU�FRPSXWDWLRQ�RI�DQ�LQVWDQWDQHRXV� 15-minute load (15 minutes is the smallest time interval for computing continuously measured water-quality values). The implementation does not involve a particularly high level of mathematics, but basic knowledge of logarithms, statistics associated with regression, and matrix algebra is required.
Summary In December 2005, the U.S. Geological Survey (USGS), in cooperation with the City of Houston, Texas, began collecting discrete water-quality samples for nutrients, total organic carbon, bacteria (Escherichia coli and total coliform), DWUD]LQH��DQG�VXVSHQGHG�VHGLPHQW�DW�WZR�86*6�VWUHDPÀRZ� gaging stations that represent watersheds contributing to Lake Houston (08068500 Spring Creek near Spring, Tex., and 08070200 East Fork San Jacinto River near New Caney, Tex.). These sampling sites are respectively referred to as the Spring Creek site and East Fork San Jacinto River site. Data from discrete water-quality samples collected during 2005–9, in conjunction with continuously monitored real-time data WKDW�LQFOXGHG�VWUHDPÀRZ�DQG�RWKHU�SK\VLFDO�ZDWHU�TXDOLW\� SURSHUWLHV��VSHFL¿F�FRQGXFWDQFH��S+��ZDWHU�WHPSHUDWXUH�� turbidity, and dissolved oxygen), were used to develop regression models for estimation of concentrations of water- quality constituents of substantial source watersheds to Lake Houston. The regression models presented in this report are site VSHFL¿F�WR�VWUHDPÀRZ�JDJLQJ�VWDWLRQV�RQ�WZR�WULEXWDULHV�WR� /DNH�+RXVWRQ��KRZHYHU��WKH�PHWKRGV�WKDW�ZHUH�GHYHORSHG�DQG�
23
documented could be applied to most perennial streams for the purpose of estimating real-time water quality data. �7KH�FRQWLQXRXVO\�PRQLWRUHG�VWUHDPÀRZ�DQG�RWKHU� physical water-quality properties, in conjunction with regression models that use those data as surrogates for selected constituents (nitrite plus nitrate nitrogen, total phosphorus, total organic carbon, E. coli, atrazine, and suspended sediment) can be used to estimate concentrations for constituents lacking continuous record. 6WUHDPÀRZ��SK\VLFDO�ZDWHU�TXDOLW\�SURSHUWLHV��DQG� selected constituent concentrations were collected at the two sites. During 2005–9, discrete samples were collected at the Spring Creek site (58 samples) and at the East Fork San Jacinto River site (51 samples). Hydrologic conditions within the Spring Creek and East Fork San Jacinto River sites vary and might affect chemical constituent concentrations, so discrete water-quality samples were collected over a ZLGH�UDQJH�RI�VWUHDPÀRZ�FRQGLWLRQV��'LVFUHWH�ZDWHU�TXDOLW\� VDPSOHV�IRU�WKH�¿UVW�\HDU��'HFHPEHU�����±1RYHPEHU����� � of this study were collected about every 2 weeks to facilitate detection of seasonal patterns in water quality. Samples DW�WKHVH�¿[HG�IUHTXHQF\�VDPSOH�WLPHV�ZHUH�FROOHFWHG�DV� scheduled without regard to hydrologic condition, such as ULVLQJ��IDOOLQJ��RU�VWDEOH�VWUHDPÀRZ��'XULQJ�VWRUPV�RU�SHULRGV� RI�KLJK�ÀRZ��XQVFKHGXOHG�VDPSOHV�ZHUH�DOVR�SHULRGLFDOO\� FROOHFWHG�GXULQJ�WKH�¿UVW�\HDU�RI�WKH�VWXG\��'XULQJ�WKH�VHFRQG� and third year of the study (December 2006–December 2008) discrete water-quality samples were collected approximately once a month at both the Spring Creek and East Fork San Jacinto River sites. During the fourth year of the study (December 2008–December 2009), an approximate monthly sampling schedule was maintained for the Spring Creek site, whereas samples collected at East Fork San Jacinto River site were reduced to a quarterly schedule. Instead of sampling on D�¿[HG�IUHTXHQF\�GXULQJ�WKH�VHFRQG�WKURXJK�IRXUWK�\HDUV�RI� the study, stormwater-runoff samples were collected whenever possible. 5HJUHVVLRQ�DQDO\VHV�ZHUH�GRQH�E\�XVLQJ�VWUHDPÀRZ�� continuous water-quality, and discrete water-quality data collected during 2005–9 at the Spring Creek and East Fork San Jacinto River sites. The R environment for statistical computing was used to develop algebraically representable, multiple-linear regression equations to (1) estimate concentrations for selected water-quality constituents and (2) HVWLPDWH�SUHGLFWLRQ�LQWHUYDOV�RU�TXDQWL¿FDWLRQ�RI�XQFHUWDLQW\�� The potential explanatory or predictive variables included VWUHDPÀRZ��VSHFL¿F�FRQGXFWDQFH��S+��ZDWHU�WHPSHUDWXUH�� turbidity, dissolved oxygen, and time (to account for seasonal variations inherent in some water-quality data). The response variables at each site were nitrite plus nitrate nitrogen, total phosphorus, organic carbon, E. coli, atrazine, and suspended sediment. Logarithmic transformations (base-10) on the response and explanatory variables were used to improve linearity and to mitigate for nonnormality and heteroscedasticity in model residuals. The explanatory variables provide easily measured quantities as a means to
24
Regression Model Development and Computational Procedures in Two Tributaries to Lake Houston, 2005–9
estimate concentrations of the various constituents under investigation, with accompanying estimates of measurement uncertainty. Each regression equation can be used to estimate concentrations of a given constituent in real time on the basis of explanatory variables also measured in real time. Corresponding 90-percent prediction intervals can be computed to display the uncertainty associated with the estimate. Factors used as indicators of general model reliability include the adjusted R-squared, the residual standard error, residual plots, and p-values. Regression equations for the Spring Creek site were developed for nitrite plus nitrate nitrogen, total phosphorus, organic carbon, E. coli bacteria, atrazine, and suspended sediment. Adjusted R-squared values for the Spring Creek models ranged from .582–.922 (dimensionless). The residual standard errors ranged from .073–.447 (base-10 logarithm). Regression equations for the East Fork San Jacinto River site were developed for nitrite plus nitrate nitrogen, total phosphorus, organic carbon, E. coli bacteria, and suspended sediment. Adjusted R-squared values for the East Fork San Jacinto River models ranged from .253–.853 (dimensionless). The residual standard errors ranged from .076–.388 (base-10 logarithm). In conjunction with estimated concentrations, constituent loads can be estimated by multiplying the estimated FRQFHQWUDWLRQ�E\�WKH�FRUUHVSRQGLQJ�VWUHDPÀRZ�DQG�E\� applying the appropriate conversion factor. By calculating loads from estimated constituent concentrations, a continuous record of estimated loads can be produced.
References Aga, D.S., and Thurman, M.T., 1997, Environmental immunoassays—Alternative techniques for soil and water DQDO\VLV�>DEV�@��$PHULFDQ�&KHPLFDO�6RFLHW\�6\PSRVLXP� Series 657, p. 1–20. American Public Health Association, American Water Works Association and Water Environment Federation, 2005, Standard methods for the examination of water and wastewater (21st ed.): Washington, D.C., American Public Health Association, p. 9–72 to 9–74. Buchanan, T.J., and Somers, W.P., 1969, Discharge measurements at gaging stations: U.S. Geological Survey Techniques of Water-Resources Investigation, book 3, chapter A8, 65 p., accessed May 3, 2008, at http://pubs.usgs. gov/twri/twri3a8/. &KLOGUHVV��&�-�2���)RUHPDQ��:�7���&RQQRU��%�)���DQG�0DORQH\�� T.J., 1999, New reporting procedures based on long-term method detection levels and some considerations for interpretations of water-quality data provided by the U.S. Geological Survey National Water Quality Laboratory: U.S. *HRORJLFDO�6XUYH\�2SHQ�)LOH�5HSRUW���±��������S�
&KULVWHQVHQ��9�*���-LDQ��;LDRGRQJ��DQG�=LHJOHU��$�&��������� Regression analysis and real-time water-quality monitoring to estimate constituent concentrations, loads and yields in the Little Arkansas River, south-central Kansas, 1995–99: U.S. Geological Survey Water-Resources Investigations Report 00-4126, 36 p. City of Houston, 2011, Public Works and Engineering 'ULQNLQJ�:DWHU�2SHUDWLRQV��DFFHVVHG�0DUFK�������DW�KWWS��� www.publicworks.houstontx.gov/utilities/drinkingwater. html. Cohn, T.A., 2005, Estimating contaminant load in rivers— An application of adjusted maximum likelihood to type 1 censored data: Water Resources Research, v. 41, no. 8, 13 p. Crawford, Charles, 1991, Estimation of suspended-sediment rating curves and mean suspended-sediment loads: Journal of Hydrology, v. 129, p. 331–348. Duan, Naihua, 1983, Smearing estimate—A nonparametric retransformation method: Journal of the American Statistical Association, v. 78, p. 605–610. Faraway, J.J., 2005, Linear models with R: Boca Raton, Fla., Chapman and Hall, CRC press, 240 p. )LQQH\��'�-���������2Q�WKH�GLVWULEXWLRQ�RI�D�YDULDWH�ZKRVH� logarithm is normally distributed: Journal of the Royal Statistical Society Supplement, v. 7, p. 155–161. Fishman, M.J., ed., 1993, Methods of analysis by the U.S. Geological Survey National Water Quality Laboratory— Determination of inorganic and organic constituents in ZDWHU�DQG�ÀXYLDO�VHGLPHQWV��8�6��*HRORJLFDO�6XUYH\�2SHQ� File Report 93–125, 217 p. Guy, H.P., 1969, Laboratory theory and methods for sediment analysis: U.S. Geological Survey Techniques of Water Resources Investigations, book 5, chapter C1, 58 p., accessed May 4, 2008, at http://pubs.usgs.gov/twri/twri5c1/. Harris-Galveston Subsidence District, 1999 [amended ����@��'LVWULFW�UHJXODWRU\�SODQ��DFFHVVHG�$SULO����������� at http://www.hgsubsidence.org/assets/pdfdocuments/ HGRegPlan.pdf. Helsel, D.R., 2005, Nondetects and data analysis—Statistics for censored environmental data: New Jersey, Wiley, 250 p. Helsel, D.R., and Hirsch, R.M., 2002, Statistical methods in water resources, in Hydrologic analysis and interpretation: U.S. Geological Survey Techniques of Water-Resources Investigations, book 4, chapter A3, accessed June 2009, at http://pubs.usgs.gov/twri/twri4a3. Kaplan, E.L., and Meier, Paul, 1958, Nonparametric estimation of incomplete observations: Journal of the American Statistical Association, v. 53, p. 457–481.
References Kasmarek, M.C., Johnson, M.R., and Ramage, J.K., 2010, Water-level altitudes 2010 and water-level changes in the Chicot, Evangeline, and Jasper aquifers and compaction 1973–2009 in the Chicot and Evangeline aquifers, Houston- *DOYHVWRQ�UHJLRQ��7H[DV��8�6��*HRORJLFDO�6XUYH\�6FLHQWL¿F� Investigations Map 3138, 17 p., 16 sheets, 1 appendix. Kasmarek, M.C., and Strom, E.W., 2002, Hydrogeology DQG�VLPXODWLRQ�RI�JURXQG�ZDWHU�ÀRZ�DQG�ODQG�VXUIDFH� subsidence in the Chicot and Evangeline aquifers, Houston area, Texas: U.S. Geological Survey Water-Resources Investigations Report 02–4022, 61 p. Kennedy, E.J., 1983, Computation of continuous records RI�VWUHDPÀRZ��8�6��*HRORJLFDO�6XUYH\�7HFKQLTXHV�RI� Water-Resources Investigation, book 3, chapter A13, 53 p., accessed May 3, 2008, at http://pubs.usgs.gov/twri/ twri3-a13/. Kennedy, E.J., 1984, Discharge ratings at gaging stations: U.S. Geological Survey Techniques of Water-Resources Investigation, book 3, chapter A10, 59 p., accessed May 3, 2008, at http://pubs.usgs.gov/twri/twri3-a10/. Lee, Lopaka, 2009, NADA—Nondetects and data analysis for environmental data: R package version 1.5-3, dated December 22, 2010, initial package release June 24, 2004, http://www.cran.r-project.org/package=NADA. Maindonald, J.H., and Braun, John, 2003, Data analysis and graphics using R—An example-based approach: Cambridge, Cambridge University Press, 362 p. Mathes, W.J., Sholar, C.J., and George, J.R., 1992, Quality- DVVXUDQFH�SODQ�IRU�DQDO\VLV�RI�ÀXYLDO�VHGLPHQW��8�6�� *HRORJLFDO�6XUYH\�2SHQ�)LOH�5HSRUW���±��������S��� accessed May 4, 2008, at http://pubs.er.usgs.gov/usgspubs/ ofr/ofr91467. McFadden, Daniel, 1974, The measurement of urban travel demand: Journal of Public Economics, v. 3, 303–328. Mueller, D.K., and Spahr, N.E., 2005, Water-quality, VWUHDPÀRZ��DQG�DQFLOODU\�GDWD�IRU�QXWULHQWV�LQ�VWUHDP�DQG� rivers across the nation, 1992–2001: U.S. Geological Survey Data Series 152, accessed July 15, 2009, at http:// pubs.usgs.gov/ds/2005/152/. Multi-Resolution Land Characteristics Consortium, 2003, National land cover dataset 2001, zone 10: accessed 2FWREHU�����������DW�http://www.mrlc.gov/multizone_ download.php?zone=10. 1DWLRQDO�2FHDQLF�DQG�$WPRVSKHULF�$GPLQLVWUDWLRQ�������� Southeast Texas climate data: National Weather Service )RUHFDVW�2I¿FH��+RXVWRQ�*DOYHVWRQ��7H[���DFFHVVHG�0DUFK� 13, 2011, at http://www.srh.noaa.gov/hgx/climate.htm.
25
2GHQ��7�'���$VTXLWK��:�+���DQG�0LOEXUQ��0�6��������� Regression models to estimate real-time concentrations of selected constituents in two tributaries to Lake Houston near Houston, Texas, 2005–07: U.S. Geological Survey 6FLHQWL¿F�,QYHVWLJDWLRQV�5HSRUW�����±���������S� Patton, C.J., and Truitt, E.P., 2000, Methods of analysis by the U.S. Geological Survey National Water Quality Laboratory—Determination of ammonium plus organic nitrogen by a Kjeldahl digestion method and an automated SKRWRPHWULF�¿QLVK�WKDW�LQFOXGHV�GLJHVW�FOHDQXS�E\�JDV� GLIIXVLRQ��8�6��*HRORJLFDO�6XUYH\�2SHQ�)LOH�5HSRUW� 00–170, 31 p. R Development Core Team, 2010, R—A language and environment for statistical computing (version 2.12.2): 5�)RXQGDWLRQ�IRU�6WDWLVWLFDO�&RPSXWLQJ��9LHQQD��$XVWULD�� (Also available at http://www.R-project.org.) 5DVPXVVHQ��3�3���*UD\��-�5���*O\VVRQ��*�'���DQG�=LHJOHU�� A.C., 2009, Guidelines and procedures for computing time-series suspended-sediment concentrations and loads IURP�LQ�VWUHDP�WXUELGLW\�VHQVRU�DQG�VWUHDPÀRZ�GDWD��8�6�� Geological Survey Techniques and Methods, book 3, chap. C4, 52 p. 5DVPXVVHQ��7�-���/HH��&�-���DQG�=LHJOHU��$�&���������(VWLPDWLRQ� of constituent concentrations, loads, and yields in streams of Johnson County, northeast Kansas, using continuous water- TXDOLW\�PRQLWRULQJ�DQG�UHJUHVVLRQ�PRGHOV��2FWREHU������ WKURXJK�'HFHPEHU�������8�6��*HRORJLFDO�6XUYH\�6FLHQWL¿F� Investigations Report 2008–5014, 103 p. Ryberg, K.R., 2006, Continuous water-quality monitoring and regression analysis to estimate constituent concentrations and loads in the Red River of the North, Fargo, North 'DNRWD������±����8�6��*HRORJLFDO�6XUYH\�6FLHQWL¿F� Investigations Report 2006–5241, 35 p. 6QHFN�)DKUHU��'�$���0LOEXUQ��0�6���(DVW��-�:���DQG�2GHQ�� J.H., 2005, Water-quality assessment of Lake Houston near Houston, Texas, 2000–2004: U.S. Geological Survey 6FLHQWL¿F�,QYHVWLJDWLRQV�5HSRUW�����±���������S� Stine, R.A., 1995, Graphical interpretation of variance LQÀDWLRQ�IDFWRUV��7KH�$PHULFDQ�6WDWLVWLFLDQ��Y������QR�����S�� 53–56 Stoeckel, D.M., Bushon, R.N., Demcheck, D.K., Skrobialowski, S.C., Kephart, C.M., Bertke, E.E., 0DLORW��%�(���0L]H��6�9���DQG�)HQGLFN��5�%���-U��������� Bacteriological water quality in the Lake Pontchartrain Basin, Louisiana, following Hurricanes Katrina and Rita, September 2005: U.S. Geological Survey Data Series 143, 21 p.
26
Regression Model Development and Computational Procedures in Two Tributaries to Lake Houston, 2005–9
Texas Commission on Environmental Quality, 2011, Texas water quality inventory and 303(d) list: accessed August 10, 2011, at http://www.tceq.texas.gov/assets/public/ compliance/monops/water/08twqi/2008_303d.pdf. Texas State Climatologist, 2011, Texas climatic bulletin: 2I¿FH�RI�WKH�7H[DV�6WDWH�&OLPDWRORJLVW��&ROOHJH�RI� Geosciences, Department of Atmospheric Sciences, Texas A&M University, accessed March 16, 2011, at http://www. PHW�WDPX�HGX�RVF�7;FOLPDW�KWPO� Texas State Data Center, 2011, 2009 total population estimates IRU�7H[DV�PHWURSROLWDQ�VWDWLVWLFDO�DUHDV��2I¿FH�RI�WKH�6WDWH� Demographer, Texas population estimates and projection program, accessed March 16, 2011, at http://txsdc.utsa.edu/ tpepp/2009_txpopest_msa.php. 7XUQLSVHHG��'�3���DQG�6DXHU��9�%���������'LVFKDUJH� measurements at gaging stations: U.S. Geological Survey Techniques and Methods, book 3, chap. A8, 87 p. 8�6��&HQVXV�%XUHDX��������&HQVXV������VXPPDU\�¿OH����6)� � �����SHUFHQW�GDWD��DFFHVVHG�2FWREHU�����������DW�KWWS��� IDFW¿QGHU�FHQVXV�JRY�VHUYOHW�'&*HR6HOHFW6HUYOHW"GVB name=DEC_2000_SF1_U. U.S. Environmental Protection Agency, 1993, Methods for the determination of inorganic substances in environmental VDPSOHV��&LQFLQQDWL��2KLR��(QYLURQPHQWDO�0RQLWRULQJ� Systems Laboratory, EPA/600/R–93/100, 79 p.
8�6��*HRORJLFDO�6XUYH\�>YDULRXVO\�GDWHG@��1DWLRQDO�¿HOG� manual for the collection of water-quality data: U.S. Geological Survey Techniques of Water-Resources Investigations, book 9, chapters A1–A9. (Also available at http://pubs.water.usgs.gov/twri9A.) U.S. Geological Survey, 2011, National Water Information System: accessed March 16, 2011, at http://waterdata.usgs. gov/tx/nwis/. :DJQHU��5�-���%RXOJHU��5�:���-U���2EOLQJHU��&�-���DQG�6PLWK�� B.A., 2006, Guidelines and standard procedures for continuous water-quality monitors—Station operation, record computation and data reporting: U.S. Geological Survey Techniques and Methods 1–D3, 51 p., 8 attachments, accessed May 3, 2008, at http://pubs.usgs.gov/ tm/2006/tm1D3/. Wang, Dongliang, Hutson, A.D., and Miecznikowski, J.C., 2010, L-moment estimation for parametric survival models given censored data: Statistical Methodology, v. 7, no. 6, p. 655–667. Wershaw, R.L., Fishman, M.J., Grabbe, R.R., and Lowe, L.E., eds., 1987, Methods for the determination of organic VXEVWDQFHV�LQ�ZDWHU�DQG�ÀXYLDO�VHGLPHQWV��8�6��*HRORJLFDO� Survey Techniques of Water-Resources Investigations, book 5, chapter A3, 80 p.
Appendix 1
Appendix 1
27
28
Regression Model Development and Computational Procedures in Two Tributaries to Lake Houston, 2005–9
Appendix 1. Results from environmental and quality-control sample pairs and equipment blanks collected for two tributaries (Spring Creek and East Fork San Jacinto River) to Lake Houston near Houston, Texas, 2005–9. >(QYLURQ���(QYLURQPHQWDO��²��QRW�DQDO\]HG�����OHVV�WKDQ�ODERUDWRU\�UHSRUWLQJ�OHYHO��(��HVWLPDWHG�� ��YDOXH�UHYLHZHG�DQG�UHMHFWHG��!��JUHDWHU�WKDQ��(TXLS���(TXLSPHQW@
Sample date
Sample time
Sample type
Ammonia plus organic nitrogen, water ,filtered (milligrams per liter as nitrogen)
Ammonia plus organic nitrogen, water, unfiltered (milligrams per liter as nitrogen)
Ammonia, water, filtered (milligrams per liter as nitrogen)
Nitrite plus nitrate, water, filtered (milligrams per liter as nitrogen)
Nitrite, water, filtered (milligrams per liter as nitrogen)
Orthophosphate, water, filtered (milligrams per liter as phosphorus)
Spring Creek near Spring, Tex. 08068500 12/1/2005
1330
Environ.
0.85
1.3
0.08
6.87
0.028
1.56
12/1/2005
1331
Replicate
—
—
—
—
—
—
2/7/2006
1400
Environ.
0.75
1.1
0.06
4.52
0.02
0.95
2/7/2006
1401
Replicate
—
—
—
—
—
—
2/21/2006
1400
Environ.
1.1
1.4
0.39
4.01
0.054
0.91
2/21/2006
1401
Replicate
1.2
1.4
0.38
4.04
0.054
0.91
5/16/2006
1115
Environ.
0.78
1.8
����
1.33
0.069
0.63
5/16/2006
1116
Replicate
0.78
1.9
����
1.32
0.07
0.64
6/20/2006
1000
Environ.
0.86
1.5
0.035
0.35
0.034
0.197
6/20/2006
1001
Replicate
—
—
—
—
—
—
6/28/2006
845
Blank
0.12
����
0.015
����
�����
�����
6/28/2006
930
Environ.
1
1.2
0.088
4.66
0.028
1.01
7/12/2006
1300
Environ.
0.83
1.1
0.058
3.36
0.057
0.719
7/12/2006
1346
Replicate
—
—
—
—
—
—
8/23/2006
1320
Blank
E.07
����
�����
����
�����
�����
8/23/2006
1345
Environ.
0.77
1.8
�����
2.12
0.021
0.738
9/20/2006
1230
Environ.
1.1
1.5
0.166
2.01
0.101
0.891
9/20/2006
1231
Replicate
1.1
1.5
0.17
2.02
0.101
0.901
8/15/2007
1420
Environ.
0.64
0.73
0.055
3.56
0.053
0.735
8/15/2007
1421
Replicate
—
—
—
—
—
—
2/14/2008
1110
Environ.
0.7
1.1
0.011
1.47
0.022
0.252
2/14/2008
1110
Replicate
—
—
—
—
—
—
11/13/2008
1315
Environ.
0.5
0.9
�����
0.14
0.006
0.069
11/13/2008
1316
Replicate
0.51
0.91
�����
0.15
0.006
0.068
3/10/2009
1027
Environ.
1
1.3
0.189
4.66
0.066
1.24
3/10/2009
1028
Replicate
1
1.3
0.189
4.65
0.066
1.25
7/29/2009
1120
Environ.
0.94
1.3
0.085
5.72
0.101
1.65
7/29/2009
1121
Replicate
0.96
1.3
0.078
5.8
0.102
1.66
12/1/2005
1020
Environ.
�����
0.03
12/1/2005
1021
Replicate
—
—
—
—
—
—
12/21/2005
930
Blank
E.06
����
����
����
�����
����
12/21/2005
1030
Environ.
0.45
0.38
����
0.07
�����
����
3/7/2006
1130
Environ.
0.46
0.44
����
0.07
�����
E.01
3/7/2006
1131
Replicate
—
—
—
—
—
—
4/4/2006
1100
Environ.
0.74
0.8
0.05
0.17
E.006
0.02
East Fork San Jacinto River near New Caney, Tex. 08070200 0.14
0.23
����
0.1
Appendix 1
Phosphorus, water, filtered (milligrams per liter)
Phosphorus, water, unfiltered (milligrams per liter)
Escherichia coli, Colilert Quantitray method, water (most probable number per 100 milliliters)
Total coliform, Colilert Quantitray method, water (most probable number per 100 milliliters)
Atrazine, water, filtered, recoverable, immunoassay, unadjusted (micrograms per liter)
Organic carbon, water, unfiltered (milligrams per liter)
Suspended sediment (milligrams per liter)
Spring Creek near Spring, Tex. 08068500 1.61
1.73
130
!����
0.3
9.6
—
—
90
!����
—
—
36
0.97
1.11
60
3400
0.95
9.8
—
—
55
3300
—
—
0.87
1.05
37
6100
1.51
9.6
24
0.86
1.02
27
6500
1.34
9.3
23
0.66
0.87
490
110000
2.56
13.4
60
0.68
0.85
690
98000
2.68
15.3
0.24
0.44
8000
410000
1.45
17
— 33 —
61 547
—
—
7100
460000
—
—
����
����
—
—
����
���
— ��
1
1.25
43
!����
0.62
8.9
31
0.7
0.89
120
41000
0.68
9
—
—
190
69000
—
����
����
0.78
1
0.94 0.95
38 —
—
—
—
����
���
��
6800
440000
1.75
14.1
147
1.1
270
82000
1.73
13.1
56
1.09
360
49000
1.77
10.3
46
0.75
0.92
310
17000
0.18
8.1
—
—
190
17000
—
—
0.27
0.41
2200
33000
1.95
11.6
42 — 43
—
—
2100
37000
—
—
0.09
0.19
3300
57000
0.43
11.4
587
—
0.09
0.19
—
—
0.45
11.3
755
1.22
1.34
34
37000
0.64
8.3
32
1.21
1.32
—
—
1
8.3
37
1.62
1.83
20
18000
0.3
9.9
46
1.61
1.77
—
—
0.39
7.8
139
0.039
0.086
East Fork San Jacinto River near New Caney, Tex. 08070200 43
1700
����
4
11
—
—
34
1700
—
—
E.002
�����
��
��
����
���
— 1
0.025
0.058
130
2000
0.1
7.7
16
0.025
0.076
34
1600
����
7.3
17
—
—
34
1700
—
—
0.037
0.09
43
5200
0.13
14.2
— 19
29
30
Regression Model Development and Computational Procedures in Two Tributaries to Lake Houston, 2005–9
Appendix 1. Results from environmental and quality-control sample pairs and equipment blanks collected for two tributaries (Spring Creek and East Fork San Jacinto River) to Lake Houston near Houston, Texas, 2005–9. >(QYLURQ���(QYLURQPHQWDO��²��QRW�DQDO\]HG�����OHVV�WKDQ�ODERUDWRU\�UHSRUWLQJ�OHYHO��(��HVWLPDWHG�� ��YDOXH�UHYLHZHG�DQG�UHMHFWHG��!��JUHDWHU�WKDQ��(TXLS���(TXLSPHQW@
Sample date
Sample time
Sample type
Ammonia plus organic nitrogen, water ,filtered (milligrams per liter as nitrogen)
Ammonia plus organic nitrogen, water, unfiltered (milligrams per liter as nitrogen)
Ammonia, water, filtered (milligrams per liter as nitrogen)
Nitrite plus nitrate, water, filtered (milligrams per liter as nitrogen)
Nitrite, water, filtered (milligrams per liter as nitrogen)
Orthophosphate, water, filtered (milligrams per liter as phosphorus)
East Fork San Jacinto River near New Caney, Tex. 08070200—Continued 4/4/2006
1101
Replicate
0.65
0.8
0.05
0.17
E.007
0.02
7/25/2006
945
Environ.
0.35
0.47
0.027
0.51
0.007
0.059
7/25/2006
946
Replicate
—
—
—
8/8/2006
1000
Environ.
0.38
0.39
0.023
0.22
8/8/2006
1001
Replicate
0.42
0.39
0.022
9/6/2006
1100
Environ.
0.36
0.27
0.025
9/6/2006
1130
Blank
0.14
����
10/4/2006
945
Environ.
0.22
0.3
10/4/2006
946
Replicate
—
—
—
10/18/2006
1330
Environ.
0.65
0.98
�����
10/18/2006
1331
Replicate
—
—
—
—
—
—
1/15/2007
1340
Environ.
0.5
0.76
0.038
0.09
0.003
0.021
1/15/2007
1341
Replicate
0.52
0.78
0.035
0.09
0.003
0.019
5/24/2007
1038
Environ.
—
—
—
—
—
—
5/24/2007
1039
Replicate
—
—
—
—
—
—
8/15/2007
1059
Blank
0.35
����
0.031
����
E.001
�����
8/15/2007
1132
Environ.
—
0.33
�����
0.07
0.004
0.015
4/23/2008
1030
Environ.
0.2
0.32
�����
0.15
0.005
0.021
4/23/2008
1030
Replicate
—
—
—
—
1/7/2009
1050
Environ.
0.27
0.37
E.012
0.08
0.005
0.015
1/7/2009
1051
Replicate
0.3
0.36
E.011
0.08
0.005
0.014
—
—
—
0.002
0.034
0.23
0.003
0.032
0.08
E.001
0.024
E.009
����
�����
�����
E.016
0.15
�����
0.047
— E.05
— 0.003
—
— 0.013
—
Houston Lab at Shenandoah, Tex. 301056095265000 8/22/2006
1330
Equip. Blank
����
����
�����
����
�����
E.003
11/28/2007
1358
Equip. Blank
����
����
�����
����
�����
�����
11/28/2007
1359
Equip. Blank
—
—
—
—
—
—
12/3/2008
1035
Equip. Blank
E.09
����
�����
����
�����
�����
12/3/2008
1555
Equip. Blank
—
����
�����
�����
—
�����
12/3/2008
1615
Equip. Blank
—
E.07
�����
�����
—
�����
Appendix 1
Escherichia coli, Colilert Quantitray method, water (most probable number per 100 milliliters)
Phosphorus, water, filtered (milligrams per liter)
Phosphorus, water, unfiltered (milligrams per liter)
0.041
0.101
50
0.071
0.158
—
—
0.043
Total coliform, Colilert Quantitray method, water (most probable number per 100 milliliters)
Atrazine, water, filtered, recoverable, immunoassay, unadjusted (micrograms per liter)
Organic carbon, water, unfiltered (milligrams per liter)
Suspended sediment (milligrams per liter)
East Fork San Jacinto River near New Caney, Tex. 08070200—Continued 10000
����
12.7
93
9200
����
7
84
12000
—
—
0.111
120
8100
����
5.5
12
0.043
0.111
150
6900
����
6.1
13
0.034
0.113
26
13000
����
4
�����
�����
—
—
����
���
��
0.056
0.124
63
4900
����
4.2
15
—
—
52
3900
0.036
0.134
610
44000
— 0.12
14 6 —
6
— 18.2
— 125
—
—
690
39000
—
—
0.029
0.122
2100
18000
����
16.1
110
0.028
0.123
2000
17000
����
13.3
81
—
—
250
10000
����
—
39
—
—
240
9900
����
—
39
�����
�����
—
—
0.017
0.081
71
15000
����
6.5
0.031
0.068
100
5200
����
5.77
—
—
108
4600
—
—
0.02
0.069
300
7600
����
7.8
168
0.018
0.065
—
—
����
6.5
174
���
—
—
—
—
1 27 45 —
Houston Lab at Shenandoah, Tex. 301056095265000 ����
����
—
—
����
�����
E.006
—
—
—
—
—
—
—
—
0.9
����
����
—
—
—
���
—
�����
—
—
—
E.4
—
—
�����
—
—
—
E.5
—
—
1 — 1
31
32
Regression Model Development and Computational Procedures in Two Tributaries to Lake Houston, 2005–9
Appendix 2—Example computations
Appendix 2—Example computations (definition of terms and quantities, concentration estimates, 90-percent prediction intervals, and loads) for nitrite plus nitrate (N02 N03) at U.S. Geological Survey streamflowgaging station 08070200 East Fork San Jacinto River near New Caney, Texas.
33
34
Regression Model Development and Computational Procedures in Two Tributaries to Lake Houston, 2005–9
Appendix 2—Example computations (definition of terms and quantities, concentration estimates, . . .
Example computations (definition of terms and quantities) for nitrite plus nitrate (NO2 NO3 ) for 08070200 East Fork San Jacinto River near New Caney, Tex. Given values for example problem
Nomenclature (select variables and symbols)
ĩ Q = 7,930 cubic feet per second;
ĩ NO2 NO3 is nitrite plus nitrate in milligrams per liter;
ĩ DOY = 292.5243 day of year (October 19, 2006 at 12:35 hours); and
ĩ Q is streamflow in cubic feet per second; ĩ S is residual scale in base-10 logarithms of milligrams per liter. The survival regression provides the natural logarithm of the residual scale as part of standard (conventional) output. A detransformation by exp() is seen in these examples;
ĩ Co =