REGULARIZED 3D ITERATIVE RECONSTRUCTION ON A MOBILE C-ARM CT Yongsheng Pan and Ross Whitaker∗
Arvi Cheryauka and Dave Ferguson†
Scientific Computing and Imaging Institute University of Utah, Salt Lake City, Utah, 84112
GE Healthcare-Surgery Salt Lake City, Utah, 84116
ABSTRACT 3D iterative CT reconstruction is an active research area in medical imaging. Compared with analytic reconstruction methods such as FDK, iterative methods may provide better reconstruction results for incomplete and noisy projection data. The simultaneous algebraic reconstruction technique (SART), one of the most popular iterative reconstruction methods, is applied in the cone-beam geometry for highresolution reconstruction, with the help of graphics hardware (GPU) and total variation (TV) regularization. GPU greatly improves the efficiency of SART, which is computationally intense for CPU, and thus makes it suitable for clinical applications. TV regularization reduces the effects of noise and helps the convergence of SART for noisy data. Experimental results for both synthetic and real data are provided to evaluate the accuracy and efficiency of the proposed framework. Index Terms— Cone-beam CT, iterative reconstruction, SART, GPU, TV regularization 1. INTRODUCTION Iterative CT reconstruction methods such as SART have been proposed since the late eighties [1]. These methods have advantages over analytical reconstruction methods such as FDK [2] for incomplete and noisy projection data. However, most industrial manufacturers have utilized FDK in their products so far because the high computational cost of SART hinders its practical application. Iterative reconstruction methods have recently become active again due to the rapid developments of commodity hardware, such as GPU [3] [4] and Cell BE processor [5]. This hardware may greatly enhance the efficiency for SART and make SART appropriate for clinical applications. On the other hand, regularizations are usually necessary for SART to reduce the effects of noise and enhance convergence, especially for projection data with strong noise. Totalvariation (TV) minimization is a good method for the regularization of SART. The performance of SART is studied in this paper. A GPU is utilized to improve its efficiency, while TV minimiza∗ Send
correspondence to Ross whitaker (
[email protected]).
[email protected]
†
[email protected],
tion [6] is utilized to regularize the SART algorithm. Reconstruction results for both synthetic and real data are presented. The paper is organized as follows. Section 2 introduces the background information for SART and TV regularization. GPU implementation details are shown in Section 3. Experimental results are provided in Section 4, followed by the summary in Section 5. 2. BACKGROUND Mathematical details of the SART algorithm and the TV regularization are provided in this section. These algorithms form the framework implemented in Section 3. 2.1. Introduction to SART SART [1] takes every pixel in the object to be reconstructed as an unknown variable, and and it takes each projection measurement as a weighted summation of these variables. SART accomplishes CT reconstruction by solving the unknown variables from the acquired measurements. Specifically, SART is designed to solve the following simultaneous equation system pi =
N X
wij vj
(1)
j=1
where pi represents the ith projection, wij represents the weight which the voxel vj contributes its value to the projection i. Reconstruction is achieved by finding vj from the equation system (1). The weight wij is assumed to be known. The SART algorithm solves the equation system by iteratively applying a correction array to each voxel vj as follows o P k P n pi − N m=1 wim vm PN w ij i w P m=1 im vjk+1 = vjk + λ (2) w ij i
where λ is a constant coefficient. This process in Eq. 2 can be decomposed into two steps: the forward projection step and the backward projection step. The forward projection step computes a correction image for each ray, i.e., PN k pi − m=1 wim vm ∆ri = (3) PN m=1 wim
The backward projection step updates each voxel by backprojecting to it the contribution of each correction image, i.e., P i wij ∆ri (4) vjk+1 = vjk + λ P i wij
The SART algorithm has advantages over analytic reconstruction methods based on FDK [2], especially when few projections are available and when the projections are noisy. It is also more stable to the variations in the imaging geometry, such as the moving trajectory of imaging sources and detectors. However, SART is computationally intense, and it may require a lot of memory to store the weight information. Furthermore, regularization is usually necessary for noisy data.
(a)
(b)
(c)
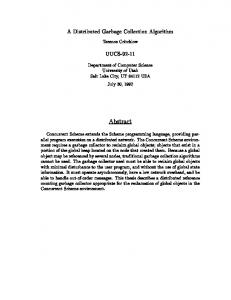
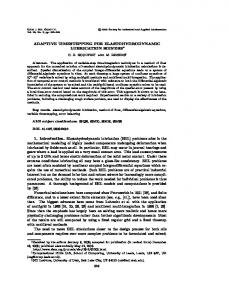
Fig. 1. Illustration of TV regularization. (a) Original noisy image. (b) Image regularized using TV with α = 0.1. (c) Image regularized using TV with α = 0.5.
2.2. Introduction to TV Regularization Total variation regularization [6] is a nonlinear image regularization method that reduces the total variation of an image while keeping the regularized image similar to the original image. Given an image f defined on domain Ω, this method seeks a regularized image u which minimizes the following energy function Z Z α F (u) = k∇uk + ku − f k2 (5) 2 Ω Ω where α is a constant coefficient. This energy functional has the nice property of preserving straight, sharp edges, and thus allows solutions to have a piecewise flat property. The minimization of the energy functional (5) is numerically calculated using the following updating scheme un+1 − un ∇un =∇· − α(u − f ) △t k∇un k
(6)
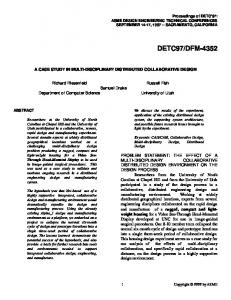
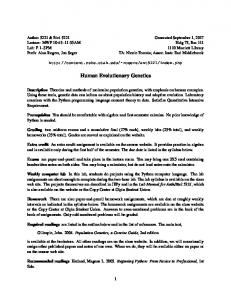
The minimization is iteratively processed until convergence. Fig. 1 illustrates the regularization effects of TV. Fig. 1(b) shows the TV regularization results from the original image Fig. 1(a) with the coefficient α = 0.1, and Fig. 1(c) shows the TV regularization results with the coefficient α = 0.5. It can be seen that the TV regularization results contain less noise than the original image and that the results in Fig. 1(c) are closer to the original image with larger α. 3. IMPLEMENTATION DETAILS SART and TV are combined for iterative reconstruction in this paper. Specifically, Eq. 3, Eq. 4 and Eq. 6 are applied sequentially for a specified number of iteration until convergence. GPU implementation details for Eq. 3 and Eq. 4 are illustrated here, utilizing the methods in [7]. The mechanism of ray-based forward projection for Eq. 3 is illustrated in Fig. 2. For each projection, the ray from the
(a)
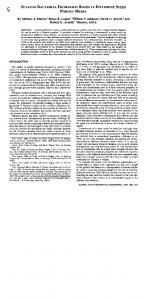
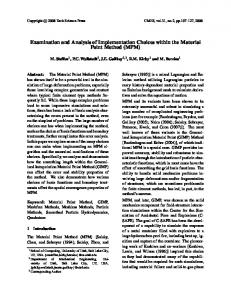
Fig. 2. Illustration of ray-based forward projection using GPU. source to each pixel in the detector plane is spatially determined, and the intersection points of the ray entering and exiting the object are calculated. The projection measurement is then calculated by accumulating the samples from the object along the ray between the intersection points using an equidistant step size. Interpolation methods such as trilinear interpolation may be applied to specify the object value at each sampling point. In the GPU implementation, the object data is stored as a 3D texture to utilize the hardware-accelerated interpolation functionality in the graphics card. Furthermore, GPU computes the weight information on the fly without storing it to save GPU memory. The mechanism of voxel-based backward projection for Eq. 4 is illustrated in Fig. 3. For each voxel in the object, the ray determined by the source and this voxel is utilized to calculate the intersection point with the detector plane. The correction value for this voxel is then calculated by interpolating the values in the detector plane. In the GPU implementation the correction data from the detector plane is stored as a 3D texture for fast data access and efficient hardware-accelerated interpolation. 4. EXPERIMENTAL RESULTS Experimental results for cone-beam CT are presented here to illustrate the GPU implementation of SART. Nvidia CUDA is utilized for the GPU implementation on the Nvidia’s
(a)
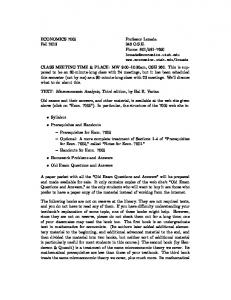
Fig. 3. Illustration of voxel-based backward projection using GPU. Geforce GTX 280 GPU, which has 240 processor cores with 1296MHz processor clock, 1GB GPU memory with 1107 MHz memory clock, and 141.7GB memory bandwidth. Fig. 4 shows the SART reconstruction results for large real data using GPU. The object is a chest of a mouse of size 256×256×193. 100 projections are generated with the detector size 339×339. Fig. 4(a) shows the original image for slice 110 in the mouse data. Fig. 4(b)-Fig. 4(d) represent the SART reconstruction results after 5, 40, and 200 iterations respectively. The whole 200 SART iterations take 22.9 seconds using the Nvidia Geforce G280 graphics card, with 0.1 second for each iteration on the average. Fig. 5 shows the volume rendering of the corresponding reconstruction results in Fig. 4 using the same transfer function. These results show that the GPU implementation of SART may achieve accurate reconstruction in a very efficient way. Fig. 6 demonstrates the effects of TV regularization on SART results for noisy projection data. Fig. 6(a) shows the 110th slice of the original data. Multiplicative noise is added to the generated projection data. If the value of a projection is p, its value is changed to be p(1 − 0.3α), where α is a random number between 0 and 1. Fig. 6(b) shows the 1st slice of the projection data before adding noise, while Fig. 6(c) represents the same slice after noise is added. Fig. 6(d) and Fig. 6(f) show the SART reconstruction results from noisy projection data after 20 and 200 iterations with no TV regularization. Fig. 6(e) and Fig. 6(g) show the SART results from noisy projection data after 20 and 200 iterations with TV regularization. It can be seen that TV regularization helps SART achieve much better reconstruction results, which contains much less noise. The reconstruction results in Fig. 6 with TV regularization take 25.8 seconds for 200 iterations. 5. SUMMARY Iterative CT reconstruction methods, which are robust to incomplete and noisy projection data, have great potential in real applications. SART, along with TV regularization, is utilized in the paper for reconstruction. CUDA GPU is utilized to speed up the computation. This paper presents the results on 3D real images. The results show that GPU-accelerated
(a)
(b)
(c)
(d)
Fig. 4. GPU reconstruction results using SART for large mouse chest data. (Object volume: 256×256×193, Projection data: 100×339×339, no TV). (a) Original image for slice 110. (b) SART results after 5 iterations. (c) SART results after 40 iterations. (d) SART results after 200 iterations.
(a)
(b)
(c)
(d)
Fig. 5. Volume rendering of GPU SART reconstruction results for a mouse chest. No TV. (Object volume: 256×256×193, Projection data: 100×339×339). (a) Original volume. (b) SART results after 5 iterations. (c) SART results after 40 iterations. (d) SART results after 200 iterations.
SART algorithm with TV regularization may generate highquality reconstructions with high potential for clinical applications. Future work will be focused on the SART convergence with respect to noise and new regularization methods. 6. REFERENCES [1] A.C. Kak and M. Slaney, Principles of Computerized Tomographic Imaging, IEEE Press, New York, 1999.
(a)
(b)
[2] L.A. Feldkamp, L.C. Davis, and J.W. Kress, “Practical cone-beam algorithm,” J. Opt. Soc. Am. A, vol. 1, no. 6, pp. 612–619, 1984. [3] K. Mueller and R. Yagel, “Rapid 3-D cone-beam reconstruction with the Simultaneous Algebraic Reconstruction Technique (SART) using 2-D texture mapping hardware,” IEEE Trans. on Medical Imaging, vol. 19, no. 12, pp. 1227–1237, 2000.
(c)
(d)
[4] F. Xu and K. Mueller, “Real-time 3d computed tomographic reconstruction using commodity graphics hardware,” Physics in Medicine and Biology, vol. 52, pp. 3405–3419, 2007. [5] O. Bockenbach, M. Knaup, and M. Kachelrieß, “Implementation of a cone-beam backprojection algorithm on the cell broadband engine processor,” in Medical Imaging 2007: Physics of Medical Imaging, February 2007, vol. 6510 of Proceedings of SPIE, pp. 1–10.
(e)
(f)
[6] L. I. Rudin, S. Osher, and E. Fatemi, “Nonlinear total variation based noise removal algorithms,” Physica D, vol. 60, pp. 259–268, 1992. [7] R. R. Galigekere, K. Wiesent, M. Kowarschik, and J. Hornegger, “Cone-beam reprojection using projectionmatrices,” IEEE Trans. on Medical Imaging, vol. 22, no. 10, pp. 1202–1214, October 2003.
(g)
Fig. 6. 3D SART using TV regularization for mouse chest data. (Object volume: 256×256×193, Projection data: 100×339×339). (a) The 110th slice from the original volume. (b) The 1st slice from the projection data. (c) The 1st slice from the projection data with added noise. (d) SART results after 20 iterations with no TV regularization. (e) SART results after 20 iterations with TV regularization. (f) SART results after 200 iterations with no TV regularization. (g) SART results after 200 iterations with TV regularization.