The drawback of the Cello framework is that it assumes the existence of an accurate device model. This paper proposes a new scheme which combines a ...
Regulating I/O Performance of Shared Storage with a Control Theoretical Approach Han Deok Lee, Young Jin Nam, Kyong Jo Jung, Seok Gan Jung, Chanik Park Department of Computer Science and Engineering / PIRL Pohang University of Science and Technology Kyungbuk, Republic of Korea cyber93,yjnam,braiden,javamaze,cipark�@postech.ac.kr tel +82-54-279-5668 fax +82-54-279-5699
Abstract Shared storage has become commonplace with recent trends in storage technologies, such as storage consolidation and virtualization, etc. Meanwhile, storage QoS, which guarantees different storage service requirements from various applications toward shared storage, is gaining in importance. This paper proposes a new scheme which combines a feedback-controlled leaky bucket with a fair queuing algorithm in order to deliver guaranteed storage service for applications competing for shared storage. It not only assures an agreed-upon response time for each application, but also maximizes the aggregate I/O throughput by proportionating unused bandwidth to other active applications. Simulation results under various types of competing I/O workloads validate the features of the proposed scheme.
1 Introduction The explosive growth of on-line data in many applications, such as multimedia, e-business, ERP, etc., poses scalability and manageability problems with storage. The advent of storage consolidation through SAN and storage cluster has overcome the limitation of scalability in traditional directed-attached storage environments. Moreover, the introduction of a new abstraction layer between physical disks and storage management applications called storage virtualization reduces complexity in storage manageability dramatically. With these trends in storage technologies, a shared storage model is now accepted in many areas, such as storage service providers, departmental storage environments in an enterprise, etc. In a shared storage environment, it is commonplace for different users or applications to share a physical disk resource. Moreover, each application assumes that the storage is owned by itself, implying that it demands to have a guaranteed storage service called storage QoS at all times no matter how many applications share the storage. The storage QoS can be specified in many aspects which include I/O performance, reliability/availability, capacity, cost, etc. The issue of delivering guaranteed I/O performance has been given a higher priority than the others [6, 7, 12]. In addition, Shenoy and Vin in [7] described how 101
partitioning storage bandwidth can satisfy the different I/O performance requirements from mixed types of applications. Few disk scheduling algorithms exist with QoS in mind [6, 7]. YFQ [6] is an approximated version of Generalized Processor Sharing (GPS) [2] that allows each application to reserve a fixed proportion of disk bandwidth. However, when the I/O workload from an application becomes heavier, it cannot bound the maximum response time. Cello framework [7] schedules I/O requests from heterogeneous types of clients including real-time and best-effort applications. The drawback of the Cello framework is that it assumes the existence of an accurate device model. This paper proposes a new scheme which combines a feedback-controlled leaky bucket with a fair queuing algorithm in order to deliver guaranteed storage service for applications competing for shared storage. It not only assures an agreed-upon response time for each application, but also maximizes the aggregate I/O throughput by proportionating the unused bandwidth to other active applications. The feedback-controlled leaky bucket at the frontend dynamically regulates I/O rates from each application. The fair queuing algorithm at the back-end partitions a disk bandwidth among multiple I/O workloads from different applications in a proportional manner. As a result, the proposed algorithm is expected to assure a demanded response time as well as to maximize storage utilization. The remainder of this paper is organized as follows. Section 2 describes basic assumptions and definitions for the proposed scheme. Section 3 gives a detailed description on the proposed scheme. Performance evaluations via simulation are given in Section 4. Finally, this paper concludes with Section 5. 2 Preliminaries Assumptions and Definitions: We begin by providing a set of assumptions and definitions to be used throughout this paper for clear descriptions. First, we assume that the characteristics of an I/O workload featured by an average IOPS and an average request size are known. Second, I/O requests access the underlying storage randomly. We denote the underlying shared storage with . Next, it is shared by a set of I/O workloads denoted with � � � �� � ���� � �. An I/O workload �� demands I/O performance level of ����� � ��� � � �� � for the shared storage , where ��� � is an average request size, ����� is an I/O arrival rate per second (briefly IOPS), and �� is a demanded response time with ����� . Given I/O requests of size ��� � , the response time of any I/O request is required not to exceed �� , unless the current arrival I/O rate from �� is faster than ����� . Given the maximum IOPS of the storage denoted with � ��� , we assume that it can provide ����� � ��� in a sustained manner. Denote with � � the sustained maximum IOPS. Simple Admission Control: Next, we describe how to systematically map demanded I/o performance from an I/O workload1 and the underlying storage, called admission control. � � �� � ���� � � where �� requires performance of ����� � ��� � � �� �, the Given � 1
Hereafter, we interchangeably use an application and an I/O workload.
102
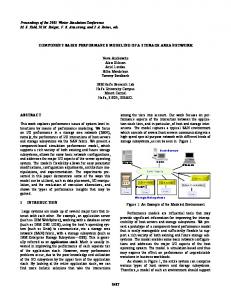
following procedure decides if or not underlying storage can guarantee the required different types of performance from � . Figure 1 depicts this procedure graphically. In Section 4, we will show how to seek those � � and �� � values for two sets of I/O workloads based on this procedure. RT
Mixed I/O workloads
W1 W2 … Wn
Shared Storage
RTT RTE
. .. . ... ..... ... . . .. . .. . ... . . +20% . . .. ..` . .. .. ... ... .. 95% . . . . .. . .. .. ... .. .. . . .. IOPS IOPST
Figure 1: Measuring deliverable target response time (�� � ) for a given target IOPS ( � � ) with a set of I/O workloads �
� generate mixed I/O requests whose size is ��� � with a probability of ����� � � � , where � � �� ����� ,
�
� find a response time �� � which is the 95th percentile of all response times whose corresponding IOPS falls into � � , � compute a target response time with a 20% margin as follows: �� � �� � , and
���� of
� if �� � �� � for all �, then it can be said that the underlying storage can guarantee the performance requirements demanded from � . 3 The Proposed Algorithm 3.1 Feedback-Controlled Leaky Bucket (FCLB) The proposed algorithm consists of a feedback-controlled leaky bucket and YFQ disk scheduling algorithm, as shown in Figure 2. The YFQ disk scheduling algorithm proportionately partitions a disk bandwidth according to the assigned weight (�) among multiple I/O workloads, and then the feedback-controlled leaky bucket dynamically regulates requests within each partition by controlling the token replenish rate �� � �. The feedbackcontrol module is composed of a monitor and controller. It controls the token replenish rate ���� parameter of the leaky bucket adaptively according to the current response time �����. The controller increases �� when ��� goes below its demanded response time � � � �. Conversely, the controller decreases �� to its demanded IOPS ������ � maximumly. In addition, when one I/O workload is inactive, the other can utilize the surplus left by the currently inactive I/O workload. Monitor: The monitor component is responsible for collecting the current response time ����� of each workload ���� at the end of each monitoring period, and feeding these results to the controller. 103
Monitor Monitor11
Controller Controller11
ρ1(k-1)
σ1
I/O workload1 {iops1, size1, rt1}
Φ1
ρ2(k-1) σ2
S
Shared Storage
Adjusting ρ2 (k-1) to ρ2 (k)
Φ2
I/O workload2 {iops2, size2, rt2}
Compute ρ2 (k) Controller Controller22 Reference rt2
Measured RT2 (k)
Monitor Monitor22
Figure 2: Architecture of the proposed algorithm Controller: The controller compares the current response time ��� �� � for the time window ��� � �� � � � with the demanded response time � � � �, and computes the replenish rate �� ��� to be used during the next monitoring period �� � �� �� �. 1. For each workload � (0�� �n) in the system, compute its error
�� ���
�� � ��� ���� � � � � �
where �� is called the reference in control theory. More negative values of represent larger response time violations.
(1)
�� ���
2. Compute the replenish rate according to the integral control function (� is a configurable parameter of the controller):
�� ���
�� �� � �� ��� ���
(2)
3. Adjust the replenish rate �� �� � �� in the previous control period to � � �� �. 3.2 Feedback control loop in FCLB Parameter � must to be tuned to prevent the replenish rate and measured response time from oscillating excessively and for fast convergence of the output to the reference. This can be done systematically with standard control theory techniques. System Modeling: In general cases, all systems are non-linear. However, there are equilibrium points where systems behave in a linear fashion. Accordingly, non-linear systems can be linearized at the points previously described in Section 2. We approximate the controlled system with the linear model, as shown in Equation 3. The controlled system includes the shared storage, leaky bucket, monitor and controller. The output is �� � �� �� 104
and the input to the controlled system is the replenish rate � � �� � in the monitoring period �� � �� �� �.
��� �� �� � ��� ���
� � ��� ��� � �� �� � ���
(3)
The process gain, �, is the derivative of the output �� � �� �� with respect to the input �� ���. � represents the sensitivity of the response time with regard to the change in the replenish rate.
� -Transform:
Next, we transform the controlled system model to the � -domain, which is amenable to control analysis. The controlled system model in Equations 2 and 3 is equivalent to Equations 4 and 5. Figure 3 describes the flow of signals in the control loop.
�� �� �
�
��� �
ρ (z)
Ei(z)
+
(4)
� �� ���
��� �� �
z ⋅rt (z+1) i
��� �� �
(5)
�
i
C(z) C(z)
Σ
H(z) H(z)
RTi(z)
-
1 G z
z K (z-1)
Figure 3: � -Transform of the control loop
Transfer Function: transfer function:
The whole feedback control system is modeled in the following
���� �
� �� �� �� � � � ���� ��� �� � � �� � ���
(6)
Given the dynamic model of the closed loop system, we tune the control parameter � analytically using linear control theory, which states that the performance of a system depends on the poles of its closed loop transfer function. The closed loop transfer function has a single pole:
�
� � ��
(7)
and the sufficient and necessary condition for system stability is:
��� � � ��
� � � � ��
105
(8)
4 Performance Evaluations This section provides the behavior and performance of the proposed algorithm which is obtained from simulations. First, we describe simulation environments, I/O characteristics of two competing I/O workloads and performance requirements each of I/O workloads requires. Second, we will measure the I/O characteristics of the shared storage used in the experiments and investigate the range where shared storage can provide service in a stable manner. Third, given a set of competing I/O workloads and their performance requirements, we will perform an admission control to decide whether or not the underlying shared storage can assure the requirement. Fourth, we will determine experimentally two parameters � and � for the feedback control in order to stabilize the system. Finally, under a variety of conditions of the two I/O workloads, we will analyze the behavior and performance of the proposed algorithm. 4.1 Simulation Environments We implemented the proposed algorithm within the DiskSim simulator[14]. Table1 shows the generic throttling parameters which are used for the experiments. In this table, � � represents a rate of replenishing tokens. It is the same as the demanded maximum IOPS for �� . �� means an amount of tokens that can be accumulated during an idle period. It corresponds to the size of a bucket in a leaky bucket model. Actually, tokens (IOPS) of are replenished every second. In our experiments, we will employ a time interval of
1 msec to replenish tokens to eventually allow I/O requests to pass through a throttling module and 1000 msec to control the replenish rate. We also set YFQ weight to � :�� =2:1. Two competing I/O workloads based on a closed model are synthetically generated, as shown in Table2. The sizes of the I/O requests are distributed normally with a mean of 8 blocks. The performance of read and write is the same in a random I/O pattern, so that we will perform experiments with only read requests. We use a single IBM DNES309170W SCSI disk which serves arriving I/O requests in a FIFO manner. Table 1: Throttling parameters for each experiment Parameter � �� �� �� �� �� ( )
Bucket Size (�� ) 8 4
4.2 I/O characteristics of the shared storage In this subsection we investigate the I/O characteristics of shared storage to decide a set of the replenish rate ��� � where shared storage can provide service stably. The stable area is spread over 75 IOPS, as shown in Figure4. The growth of response times is gradual according to the increase of IOPS in this area. We respectively assign 40 and 20 IOPS to each I/O workload.
106
Table 2: Two competing I/O workloads Parameter � �� ��� � 4KB 4KB ����� 40 20
�� 35 msec 38 msec access pattern Random Random
140 120
)c se 100 m (e 80 im T es no 60 ps eR 40 20 0
0
20
40
60 IOPS
80
100
120
Figure 4: I/O characteristics of the shared storage with Random Read 4KB 4.3 Admission Control After acquiring all the information about performance requirements from I/O workloads and underlying storage, we will try to map each I/O workload described in Table2 to the underlying storage. Recall the mapping methodology proposed in Section 2. I/O requests of 4KB are issued increasingly to the corresponding reservation queue for �� . We obtain IOPS versus RT chart as shown in Figure5. By analyzing Figure5 with ��� � � several steps given in Section 2, we can obtain the following parameter in Table3. Based on � � and �� � of each I/O workload in Table3, it can be said that the demanded level of performance by given I/O workloads in Table2 can be deliverable with the underlying storage. �� � is internally used for the feedback control as a reference value. 50 +20%
40
95th percentile
RT1E
30 S P O I
20
20 IOPS 40 IOPS
95th percentile
10 0
RT1T
+20%
RT2E
0
10
20
30
RT2T
40 50 RT(msec)
60
70
80
90
Figure 5: Measuring deliverable target response time � � � � with two I/O workloads
107
��� � � for a given target IOPS
Table 3: Given I/O workloads and deliverable response time by underlying storage Parameter � � �� � �� � � 40 29.08 msec 34 msec �� 20 31.38 msec 37 msec
IOPS
RT(msec)
Target RT
IOPS
90
90
80
80
70
70
60
60
50
50
40
40
30
30
20
20
10 0
RT(msec)
Target RT
41 Time(sec)
51
10
1
5
0
9 13 17 21 25 29 33 37 41 45 49 53 57 61 65 69 73 Time(sec)
(a) Throughput and response time for Active 40 IOPS
1
11
21
31
61
71
(b) Throughput and response time for Active 20 IOPS
Figure 6: Performance Experiment 1. - one I/O workload is inactive and the other is active 4.4 Control Parameters �� � Here, we determine the parameters � and � . First, we approximate � by running a set of shared storage profiling experiments, as shown in Section 4.2. We estimate that �=0.3 for the synthetic workload. Since the closed loop transfer function as shown in Equation 7 has a single pole � � � ��, we can set � to the desired value by� choosing the right � value of � . In our experiments, we set � �� by choosing � . In the � � �� � case of shared storage having a non-linear property whose I/O request service time is not proportional to its data size, we determine that the location of the pole is a close to � in order to stabilize the system. 4.5 Performance Results Under a variety of conditions of the two I/O workloads, we analyze the behavior of the proposed algorithm and its resulting I/O performance. Case 1 - One Inactive I/O workload : In this experiment, one I/O workload is inactive and the other is active. Figure6(a)-(b) show time-plots of response time and throughput for two I/O workloads when 20 and 40 IOPS I/O workload are inactive respectively. As the graphs show, active I/O workload fully utilizes the shared storage by 72 IOPS on average. The response time time-plot shows that active I/O workload receives its demanded response time with a 5% violation. The degree of a response time violation seen by Figure6(b) is higher than Figure6(a). This is because the reference of 20 IOPS workload which is used to compute the error is larger than 40 IOPS. 108
IOPS1
RT1(msec)
IOPS2
90
60 50 40 30 20
20
10 1
11
21
31
41 Time(sec)
51
61
0
71
(a) Throughput - 20 IOPS Step IOPS1
11
21
RT1(msec)
IOPS2
31
41 Time(sec)
51
61
71
Targe RT1
RT2(msec)
Target RT2
200
90
180
80
20
)c 160 se 140 m e( 120 im T 100 sen 80 pos 60 e R 40
10
20
70 60 50 40 30
0
1
(b) Response time - 20 IOPS Step
100
S P O I
Target RT2
120
70
0
RT2(msec)
)c es 100 m e( 80 m Ti es 60 onp se 40 R
80
S P O I
Target RT1
140
100
1
11
21
31
41 Time(sec)
51
61
0
71
(c) Throughput - 40 IOPS Step
1
11
21
31
41 Time(sec)
51
61
71
(d) Response time - 40 IOPS Step
Figure 7: Performance Experiment 2. - one I/O workload begins after 30 seconds and the other issues I/O requests continuously Case 2 - One Step I/O workload : In this experiment, one I/O workload begins after 30 seconds and the other issues I/O requests continuously. Figure7(a)-(b) shows the measured response time and throughput for 20 and 40 IOPS when 20 and 40 IOPS I/O workload begins after 30 seconds, respectively. In Figure7, we observe that two competing I/O workloads have its demanded response time in most cases except for 30 seconds where one I/O workload issues I/O requests and achieves its demanded IOPS in all cases. Before 30 seconds YFQ allocates a full disk bandwidth for continuously issuing the I/O workload. When one I/O workload comes on after 30 seconds, YFQ proportionately partitions a disk bandwidth according to the assigned weight among I/O workloads. As a result, the I/O workload allotted a full disk bandwidth has a high response time because it takes time for its reservation queue to drain sufficiently so that the corresponding response time target can be met. In this case, the response time violation is below 3 percent. Case 3 - One Pulse I/O workload : In this experiment, one I/O workload repeats on for 5 seconds and off for 5 seconds and the other issues I/O requests continuously. As the graphs show, we can observe that two competing I/O workloads have its demanded IOPS in all cases. However, there is a spike in the response time whenever a burst of requests 109
IOPS1
RT1(msec)
IOPS2
40
S P O I
30 20 10
20 1
11
21
31
41 Time(sec)
51
61
0
71
(a) Throughput - 20 IOPS Pulse IO PS1
1
11
21
31
41 Time(sec)
51
61
71
(b) Response time - 20 IOPS Pulse
IO P S2
RT1(msec)
70
Target RT1(msec)
RT2(msec)
Target RT2(msec)
250
60
200
)c se m (e 150 m iT es no 100 ps e R
50 40
O I
30 20
50
10 0
Target RT2(msec)
)c es 100 m e( 80 m Ti es 60 onp se 40 R
50
S P
RT2(msec)
120
60
0
Target RT1(msec)
140
70
1
5
9 13 17 21 25 29 33 37 41 45 49 53 57 61 65 69 73 Time(sec)
(c) Throughput - 40 IOPS Pulse
0
1
11
21
31
41 Time(sec)
51
61
71
(d) Response time - 40 IOPS Pulse
Figure 8: Performance Experiment 3. - one I/O workload repeats on for 5 seconds and off for 5 seconds and the other issues I/O requests continuously begins. The spike subsides quickly as soon as possible - within a two or three time window. This tendency is due to a feature of YFQ explained in our previous experiment. The degree of a response time violation seen by Figure8(b) is higher than Figure8(a). Also, this is due to the same reason described in our first experiment. The response time violation is 12/6%, 3/19%, as shown in Figure8(a)-(b). Case 4 - Two Active I/O workload : In Figure9, two Active I/O workloads have its demanded IOPS and response time in most cases. In this case, the response time violation is below 3% and two I/O workloads occur at approximately the same rate as YFQ weight, that is 2:1. Comparisons with Cello Framework [7]: The Cello framework heavily depends on the accuracy of the underlying storage device model, whereas the proposed scheme operates based on the measured performance of the underlying storage device. Thus, the proposed scheme can be more portable and applicable. In addition, the Cello framework proportionates unused storage performance by selecting pending I/O requests from the active applications in an ad-hoc order. However, the proposed scheme distributes the unused storage 110
IOPS1
RT1(msec)
IOPS2
60
60
50
)c es 40 m e( m iT 30 es onp 20 es R
RT2(msec)
Target RT2(msec)
50
40 S P O I
30 20 10 0
Target RT1(msec)
10
1
11
21
31
41 Time(sec)
51
61
0
71
(a) Throughput
1
11
21
31
41 Time(sec)
51
61
71
(b) Response time
Figure 9: Performance Experiment 4. - Two Active I/O workload performance by adaptively configuring the replenishing rate of tokens at the leaky bucket of each application based on the concrete theory given in Equations 1–8. 5 Conclusion and Future Work We proposed a new scheme that combines a feedback-controlled leaky bucket with a fair queuing algorithm in order to provide guaranteed storage service for different applications competing for shared storage. The proposed scheme not only assures an agreed-upon response time for each application, but also maximizes the aggregate I/O throughput by distributing the unused bandwidth to other active applications proportionally. We evaluated the performance of the proposed scheme under various types of competing I/O workloads. First, when an I/O workload becomes idle, we observed that the other workload could fully utilize the surplus bandwidth unused and only 5% of all completed I/O requests missed the agreed-upon response time. Second, when an I/O workload is backlogged again while the other I/O workload is using the entire bandwidth, we observed that competing I/O workloads had their demanded response time in most cases except for 30 seconds where an I/O workload issues I/O requests and achieved its demanded bandwidth in all cases. In this case, the response time violation is below 3 percent. Third, when an I/O workload is backlogged for a short period like a pulse while the other I/O workload is using the entire bandwidth, a spike occurs in the response time whenever a burst of requests begins. In this case, the proposed scheme revealed a lower performance than others. Finally, when both I/O workloads are active, both I/O workloads can approximately share the bandwidth at a rate of 2:1 and below 3% of all completed I/O requests missed the agreed-upon response time. In summary, the simulation results with various types of competing I/O workloads showed that the proposed algorithm provided a satisfactory level of response times; that is, 6% violation on average for the demanded response times. In future work, we plan to support workloads with multiple performance requirements that change over time.
111
6 Acknowledgement The authors would like to thank the Ministry of Education of Korea for its support toward the Electrical and Computer Engineering Division at POSTECH through its BK21 program. This research was also supported in part by grant No. R01-2003-000-10739-0 from the Basic Research Program of the Korea Science and Engineering Foundation. References [1] J.S. Turner. New directions in communications, or Which way to the information age?. IEEE Communication Magazine, 1986. [2] A. Parekh and R. Gallager. A generalized processor sharing approach to flow control in integrated services networks: The single-node case. IEEE/ACM Trans. on Networking, vol. 1, 1993. [3] Pawan Goyal and Harrick M. Vin and Haichen Cheng. Start-time Fair Queueing: A scheduling algorithms for integrated services packet switching networks. Proceedings of SIGCOMM, 1996. [4] E. Borowsky and R. Golding and A. Merchant and L. Schrier and E. Shriver and M. Spasojevic and J. Wilkes. Using attribute-managed storage to achieve QoS. Proceeding of 5th Intl. Workshop on Quality of Service, 1997. [5] E. Borowsky and R. Golding and P. Jacobson and A. Merchant and L. Schreier and M. Spasojevic and J. Wilkes. Capacity planning with phased workload. Proceeding of First Intl. Workshop on Software and Performance, 1998. [6] John L. Bruno and Jose Carlos Brustoloni and Eran Gabber and Banu Ozden and Abraham Silberschatz. Disk Scheduling with quality of service guarantees. Proceedings of the IEEE International Conference on Multimedia Computing and Systems, 1999. [7] Shenoy, P., Vin, H.: Cello: A disk scheduling framework for next-generation operating systems. In: Proceedings of ACM SIGMETRICS. (1998) [8] Guillermo A. Alvarez and Elizabeth Borowsky and Susie Go and Theodore H. Romer and Ralph Becker-Szendy and Richard Golding and Arif Merchant and Mirjana Spasojevic and Alistair Veitch and John Wilkes. Minerva: An automated resource provisioning tool for large-scale storage system. ACM Trans. on Computer Systems, 2001. [9] J. Wilkes. Traveling to Rome: QoS specifications for automated storage system management. Intl. Workshop on Quality of Service (2001) 75-91 [10] Chenyang Lu and John A. Stankovic and Gang Tao and Sang H. Son. Feedback Control Real-Time Scheduling: Framework, Modeling, and Algorithms. Journal of Real-Time Systems, 2002. 112
[11] C. Lu, G. A. Alvarez, and J. Wilkes. Aqueduct: online data migration with performance guarantees. Conference on File and Storage Technologies, 2002. [12] Christopher Lumb and Arif Merchant and Guillermo Alvarez. Facade: Virtual Storage Devices with Performance Guarantees. Conference on File and Storage Technology, 2003. [13] G.F. Franklin, J. D. Powell, and M. L. Workman. Digital Control of Dynamic Systems (3rd Ed.). Addison-Wesley, 1998. [14] Gregory R. Ganger, Bruce L. Worthington, Yale N. Patt. The DiskSim Simulation Environment Version 2.0 Reference Manual. CMU, 1999.
113