PHYSICAL REVIEW E 66, 061405 共2002兲
Relation between aggregation and phase separation: Three-dimensional Monte Carlo simulations Jean Christophe Gimel,* Taco Nicolai, and Dominique Durand Polyme`res Colloı¨des Interfaces, CNRS UMR6120, Universite´ du Maine, F-72085 Le Mans cedex 9, France 共Received 10 April 2002; revised manuscript received 26 August 2002; published 20 December 2002兲 We study phase separation of particles in solution using Monte Carlo simulations of reversible aggregation on a cubic lattice. Two stages of the phase separation can be clearly distinguished: initial random aggregation and subsequent densification. Step one leads to a distribution of fractal aggregates close to the binodal and to a temporary gel for large attractive interaction. Step two leads to isolated spherical dense domains close to the binodal and branched wormlike strands for large attractive interactions. The transition between the two types of structure is gradual and there is no clear feature that shows the existence of a spinodal. The first stage of the phase separation is metastable very close to the binodal or at very large interaction energy. In the latter case, the second step can be viewed as an aging process of the gel formed in the first step. DOI: 10.1103/PhysRevE.66.061405
PACS number共s兲: 82.70.Gg, 64.60.Ak, 64.75.⫹g
I. INTRODUCTION
It is well known that irreversible aggregation of particles in solutions leads to the formation of self-similar clusters. Many examples of such particles are spherical and aggregate randomly such as silica or gold colloidal spheres 关1兴, oil droplets 关2兴, micelles 关3兴 and globular proteins 关4兴. Theoretically, the initial stage of this process has been described in terms of kinetic reaction equations 关5兴. However, correlation between the positions of the aggregates cannot be dealt within this approach. Computer simulations have been done extensively for two cases: diffusion- 共DLCA兲 and reaction共RLCA兲 limited cluster aggregation. These simulations have shown that the radius R is related to the aggregation number m through the so-called fractal dimension d f : m⬀R d f , with d f equal to 1.8 and 2.1 for DLCA and RLCA, respectively. They also showed that the number of particles N(m) scales with the aggregation number: N(m)⬀m ⫺ with equal to 0 and 1.5, for DLCA and RLCA, respectively. The power law dependence is cut off at a characteristic m that increases with time. The results from computer simulations are compatible with observations on real systems 关5兴. It follows from the fractal structure of the aggregates that they occupy an increasing volume fraction as the association process proceeds so that at some point correlation between the positions of the aggregates becomes important. Computer simulations have shown that when the cumulated volume fraction of the aggregates approaches unity, i.e., when the aggregates begin to overlap, the association becomes similar to a percolation process 关6兴. Aggregates formed by percolation are characterized by d f ⫽2.5 and ⫽2.2 关7兴. As a consequence the aggregates have a local structure determined by the initial stage 共e.g., DLCA or RLCA兲, which we will call flocculation, and a large scale structure determined by the percolation process. The length scale at which the transition occurs can be estimated roughly as the average size of the aggregates when the cumulated volume fraction is unity. But computer simulations show that over a length scale of at least one order of magnitude the structure is intermediate 关6兴. Although clear examples of irreversible aggregation exist,
*Electronic address:
[email protected] 1063-651X/2002/66共6兲/061405共5兲/$20.00
in many if not most experimental situations the association is not permanent. Such a system can be considered from two different viewpoints. Either we continue to speak of aggregates, which form and breakup continuously, or we speak of concentration fluctuations of individual particles. Which of the two approaches appears most natural depends on the system, e.g., in the case of short range attractions one might tend to speak of reversible aggregation, while in the case of long range attractions it may appear more appropriate to speak of concentration fluctuations. Reversible association may lead to phase separation into a concentrated 共dense兲 phase and a dilute 共gas兲 phase. Usually concentration fluctuations are invoked to explain this process. Of course, the two view points are strictly equivalent and it is a matter of semantics whether we consider two neighboring particles whose movement is temporarily correlated as belonging to a single cluster or as two different particles whose position is correlated by the influence of an attractive potential. Aggregation and phase separation play a crucial role in the structuring of many complex systems. Understanding the relation between these phenomena is important not only from a fundamental point of view 关8兴 but also for the design of new materials. Our aim here is to show results from computer simulations that clarify the relation between random association into fractal clusters and densification of the clusters that leads to phase separation. II. RESULTS AND DISCUSSION
The simulation method is explained in detail elsewhere 关9兴, but it is basically a Monte Carlo simulation of DLCA on a cubic lattice. Initially, a fraction of sites is occupied and clusters are constructed by forming bonds between nearest neighbors with probability P. A cluster is chosen randomly and moved one site in a random direction with a probability inversely proportional to the radius of the cluster, which simulates Zimm dynamics. The movement is rejected if it leads to overlap with another cluster. The unit of time in the simulation is the time it takes to attempt to move N c randomly chosen clusters with N c the total number of clusters in the system at that time. This is equivalent to the time it takes a monomer to diffuse over one site. After each unit of time
66 061405-1
©2002 The American Physical Society
PHYSICAL REVIEW E 66, 061405 共2002兲
GIMEL, NICOLAI, AND DURAND
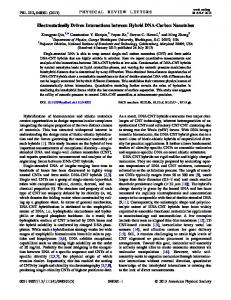
FIG. 1. Phase diagram of the model system, where u is the interaction energy per nearest neighbor and is the volume fraction. Circles indicate the binodal obtained from computer simulations while the solid line gives the theoretical prediction for a 3D lattice gas 关12兴. Squares indicate the bond percolation threshold; the dashed line is a guide to the eye. Triangles indicate the site percolation threshold; the dotted line is a guide to the eye. See the text for the meaning of the roman numerals.
all clusters are reconstructed. A cluster is thus defined as a collection of monomers that move cooperatively during one unit of time. Although, obviously, lattice simulations cannot represent the detail of real systems, we believe that the large scale features that come out of the simulations are characteristic of real systems. Presently, off-lattice simulations cannot be done over the length and time scale that is necessary to study the evolution of the phase separation 关10兴. In our model pairs of nearest neighbors can be in two states: bound and free, with an enthalpy gap of ⌬H, in units of kT. The occupancy of the two states is given by the Boltzmann statistics: P/(1⫺ P)⫽exp(⫺⌬H). The total interaction energy (u) per nearest neighbor has an entropic contribution 关11兴 caused by the distribution of bonded states over all pairs of nearest neighbors: T⌬S⫽⫺ Pln(P)⫺(1⫺P)ln(1 ⫺P). Therefore, our model is equivalent to a lattice gas model with total interaction energy u⫽ P⌬H⫺T⌬S⫽ln(1 ⫺ P) between nearest neighbors. The binodal for the threedimensional 共3D兲 lattice gas was obtained from a series expansion by Wakefield 关12兴, see Fig. 1. The binodal obtained from our computer simulations is very close to the theoretical prediction. We have shown in Ref. 关9兴 that the system develops into one of the four different states depending on 兩 u 兩 and , see Fig. 1. I: For small 兩 u 兩 or small , a stable distribution of transient clusters is formed at equilibrium. The characteristic size of the clusters increases with increasing and 兩 u 兩 . It diverges at the percolation line at the border with regime II 共dashed line兲, but not at the border with regime III 共solid line兲. II: For small 兩 u 兩 and large a stable transient gel is formed at equilibrium. III: The system phase separates with-
out percolation of bonded sites. IV: The system phase separates, but during the phase separation temporarily a transient gel formed. The lifetime of the transient gel increases with increasing and 兩 u 兩 . We define percolation here in terms of bonded sites, i.e., as soon as an uninterrupted sequence of bonded sites connects two opposing sides of the lattice we consider the system as percolated. Alternatively, one could consider percolation of sites independent of bonding, see dotted line in Fig. 1. Site percolation in this sense occurs at ⫽0.31 for u⫽0. For large 兩 u 兩 almost all nearest neighbors are bound so that bond and site percolation lines merge. Of course, only bond percolation leads to a gel in the sense of a 3-D connected structure and is relevant for mechanical properties while site percolation is relevant for conductivity. In order to study the relation between aggregation and phase separation we need to follow the evolution of the system to equilibrium. A straightforward method is to determine the average number of contacts per monomer (z) as a function of time, which is equivalent to following the enthalpy decrease of the system per monomer. Figure 2共a兲 shows the evolution of z at different values of u for ⫽0.1. For 兩 u 兩 larger than the value at the binodal ( 兩 u b 兩 ), equilibrium is not reached in direct simulations because maturation of the dense phase 共so-called Oswald ripening兲 is very slow. In our simulation the late stage evolution of the phase separation is essentially due to evaporation and condensation of monomers and small oligomers. The equilibrium value of z (z eq ) can be estimated by calculating z of the gas fraction which equilibrates more rapidly and by approximating for the dense fraction z with the mean field value: six times the density of the dense phase. The latter approximation is reasonable because the density of the dense phase is close to unity for the systems we are studying. However, it ignores the surface of the dense phase. z eq increases steeply at the binodal (u b ⫽⫺1.08) from 1.45 and becomes 6 at u→⫺⬁, see Fig. 2共c兲. The rate at which the system evolves to equilibrium can now be compared for different u by plotting z/z eq as a function of time, see Fig. 2共b兲. Clearly, equilibrium is reached more quickly when 兩 u 兩 is decreased. A closer look at the data reveals that a metastable state is reached in two cases: for u→u b and for u→⫺⬁. For u →u b the metastable state represents a distribution of fractal clusters and is close to equilibrium. Detailed analysis of the pair correlation functions and cluster size distributions will be published elsewhere. The average size of the clusters at the binodal increases with increasing volume fraction and diverges at ⬇0.3. For ⬎0.3 the metastable state close to the binodal is a gel. For u→⫺⬁ the metastable state is always a gel with a negligible sol fraction and is very far from equilibrium. In these two cases we can clearly distinguish two steps in the evolution of the system. The first step is random aggregation that leads to the formation of fractal clusters and is relatively fast at all values of u. The second step is local densification which leads to the formation of a dense phase. The rate of the second step decreases with increasing 兩 u 兩 , which explains the metastable state for u→⫺⬁.
061405-2
PHYSICAL REVIEW E 66, 061405 共2002兲
RELATION BETWEEN AGGREGATION AND PHASE . . .
FIG. 2. 共a兲 Evolution of the average number of nearest neighbors per site (z) at different interaction energies (u) indicated in the figure. All results are obtained on a cubic lattice of 2003 sites at ⫽0.1. 共b兲 Some of the results from 共a兲 normalized with the equilibrium value (z eq ). In both figures, the dashed line represents the evolution for a DLCA process. 共c兲 Evolution of z eq as a function of u for ⫽0.1; the dashed line indicates the mean field prediction of z eq .
The origin of the metastable state for u→u b is different. Here dense domains are not stable unless they are larger than a critical size that diverges at u→u b . However, once stable dense domains are formed, their size at a given time is larger for u closer to u b , which explains why true equilibrium is reached sooner. Of course, the fraction of monomers in the dense phase decreases with decreasing 兩 u 兩 and at some value close to u b there are not enough monomers in the system to create even a single stable dense domain. Figure 3 shows three dimensional images of the evolution of the system at two values of u. In Fig. 4, we show the structure at a given time for different interaction energies.
FIG. 3. Images of the system at different stages of the phase separation for u⫽⫺1.88 共left panel兲 and u⫽⫺1.14 共right panel兲. The time is indicated in the figure. The gas fraction is important for u⫽⫺1.14 (64%) and has been partly removed for clarity 关13兴. All results are obtained on a cubic lattice of 2003 sites at ⫽0.1.
The results presented here were obtained on a cubic lattice of 2003 sites. The importance of finite size effects on the structures depends on the ratio of the correlation length of the structure and the lattice size L. Even without explicit calculation of the pair correlation function the effect can be gauged directly from the images. It is clear that only for the latest stage of the phase separation the size of the dense domains becomes comparable to L. We have checked using lattices with L⫽100 and L⫽300 that there is no significant finite size influence on the evolution of z, nor on the phase diagram shown in Fig. 1. For u close to u b initially many small dense clusters are formed which are not stable. Then concomitant with the strong increase of z, see Fig. 2, larger stable spherical dense
061405-3
PHYSICAL REVIEW E 66, 061405 共2002兲
GIMEL, NICOLAI, AND DURAND
creasing 兩 u 兩 from u b is gradual and there is no sign of a particular value that could be defined as the spinodal. These observations confirm the ambiguity in defining spinodal decomposition, at least for short range interactions, as discussed at length by Binder and Stauffer 关14兴. The question remains whether these simulations describe real systems. Since we have included only nearest neighbor interactions the simulations only describe particles with short range interactions. Furthermore, as mentioned above large clusters are essentially immobile which means that the later stage of the phase separation occurs only via evaporation and condensation of monomers and small oligomers. The use of a lattice in the simulations influences the positions of the binodal and the percolation line, but it does not modify the general features of the four regions defined in Fig. 1. In fact, off-lattice simulations showed similar features although they could not be done on the length and time scales necessary to clearly reveal the two steps in the phase separation process. Of course, the local structure of the clusters is determined by the lattice and we cannot distinguish between a liquid and a crystal dense phase. However, the discrete underlying lattice structure should not matter for the features on the much longer length scales shown in Figs. 3 and 4. Finally, as mentioned above finite size effects are not important as long as the characteristic size of the dense domains is much less that L.
III. CONCLUSION 5
FIG. 4. Images of the system at t⫽2⫻10 for different interaction energies indicated in the figure. The gas fraction has been partly removed for clarity 关13兴 for u⫽⫺1.20, u⫽⫺1.14, and u⫽ ⫺1.11. All results are obtained on a cubic lattice of 2003 sites at ⫽0.1.
domains are formed that are typical for a nucleation and growth process. For these systems there is a sizable gas fraction most of which we have removed for clarity 关13兴. Images for larger 兩 u 兩 show the formation of randomly branched wormlike domains that are characteristic for spinodal decomposition. The gas fraction is small and can be clearly distinguished. The difference in the structural evolution of the dense phase is easy to understand in terms of the coarsening in step two of the underlying structure formed in step one. For u close to u b the underlying structure consists of clusters that are smaller than the stable dense domains, which are therefore spherical from the start. For larger 兩 u 兩 the underlying structure is a percolating network and the dense phase develops on this network. It is clear that the dense phase cannot itself percolate at any time if the underlying structure does not percolate. The network coarsens until the thickening strands no longer percolate. This process can be viewed as an aging of the gel. The time interval during which the dense phase percolates increases with increasing 兩 u 兩 and diverges for u→⫺⬁. The system continues to minimize the surface area of the dense domains and at the latest stages of the phase separation they are spherical for any 兩 u 兩 ⬍⬁. The difference in the structural evolution of the system when in-
Phase separation of particles with short range attraction is characterized by two steps: In the first step the particles aggregate to form fractal clusters which leads to gelation for weak reversibility or large . In the second step the dense domains develop on the structure formed in the first step, which leads eventually to phase separation. The origin of branched wormlike domains which is generally attributed to spinodal decomposition is caused by the formation of a percolating network of randomly aggregated particles in the first step. If step two is very slow compared to step one, one observes a metastable state. For a system close to the binodal the metastable state is a distribution of fractal clusters or for ⬎0.3 a percolating network. The metastable state for a system with strong attractive interaction is a percolating network at all volume fractions. Off-lattice simulations also indicated the existence of these two steps in the phase separation process 关10兴, although they could not be done on the length and time scales that are necessary to clearly reveal the two steps. The lattice simulation used in this study gives a realistic picture of the evolution of rigid spherical particles 共in a viscous medium兲 with short range interactions over the time and length scale necessary to characterize phase separation.
ACKNOWLEDGMENTS
We thank F. Parazza and Y. Usson 共UMR5525 CNRS, Grenoble, France兲 for the use of their computer program to create the 3D images.
061405-4
PHYSICAL REVIEW E 66, 061405 共2002兲
RELATION BETWEEN AGGREGATION AND PHASE . . . 关1兴 See, e.g., G. Dietler, C. Aubert, D. S. Cannell, and P. Wiltzius, Phys. Rev. Lett. 57, 3117 共1986兲; D. A. Weitz, J. S. Huang, M. Y. Lin, and J. Sung, ibid. 54, 1416 共1985兲. 关2兴 See, e.g., S. H. Chen, J. Rouch, F. Sciortino, and P. Tartaglia, J. Phys.: Condens. Matter 6, 10 855 共1994兲. 关3兴 See, e.g., L. Lobry, N. Micali, F. Mallamace, C. Liao, and S. H. Chen, Phys. Rev. E 60, 7076 共1999兲. 关4兴 See, e.g., K. G. de Kruif, M. A. M. Hoffmann, M. E. van Marle, P. J. J. M. van Mil, S. P. F. M. Roefs, M. Verheul, and N. Zoon, Faraday Discuss. 101, 185 共1995兲. 关5兴 See, e.g., P. Meakin, Phys. Scr. 46, 295 共1992兲; T. Vicsek, Fractal Growth Phenomena 共World Scientific, London, 1989兲. 关6兴 J. C. Gimel, T. Nicolai, and D. Durand, J. Sol-Gel Sci. Technol. 15, 129 共1999兲; J. C. Gimel, D. Durand, and T. Nicolai, Phys. Rev. B 51, 11 348 共1995兲. 关7兴 D. Stauffer and A. Aharony, Introduction to Percolation Theory, 2nd ed. 共Taylor & Francis, London, 1992兲. 关8兴 See, e.g., V. J. Anderson and H. N. W. Lekkerkerker, Nature 共London兲 416, 811 共2002兲, and references therein.
关9兴 J. C. Gimel, T. Nicolai, and D. Durand, Eur. Phys. J. E 5, 415 共2001兲. 关10兴 M. T. A. Bos and J. H. J. van Opheusden, Phys. Rev. E 53, 5044 共1996兲; J. F. M. Lodge and D. M. Heyes, Phys. Chem. Chem. Phys. 1, 2119 共1999兲; K. G. Soga, J. R. Melrose, and R. C. Ball, J. Chem. Phys. 110, 2280 共1999兲. 关11兴 ⌬H is the same as ⌬ ⑀ /(kT) used in Ref. 关9兴 where we ignored the contribution of the entropy. 关12兴 A. J. Wakefield, Proc. Cambridge Philos. Soc. 47, 419 共1951兲; 47, 799 共1951兲. 关13兴 Are represented only monomers with six nearest neighbors and their nearest neighbors. 关14兴 K. Binder, in Phase Transformations in Materials, edited by R. W. Cahn, P. Haasen, and E. J. Kramer, Materials Science and Technology: A Comprehensive Treatment Vol. 5 共Wiley-VCH, Weinheim, 1990兲, p. 405; K. Binder and D. Stauffer, Adv. Phys. 25, 343 共1976兲; K. Binder, C. Billotet, and P. Mirold, Z. Phys. B 30, 183 共1978兲.
061405-5