mathematical relation between damage index and the period elongation is .... is the element's stiffness matrix. Figure 4. 1. Schematic Representation of the ...
Relation between Dynamic Characteristics and Damage Index of RC-MRFs Using Non-Linear Incremental Dynamic Analyses Mehrdad Aghagholizadeh M.Sc. Student of Structural Engineering, School of Engineering, Kharazmi University (Tarbiat Moallem of Tehran),Tehran, Iran
Ali Massumi Kharazmi University (Tarbiat Moallem of Tehran), Tehran, Iran
SUMMARY: Assessment of imposed damage to a structure after earthquakes of different intensities is very important. Since a large number of buildings experience seismic loads in their lifetime, determining the usability of a building or a structure and its resistance to future earthquakes is crucial. This paper considers period elongation and calculates damage by Park-Ang damage index and studies the relation between these two parameters. In this paper, a mathematical relation between damage index and the period elongation is proposed. The advantage of this method is the consideration of period elongation for calculation of the damage. The period varies with changes in structure’s stiffness which reflects all the elements stiffness. This helps to understand the correlation between the seismic behavior of a structure with distribution and order of plastic hinges and cracks. Keywords: Damage index, Period elongation, IDARC, IDA
1. INTRODUCTION Despite significant progress in loading and design codes of seismic resistant structures and technology improvements in building structures the field of civil engineering is still facing critical challenges. An example of those challenges is the assessment of the state of damage that has been imposed to a structure after earthquakes of different intensities. In order to determine the operability of a structure and its resistance to probable future earthquakes, an assessment of the state of damage of the structure is required. Regarding to needs and necessities, in past years various methods for evaluation of structures seismic vulnerability has been made. A number of available response-based damage indices are discussed and critically evaluated for their applicability in seismic damage evaluation. By using different variety of parameters such as base shear, stiffness, drift, rotation of an element, energy, and in some cases dynamic characteristics of the structure (i.e. mode shapes and natural period of vibration) researchers quantified the state of damage by employing different mathematical functions. In general all the methods can be divided into two major types of quantitative and qualitative methods. In this paper, a quantitative method to assess state of the damage of structures is used. As mentioned before base shear, stiffness, drift, rotation of an element, absorbed energy by elements and also ParkPaulay damage indices are used for evaluating damage status of a structure. In 1985 Park-Ang index based on drift, absorbed energy and yielding force of each element has been introduced. In 1987 this method was improved by using computerized methods (Nateghi Elahi & Motamedi, 1998), (Park & Ang, 1985), (Park et al., 1987a) In 1989 a damage index based on shear-drift curve has been provided by McCabe and Hall in which ultimate and throughout earthquake drifts are used to evaluate the damage assessment of a structure (Park et al., 1987b). Later in 1995 Reinhorn and Valles introduced Damage Evaluation in Inelastic Response of Structures (McCabe & Hall, 1989) (Reinhorn & Valles, 1995). In this paper, a relation between period elongation in the first three modes and Park-Ang damage index using Non-Linear Incremental Dynamic Analysis (IDA) is shown. Lastly a mathematical relation between period elongation and damage index is introduced. Since it is hard to compute damage index compare to quantity of period after the damage, using this method is much easier and
straightforward. Furthermore, with the observation of the relation between period elongation and damage index, the softening of the structure can be made sense of. Any change in an element stiffness which could be caused by any crack or plastic hinge along the element affects the stiffness matrix of the structure. This change in stiffness matrix causes period elongation. Due to importance of dissipating energy and deformation of the elements, Park-Ang damage index suits the best. Furthermore it weighs the elements considering their importance: m u
∫d
u y
(1.1)
h
in which DI stands for Damage Index, ∫ is the hysteretic energy absorbed by the element during the response history, is the maximum of experienced deformation, is the yield strength of the element, is the ultimate deformation for an element, and is the mode constant that is suggested to be 0.1 for nominal strength deterioration (Park et al., 1987b). Considering that in IDARC program the inelastic behavior of reinforced concrete is confined to plastic zones, the above formula can be changed to the following form (Park et al., 1987b): m- r u- r
(1.2)
h
y u
in which is consumed energy in the section, is the yield moment, is the ultimate rotation capacity of the section, is the recoverable rotation through unloading, and is the maximum rotation during the loading process. Subsequently with calculation of each element’s damage index, story and overall damage indices can be obtained: tory
∑( i )component (
( i )component
overall
i )component
(1.3)
(∑ i ) i
component
∑( i )story (
i )story
(1.4)
( i )story ( i ) ∑ i
story
where is the total absorbed energy in an element or a story and is the energy weighting factor. For concrete structures Park-Ang damage index is the perfect one among the other damage indices because it considers variety of rupture states. In Table 1.1 the calibration of Park-Ang damage index is shown (Park et al., 1987b). Table 1.1. Overall Damage Index Description Descriptive Damage Damage Index Physical State State Quantity Collapse More than 1.0 Partial or total collapse of building Severe
Between 0.4 – 1.0
Moderate
Less than 0.4
Minor
-
Slight
-
Extensive crashing of concrete; disclosure of buckled reinforcement Extensive large cracks; spall of concrete in weaker elements Minor cracks; partial crushing of concrete in columns Sporadic occurrence of cracking
State of Building Operability Loss of building Not repairable Repairable -
2. VERIFICATION OF ANALYSIS It is critical to calibrate the analysis with experimental extracted data. Hence a comparison between analytical and experimental data has been done (Massumi, 2004). The experiment was on a one story and one bay reinforced concrete 2D frame. The loading was consisting of cyclic lateral and constant vertical load (Fig. 2.1.). Base shear ratio, Cb, (ratio of base shear to effective weight) versus total drift percentage of roof is shown in Fig. 2.2. Adjustable parameters of the material modeling are defined so that the best calibration with experimental data is achieved. These parameters are used in material modeling of the frames.
Figure 2. 1. Test setup and loading system
Figure 2. 2. Experimental and analytical data
3. CHOOSING EARTHQUAKE RECORDS FOR ANALYSIS
0.4
Acceleration [g]
Acceleration [g]
In this stage, seven ground motion records are elected. All these earthquakes are assumed to be in type B soil and have magnitudes between 6.00 to 7.25 in Richter magnitude scale and their fault mechanisms are strike slip. In Figs. 3.1 through 3.7 time histories of the earthquakes are presented.
0.15 0.1 0.05 0 -0.05 -0.1
0.2 0 -0.2 -0.4
-0.15 0
2
4
6
8
10
12
14
16
18
20
22
24
26
28
30
32
34
36
38
0
40
1
2
3
4
5
6
7
8
9
Figure 3.1. Chalfant Valley 1986
11
12
13
14
15
16
17
18
19
20
Figure 3.2. Erzincan-Turkey 1992
0.3
0.4
Acceleration [g]
Acceleration [g]
10
Time [sec]
Time [sec]
0.2 0.1 0 -0.1 -0.2
0.3 0.2 0.1 0 -0.1 -0.2 -0.3
0
1
2
3
4
5
6
7
8
9
10
11
12
13
14
15
16
17
Time [sec]
Figure 3.3. Imperial Valley 1972
18
19
20
21
22
0
1
2
3
4
5
6
7
8
9
10
11
12
13
14
15
16
17
18
19
20
21
Time [sec]
Figure 3.4. Managua-Nicaragua 1972
22
23
24
25
26
Acceleration [g]
Acceleration [g]
0.6 0.5 0.4 0.3 0.2 0.1 0 -0.1 -0.2 0
2
4
6
8
10
12
14
16
18
20
22
24
26
0.05 0 -0.05 -0.1
28
30
0
1
2
3
4
5
6
Figure 3. 5. Morgan Hill 1984 Acceleration [g]
7
8
9
10
11
12
13
14
15
16
17
18
19
20
21
22
23
24
25
26
Time [sec]
Time [sec]
Figure 3.6. Parkfield 1966
0.1 0.05 0 -0.05 -0.1 0
2
4
6
8
10
12
14
16
18
20
22
24
26
28
Time [sec]
Figure 3.7. Superstition Hills1987
Details of earthquake histories which are used in this paper are shown in Table 3.1. Peak Ground Acceleration (PGA), Peak Ground Velocity (PGV) and Peak Ground Displacement (PGD) are listed. Table 3.1. Characteristics of Selected Earthquakes Earthquake Year Magnitude (Richter) Parkfield 1966 6.19 Managua1972 6.24 Nicaragua ImperialValley 1979 6.53 Morgan Hill 1984 6.19 Chalfant 1986 6.19 Valley Superstition 1987 6.22 Hills Erzincan1992 6.69 Turkey
Fault Mechanism Strike – Slip Strike – Slip
PGA (g) 0.3588 0.4183
PGV (cm s) 23.5829 26.6577
PGD (cm) 4.0155 6.5459
Strike – Slip Strike – Slip Strike – Slip
0.3188 0.1608 0.2164
30.0354 8.1744 20.0414
6.6960 1.5218 6.8207
Strike – Slip
0.1255
12.2078
6.0563
Strike – Slip
0.4518
65.7330
23.0261
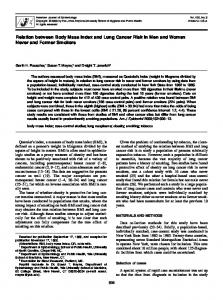
4. THEORETICAL MODELS AND ANALYSIS In this stage, four reinforced concrete moment resistant frames with 2, 4, 6 and 10 stories representing low- and mid-rise frame structures are chosen. These frames are compatible with the third edition of the Iranian Code of Practice for Seismic Resistant Design of Buildings (Building and Housing Research Centre, 2005) and Iranian National Building Codes, Part 9: Design and Construction of Reinforced Concrete Buildings (Ministry of Housing and Urban Development, 2006). Fig. 4.1 illustrates the elevation views of frames with two, four, six and ten stories, having four bays. All spans of the frames are 4m in width and 3m in height. IDARC program can identify the location of the plastic hinges considering the capacity of the elements and it implements spread plasticity. A 2D modeling of the structure is used in this paper. In general, bending, shear and axial deflections are considered in beam and column model. In IDARC Column elements were modeled considering macromodels with inelastic flexural deformations, and elastic shear and axial deformations. Beam elements are modeled using a nonlinear flexural stiffness model with linear elastic shear deformations considered. One of the significant features included in the program, to implement inelastic behavior in
the macromodels, is the distributed plasticity model implemented with the flexibility matrix approach that replaced the generally used hinge model developed for steel frames. The hinge model is not suitable for reinforced concrete elements since the inelastic deformation is distributed along the member rather than being concentrated at critical sections (Park et al., 1987b). However for sake of compatibility with other program and to model plastic characteristics, a concentrated plasticity model was also developed. In IDARC moments and rotations in two sides of an element, are calculated with Eqn. 4.1: {
} [ ]{
(4.1)
}
in which , , and are moments and rotations at the both ends of a beam or column and K is the element’s stiffness matrix.
Figure 4. 1. Schematic Representation of the Frames Selected
In analytical modeling the input hysteretic behavior of elements has an essential role in the overall seismic behavior of structures. If incorrect hysteretic is, the results of analytical modeling would not be practical. In this research, a multi-linear hysteretic model is selected for beams and columns, which is compatible with experimental extracted data in the laboratory (Table 4.1) to reflect an actual seismic behavior of structure (Massumi, 1997). Table 4.1. Hysteretic Parameters Considering Laboratory Results Stiffness Ductility-Based Hysteretic Energy-based degradation strength decay strength decay parameter parameter (α) parameter ( ) ( ) 2
0.1
0.1
lip arameter (γ)
1
Because this paper is based on IDA method, each earthquake history is implemented through 8 or more steps. In each step the amount of damage index and the first three modal periods are recorded. Afterwards Period elongation is calculated using Eqn. 4.1. (Massumi & Moshtagh, 2010): eriod longation
Tplastic - Telastic Telastic
(4.2)
in which Telastic is elastic period before damage and Tplastic is period in the latest damage state. The results of the analysis are illustrated in Figs. 4.2 to 4.5. The results show that all of the three modes are elongated in each step with the same trend.
0.00001
1'st Mode 2'nd Mode
0.8
Damage Index
Damage Index
1
0.6 0.4
First Mode Second Mode Third Mode
0.4 0.2 0 0.01 1 Period Elongation
0.0001
10
Figure 4.2. Two Story Frame
Figure 4.3. Four Story Frame
0.8 Damage Index
Damage Index
1 1'st Mode 2'nd Mode 3'rd Mode
0.6 0.4 0.2
0.01 1 Period Elongation
100
0.8 0.6 0.4 0.2
0 0.01 1 Period Elongation
0.0001
Figure 4.4. Six Story Frame
1
1'st Mode 2'nd Mode 3'rd Mode
0 0.0001
0.8
0.6
0.2 0 0.001 0.1 Period Elongation
1
Figure 4.5. Ten Story Frame
Damage Index
The mean results for average period elongation for the first three modes are shown in Figs. 4.6 to 4.8. 1
2Stories 4Stories 6Stories 10Stories mean
0.8 0.6 0.4 0.2 0
0.00001
0.0001
0.001
0.01 0.1 Period Elongation
Figure 4.6. First Mode
1
10
Damage Index
1
2Stories 4Stories 6Stories 10Stories mean
0.8 0.6 0.4
0.2 0 0.00001
0.0001
0.001 0.01 Period Elongation
0.1
1
10
Damage Index
Figure 4.7. Second Mode
1
4Stories 6Stories 10Stories mean
0.8 0.6 0.4 0.2 0
0.0001
0.001
0.01 0.1 Period Elongation
1
10
Figure 4.8. Third Mode
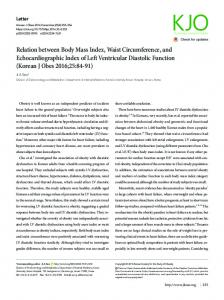
In the Figs. 4.6 to 4.8 all three modes are changing with a same trend and the period elongated two times of the elastic period around the damage index of 0.15. 5. IDENTIFICATION OF DAMAGE TREND Above figures show that till the period elongated in the first mode around 4.8 times of the elastic period, the Park-Ang damage index is less than 0.4 which can cause repairable damages like extensive large cracks, spall of concrete in weaker elements. Also in the second mode till the period elongated around 3.2 times of the elastic period, the damages are smaller than 0.4, and for the third mode this rate is around 2.3. With increase of PGA (Peak Ground Acceleration) in the analysis subsequently the amount of the damage increases and damages reach to a stage which is irreparable. 6. PROPOSED DAMAGE PATTERN In Fig. 6.1 the mean value of period elongation versus damage index of all frames are shown in the first three modes. From set of extracted data a curve can be fitted for each mode and a mathematical relation can be proposed in order to make a logical connection between period elongation and ParkAng damage index. In order to decrease the errors, the cubic polynomial is used for first and third modes and quadratic polynomial for the second mode. t should be noted that the curves’ equations are reliable when the start point of the curve be considered (0,0).
Damage Index
0.9 1'st Mode
0.8
2'nd Mode
0.7
3'rd Mode
0.6 0.5 0.4 0.3 0.2
0.1 0.001
0 0.1 1 Period Elongation
0.01
10
100
Figure 6.1. Average of all frames’ period elongation in first three modes
In the following part proposed formulas and their diagrams for the first three modes are shown. 6.1. First Mode The cubic for the first mode: .
.
.
.
(6.1.1)
1.2 Damage Index
1 0.8 0.6
0.4 0.2 0
0.1
1 Period Elongation
10
Figure 6.1.1. First Mode
6.2. Second Mode The quadratic polynomial is shown for the second mode: .
.
.
(6.2.1) 1
Damage Index
0.8 0.6 0.4 0.2 0 0.1
1 Period Elongation Figure 6.2.1. Second Mode
10
6.3. Third mode A cubic formula for the third mode is shown below: .
.
.
.
(6.3.1) 1.2
Damage Index
1 0.8 0.6 0.4 0.2 0 0.1
1 Period Elongation
10
Figure 6.3.1. Third Mode
where DI is the Damage Index and
is amount of period elongation (Eq. 4.2).
All fitted curves confirm that all three modes follow the same trend. The differences between fitted curves and analytical numbers are less than 10 percent. The error is derived from assumptions made in curve fitting process and the round-off error in analytical phase.
7. CONCLUSION Seismic behavior of a structure correlates with all of its elements and the configuration of the structure. Computation of the stiffness matrix of structures plays an important role in the definition of its damage state. Because of the hard and time consuming procedure of obtaining the stiffness matrix of a structure, the utilization of period elongation is suggested in this paper in order to overcome this problem. Considering the easy and inexpensive procedure of acquiring a structure’s period, utilization of changes in fundamental, second and third period is studied in the accurate assessment of the damage state of structures in this paper. Also dissipating energy and the deformation of an element are important factors to be considered. As a result, Park-Ang damage index has been adopted in this experiment. Moreover, for concrete structures Park-Ang damage index is the perfect one among the other damage indices in that it considers variety of rupture states. All the results unfolded that the all three first modal periods follow the same trend. In first mode when period elongation is around 4.8 Park-Ang damage index is less than 0.4 which can cause repairable damages like extensive large cracks, spall of concrete in weaker elements. Also in the second mode till the period elongated around 3.2 times of the elastic period the damages are smaller than 0.4, and for the third mode this rate is around 2.3. With an increase of PGA in the analysis subsequently the amount of damage increases and damages reach to a stage which is irreparable.
REFERENCES Building and Housing Research Center (BHRC) (2005). Iranian Code of Practice for Seismic Resistant Design of Buildings. Standard No.2800-05,3rd edition, Building and Housing Research Center, Tehran, Iran (in Persian). Massumi, A. and Moshtagh, E. (2010). A New Damage Index for RC Buildings Based on Variations of Nonlinear Fundamental Period. The Structural Design of Tall and Special Buildings, DOI: 10.1002/tal.656. Massumi, A. (2004). Estimation of response modification factors for RC-MRF structures, emphasizing on the effect of overstrength and redundancy. PhD Thesis, Tarbiat Modares University.
Massumi A. (1997). Experimental study on behavior of RC frames strengthened by steel bracings (under lateral loads). MSc Thesis, Tarbiat Modares University. McCabe, S.L. and Hall, W.J. (1989). Assessment of Seismic Structural Damage, Journal of Structural Engineering, ASCE, 115:9, 2166-2183. Ministry of Housing and Urban Development (2005). Iranian National Building Codes (Part 9: Design and Construction of Reinforced Concrete Buildings), Ministry of Housing and Urban Development, Tehran, Iran (in Persian). Nateghi Elahi, F. and Motamedi, M. (1998). Quantitative Estimation of Seismic Damage on Concrete Structures with Non-Linear Dynamic Analysis, International Institute of Earthquake Engineering and Seismology, Tehran, Iran. Park, Y.J. and Ang, A.H.-S. (1985). Mechanistic seismic damage model for reinforced concrete. Journal of Structural Division, ASCE, 111:4, 722-739. Park, Y. J., Ang A.H-S and Wen, Y.K. (1987a). Damage-Limiting Aseismic Design of Buildings. Earthquake Spectra 3:1, 1-26. Park, Y.J., Reinhorn, A.M. and Kunnath, S.K. (1987b). IDARC: Inelastic Damage Analysis of Reinforced Concrete Frame-Shear-Wall Structures, Technical Report NCEER-87-0008, State University of New York at Buffalo. Reinhorn, A.M. and Valles, R.E. (1995). Damage Evaluation in Inelastic Response of Structures: A Deterministic Approach, Report No. NCEER-95, National Center for Earthquake Engineering Research, State University of New York at Buffalo Valles, R.E. and Reinhorn, A.M. (2010). IDARC-2D Version 7.0, Inelastic Damage Analysis of Reinforced Concrete Structures. http://civil.eng.buffalo.edu/idarc2d50/