Relations between Coherence Bandwidth and Average Mode Bandwidth in Reverberation Chamber for Wireless Device measurement #
Xiaoming Chen1, and Per-Simon Kildal2
1
Department of Signals and Systems, Chalmers University of Technology Gothenburg, Sweden
[email protected] 2 Department of Signals and Systems, Chalmers University of Technology Gothenburg, Sweden
[email protected]
1. Introduction The reverberation chamber is basically a metal cavity with many excited modes which are stirred to create a statistical isotropic field environment with Rayleigh distributed magnitudes of the field [1]. The reverberation chamber used here is 1.8 m х 1.4 m х 1.2 m in size. The chamber makes use of frequency stirring, platform stirring, and polarization stirring to improve measurement accuracy [1], [2]. It has been used to measure antenna radiation efficiency and diversity gains [2]. For these measurements the intrinsic average mode bandwidth of the chamber is of interest as it determines the averaged power transmission level of the chamber [3]. It may also be sued to control the number of excited modes in the chamber, and thereby also the number of independent samples in order to generate enough independent samples to improve the measurement accuracy [4], [5]. Reverberation chamber can also be used to measure total radiated power and total isotropic sensitivity of active mobile phones [6], [7]. For such measurements the delay spread and coherence bandwidth are of relevance. Coherence bandwidth is defined as the frequency range over which the channel is correlated. When a signal at a certain frequency is transmitted through a reverberation chamber, several cavity modes will be excited. Each of these resonating modes can be characterized by its Q-factor, which is the center frequency over the mode bandwidth. When several modes are excited, averaged mode bandwidth over all the modes excited is usually used. It is evident that that if the reverberation chamber is excited at one frequency, modes at other frequencies around it (within the mode bandwidth) will also be excited. Thus, the transfer functions of the chamber will be correlated within a mode bandwidth. The paper will show that the coherence bandwidth and averaged mode bandwidth are the same when Q is high (loading is small), and that the former will tend to be smaller than the later when Q is low. Coherence bandwidth is used to characterize the channels through an environment for wireless communication. When multipath fading is presented, and the signal bandwidth is much smaller than the coherence bandwidth of the channel, the fading is referred to as being “flat”; on the other hand, if the signal bandwidth is comparable to the coherence bandwidth, or larger than it, the fading will be frequency-selective. Because RMS delay spread is inversely proportional to coherence bandwidth [8], RMS delay spread can also be used to define flat or frequency-selective fading. Many
measurements of RMS delay spreads were done for indoor and outdoor environments [8]. In the present paper, measured RSM delay spreads with different loadings of the chamber are presented as well for comparison with those measured in real environments.
2. Mode Bandwidth and Coherence Bandwidth in Reverberation Chamber The measurements are based on frequency domain channel sounding, namely, for each stirrer position a frequency sweep is performed. The transmitting and receiving antennas in the reverberation chamber is connected to port1 and port2 of a vector network analyzer respectively. Thus, the transfer function of the chamber at one stirrer position is denoted as |S21|2. represents the average of the transfer functions over all the stirrer positions. The 3-dB average mode bandwidth ∆f in the chamber at a specific frequency can be calculated from the averaged power transfer function by [3],
c03 Δf = 16π 2Vf 2
(1)
where V is the volume of the chamber; and co is the speed of light. 12
mode and coherence bandwidth [MHz]
Bc 10
Δf
loading3
8
6
loading2
4
loading1
2
empty
0 1750
1800
1850
1900
1950 2000 2050 frequency [MHz]
2100
2150
2200
2250
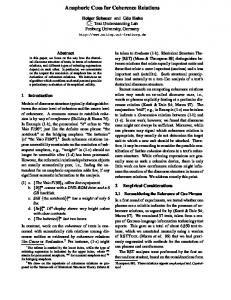
Figure 1: Photos of Reverberation Chamber; and comparison of coherence bandwidth and mode bandwidth at different loading conditions of the reverberation chamber. (Loading3 > loading2 > loading1 > empty.)
The measured S21 is the frequency response of the channels H(f ,n) inside the chamber, where f represents frequency points, and n represents stirrer position numbers. In order to fairly compare the coherence bandwidth with the 3 dB mode bandwidth of the chamber, the coherence bandwidth is calculated as the frequency range over which the auto correlation function (ACF) is above 50%. The total coherence bandwidth is the mean value of that at each stirrer position, where the mean is taken over all stirrer positions. When the reverberation chamber is excited at one frequency, modes at other frequencies around it (within mode bandwidth) will also be excited. Thus, modes within the averaged mode bandwidth are correlated as well. When the chamber is loaded with lossy objects, both coherence bandwidth and averaged mode bandwidth tend to increase. A head phantom and different number of absorbers of the type used in anechoic chamber are located inside the chamber at arbitrary positions, to create three different loading conditions, where loading1 contains less lossy objects and loading3 the most. The chamber transfer functions for different chamber loadings (different Q) were
measured. The resulting averaged mode bandwidths and coherence bandwidths are plotted in Fig.1. It can be seen that when the loading increases the coherence bandwidth and averaged mode bandwidth increase. Also, coherence bandwidth and averaged mode bandwidth are almost the same for small loadings. However, when the loading is too heavy, averaged mode bandwidth tend to be larger than coherence bandwidth. When the loading is increasing the line-of-sight components in the chamber increase relative to the scattering components, and that the chamber distribution becomes Rician rather Rayleigh [9].
3. RMS Delay Spread The RMS delay spread are given separately by [8],
∑ P(τ )τ ∑ P (τ ) k
στ =
k
k
k
k
2
∑ P (τ )τ −( ∑ P(τ ) k
k
k
)2
(2)
k
k
where the received power P(τk) at time delay τk, is defined as power delay profile (PDP). Plots of PDP, averaged over different stirrer positions at 1900 MHz with different loading conditions is shown in Fig. 2 (a), and the RMS delay spread is plotted as a function of frequency in Fig. 2 (b), which shows that RMS delay spread in the chamber decreases with increasing loadings. It is shown in [8] that the averaged RMS delay spreads is around 70-94 ns for indoor environments, 200-310 ns for suburban environments, and in the order of 1µs for dense urban environments. RMS delay spread in the chamber can vary from about 10 ns to 0.2 µs, which means that the chamber can be used to emulate indoor and outdoor environments. -40
250
-50
empty
empty 200 RMS delay spread [ns]
loading1 -60 PDP [dB]
loading2 -70 loading3 -80
150
loading1 100 loading2
-90
-100
50
0
100
200
300 time delay [ns]
400
500
600
1750
loading3
1800
1850
1900
1950 2000 2050 frequency [MHz]
2100
2150
2200
2250
(a) (b) Figure 2: (a) Power delay profile in reverberation chamber at 1900 MHz for different loadings; (b) RMS delay spread in ns inside reverberation chamber for different loadings.
4. Conclusion Averaged mode bandwidth and coherence bandwidth in reverberation chamber are presented.
A comparison between them shows that coherence bandwidth and mode bandwidth are almost the same below certain chamber loadings. However, when the loadings become large enough, averaged mode bandwidth will be larger than coherence bandwidth. By loading the chamber with different lossy objects, both the coherence bandwidth and RMS delay spread can be controlled. The coherence bandwidth increases with increasing loadings (see Fig. 1), while the RMS delay spread decreases with increasing loadings (see Fig. 2). This means that the reverberation chamber can be used to emulate static indoor and outdoor environments. In the future, fast rotating stirrers can be deployed to introduce Doppler spread to emulate both slow fading and fast fading environments.
Acknowledgement The authors thank Charlie Orlenius from Bluetest AB and Prof. Ström from Communication group, Chalmers University of Technology for helpful discussions and comments.
References [1] P.-S. Kildal and K. Rosengren, “Correlation and capacity of MIMO systems and mutual coupling, radiation efficiency and diversity gain of their antennas: Simulations and measurements in reverberation chamber”, IEEE Communications Magazine, vol. 42, no. 12, pp. 102-112, Dec. 2004. [2] K. Rosengren and P.-S. Kildal, “ Radiation efficiency, correlation, diversity gain and capacity of a six-monopole antenna array for a MIMO system: theory, simulation and measurement in reverberation chamber,” IEE Proc. Microw. Antennas Propag. Vol. 152, pp. 7-16, 2005. [3] D. A. Hill, M. T. Ma, A. R. Ondrejka, B. F. Riddle, M. L. Crawford, and R. T. Johnk, “Aperture Excitation of Electrically Large, Lossy Cavities,” IEEE trans.Electromagn. Compat.,vol.36, no. 3,pp169-178, Aug. 1994. [4] U. Carlberg, P.-S. Kildal and J. Carlsson, “Study of antennas in reverberation chamber using method of moments with cavity Green’s function calculated by Ewald summation,” IEEE Trans. Electromagn. Compat., vol. 47, no.4, pp. 805-814, Nov. 2005. [5] U. Carlberg, P.-S. Kildal and J. Carlsson, “Numerical study of position stirring and frequency stirring in loaded reverberation chamber,” submitted to IEEE Trans. EMC, Feb. 2008. [6] C. Orlenius, P.–S. Kildal and G. Poilasne, “Measurement of Total Isotropic Sensitivity and Average Fading Sensitivity of CDMA phones in Reverberation Chamber,” IEEE AP-S Internal Symp., 2005. [7] C. Orlenius, M. Franzen, P.-S. Kildal and U. Carlberg, “Investigation of heavily loaded Reverberation Chamber for testing of wideband wireless units,” IEEE AP-S Internal Symp.,2006. [8] T. S. Rappaport, Wireless Communications—Principles and Practice, 2nd edition, Prentice Hall PTR, 2002.
[9] C. L. Holloway, D. A. Hill, J. M. Ladbury, P. F. Wilson, G. Koepke and Jason Coder, “On the Use of Reverberation Chambers to Simulate a Rician Radio Environment for The Testing of Wireless Devices,” IEEE trans. on Antennas and Propagation ,vol. 54, no. 11, pp. 3167-3177, Nov. 2006.