ILASS-Europe 2002
Zaragoza 9 –11 September 2002
RELATIONS BETWEEN INTERNAL FLOW STRUCTURES AND DISINTEGRATION PROCESSES IN SPRAY FORMATION K. Triballier, Dr. J. Cousin and Dr. C. Dumouchel
[email protected] UMR 6614 – CNRS CORIA Université et INSA de Rouen 76801 St Etienne du Rouvray Cedex, France Abstract In many atomization processes, the injection pressure is too small to rely on the action of the aerodynamic forces to help in the production of small drops. In such a situation, an alternative consists in producing issuing liquid flow with complex internal structures. According to studies found in the literature, energetic internal flow structures favors the production of small drops without increasing the injection pressure. Some authors explain that this behavior is a consequence of the development of a turbulent flow whereas others evoke the presence of a non-axial flow. The present work tries to shed more light on this very point by conducting a study on a series of simplified cavity nozzles with varying dimensions. The influence of the nozzle configuration on the issuing flow velocity-field is investigated numerically. Above this, the atomization process is visualized for each situation and drop-size distribution measurements are performed to estimate the atomization-efficiency. According to the results found, it seems reasonable to think that the variation of the atomization-efficiency with the nozzle geometry is a consequence of a distortion of the issuing liquid due to the presence of a non-axial flow. Introduction Liquid atomization in a quiescent gaseous environment is a multivariable problem depending on the physical properties of both fluids, the geometrical characteristics of the nozzle and the injection pressure. The interaction between the liquid and the gas, which is somehow related to a Weber number, favors the production of small drops through the action of the aerodynamic forces. In many applications the injection pressure is not high enough to promote atomization through the action of aerodynamic forces. In such conditions, the atomization process is highly dependent on the characteristics of the liquid flow issuing from the orifice and as the pressure differential across the nozzle is decreased, the nozzle design becomes more important. A method often used to promote liquid atomization at low injection pressures consists in producing a complex issuing liquid flow with energetic structures. According to some studies found in the literature, the improvement of primary atomization is due to the production of a turbulent issuing flow. For instance the study conducted by Schley [1] on turbulent free jets reported an analogy between the length scales of the turbulence and those of the atomization process. A technique to increase the turbulent energy in the issuing liquid flow consists in imposing complex trajectory paths inside the nozzle. This concept is used to design compound nozzle gasoline injectors for instance. Many experimental studies on that type of injector showed the great influence of the nozzle geometry on the spray produced [2-5]. Based on the experimental results published by Lai et al. [2], Chen et al. [6] developed a model relating the Sauter mean diameter of the spray produced to the turbulent kinetic energy of the issuing flow. This model rests on the assumption that droplets are formed from turbulent eddies. However, the numerical investigation due to Ren and Sayar [7] concluded to a negligible influence of the turbulence on the atomization process. According to them, the influence of the internal liquid flow concentrates on the creation of jet surface energy. The purpose of the present study is to shed more light on the influence of issuing liquid flow on the atomization process. To achieve this, the behavior of a series of simplified cavity nozzles is investigated. The study consists in characterizing, first, the issuing liquid flow via CFD, and second, the atomization process through the visualization of the drop formation and the measurement of the drop-size distribution of the resulting spray. The experimental investigation The experimental part of this study investigates the behavior of a series of injectors having different nozzle dimensions. The work consisted first in visualizing the liquid flow issuing from the orifice as a function of the injection pressure and of the nozzle dimensions. Second, the drop-size distribution of the resulting spray was measured for all tested configurations.
Description of the injector nozzle: The injectors tested in this study are equipped with a simplified cavity nozzle. This nozzle is composed of a superposition of three disks as shown in Fig. 1. Each disk is perforated by a circular hole. The thickness and the hole-diameter of each disk are constant and given in Table 1. For the purpose of this study, a series of disk 3 was designed in order to modify the eccentricity of the nozzle (see Fig. 1). The values of the available eccentricity are Disk 1 Disk 2 Disk 3 given in Table 1. 177 75 76 Thickness (µm) Throughout the study, the injection 300 2,254 180 Hole diameter (µm) pressure is kept low in order to ensure a negligible action of the aerodynamic forces. 0; 90; 200; Available eccentricities (µm) The injection pressure ranged from 3 to 5-bar. 500; 700; 900 All the experiments were conducted with a Table 1. Dimensions of the nozzle disks single fluid. The physical properties of this fluid are: density 760-kg/m3, surface tension 24-mN/m, kinematic viscosity 1.312.10-3-kg/(ms). For each configuration tested in the present study, the mass flow rate was measured by weighting the amount of fluid collected during a controlled time interval. These measurements are used in the following to validate the numerical determination of the internal flow presented in the next section. Visualization of the issuing liquid flow: The visualization of the issuing film were performed with a Fuji Digital Camera (FinePix S1 Pro). This camera offers a high resolution of 3,040 x 2,016-pixel2 and a distribution of light intensity on 256 gray levels. The camera was equipped with an objective that allows covering a 15 x 10mm2 field (1-pixel = 5-µm). The shutter speed of the camera is 1/125-s. The issuing liquid flow is frozen thanks to a Nanotwin Flash System. This system can emit up to two consecutive flashes, each flash duration being of the order of 11-ns. In the present study, only single flashes were used. The light intensity was concentrated on the liquid flow just at the nozzle exit thanks to the use of a 140-mm focal length lens. Throughout the study, back light images were taken, i.e., the light source, the issuing flow and the camera were aligned on the axis that is perpendicular to the nozzle plane of symmetry (plane of Fig. 1). Drop-size distribution measurements: The drop size distribution of the spray is measured with a Spraytec equipment. Based on the light diffraction technique, this diagnostic reports a volume-based drop-size distribution integrated in space and in time. The time integration aspect was not penalizing in the present study since the injectors were used under steady state operation. The center of the laser beam was positioned at 50-mm from the injector tip. Furthermore, the injector was always orientated such that the laser beam belongs to the plane of symmetry of the nozzle (plane of Fig. 1). In this condition, the laser beam, which is 10-mm in diameter, embraces all the spray drops. Finally, the receiver of the Spraytec was equipped with a 200-mm focal length lens. Such a lens allows the measurements of drop with a diameter ranging from 1-µm to 400-µm. The numerical study This section presents basic information on the calculation of the internal flow that is performed with the numerical code Fluent 5.4. First, the methodology for the mesh creation is exposed and justified. Second, models and boundary conditions used in the calculation are specified and discussed. Third, a method to globally characterize the outflow is presented. The tested nozzles do not facilitate the numerical study because of large and penalizing scale ratios. The nozzles have one plane of symmetry requiring the simulation of the flow in a half nozzle at least. Because of the complex design of the nozzle, the time needed to build a mesh of excellent quality is prohibitive. It is the reason why a methodology was developed to perform accurate simulations in a reasonable time. To achieve this, it was decided to mesh each nozzle-disk separately. The meshing was performed with the Software Gambit and all meshes were automatically made: the core of each disk is meshed with hexahedral cells and the periphery is built with wedges allowing an accurate description of the external surface. Due to the fact that disks are independently meshed, we have to merge 3 meshed volumes together. Moreover, as the three disks are extremely different in size, the typical size of one cell differs drastically from one disk to the other. This implies that the distribution of vertices along the edges of the three disks is different. This is the reason why we decided to perform simulations with non-conform grids. The commercial code Fluent 5.4 is able to run with this type of particular mesh. However, one has to pay attention to the grid quality: if there is too much difference between the number of cells of two adjacent disks, the fluxes between these two blocks can be badly calculated. To avoid this problem we ensure that the cell-number ratio on a layer separating two disks does not exceed 2. As the flow characteristics of the issuing liquid flow are of main interest, disk 3 was meshed with a high refinement: all cells of disk 3 have a typical length equal to 5-µm. Above this, the mesh in disk 2 is refined in the vicinity of disk 3. Finally, in order to perform good comparisons, all the calculations were conducted with same models, same numerical schemes and same boundary conditions.
Numerical analysis is based on solving the continuity and Navier-Stokes equations. The closure of these equations is achieved using the RNG k-ε turbulence model. To analyze the possible interactions between liquid and the air that can enter the nozzle through the orifice, a multiphase flow model, called the Volume Of Fluid (VOF) model, is added. Pressure boundary conditions were applied at the inlet and the outlet. Pressure at the outlet is always fixed at a zero value, and different values of the total pressure at the inlet were tested (1, 2, 3, 4 and 5-bar). Symmetrical boundary condition was used at the nozzle plane of symmetry. The turbulence quantities at the inlet and outlet are uncertain. In the analysis, a tranquil upstream flow was assumed with an inlet turbulence intensity of 2%. The turbulence intensity of the possible back-flow at the outlet was assumed also to be 2%. Moreover, the turbulence length scales at the inlet (and outlet) was assumed to be 10% of the inlet (and outlet) diameter. Because of the complexity of the internal flow, a method to globally characterize the flow structures at the orifice is sought. As a first step, such a characterization would simplify the connection between the internal flow structure and the drop-size distribution of the spray produced. Flow structures are related to the presence of nonaxial component of velocity, i.e., to the presence of a secondary flow. According to Ren and Sayar [7], the kinetic energy of this secondary flow can be calculated by: Ek =
∑ vol j ρ (u 2j + v 2j )α j 2
(1)
where j accounts for all the computational cells at the orifice exit, uj and vj are the non-axial velocity components at cell j, volj is the volume of cell j, αj represents the liquid volume-fraction in cell j and ρ is the liquid density. As explained above, the cell volume at the nozzle orifice may vary from one nozzle configuration to another. Therefore, to allow relevant comparisons it was preferred to consider the following parameter: Ek vol = Ek
∑ vol j
(2)
Ekvol has the dimension of a pressure. Therefore, the division of Ekvol by the injection pressure ∆Pi defines an efficiency of non-axial kinetic-energy creation. This efficiency, called ηEk, is given by:
η Ek = Ek vol ∆Pi
(3)
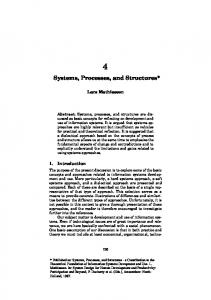
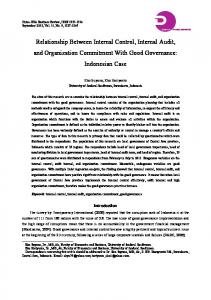
Results and comparisons As indicated in the previous section, the numerical simulation was validated on the basis of the mass flow rate. For each nozzle configuration, calculated flow rates were compared to the measurements. An example in given in Fig. 2 that shows the evolution of the mass flow rate as the eccentricity increases for an injection pressure of 3-bar. Figure 2 shows a satisfactorily agreement between the measured and the calculated flow rates. Similar agreement and behavior were obtained for the other injection pressures. It can be seen in Fig. 2 that the introduction of an eccentricity induces a reduction of the mass flow rate. The reduction of the mass flow rate is more pronounced when the eccentricity varies from 0 to 200-µm. The influence of the eccentricity illustrated in Fig. 2 is the consequence of the development of a complex internal flow. An example of the internal flow for an eccentricity of 200-µm is shown in Fig. 3a. This figure presents the streamlines of the internal flow for an injection pressure of 3-bar. Figure 3a shows that the internal flow is divided in two flows. A part of the flow goes as directly as possible from the disk 1 hole to the discharge orifice hole. The rest of the flow follows helical paths in disk 2 before reaching disk 3. The merger of these two flows in the discharge orifice leads to the development of a double-swirl flow as shown in Fig. 3b. This figure presents the non-axial velocity-component in the discharge orifice section. The presence of a complex issuing liquid flow is expected to promote the atomization. To check this, one could compare the evolution of the efficiency of non-axial kinetic-energy creation given by Eq. (3) to the one of a similar characteristic of the atomization process. An atomization-efficiency ηat could be defined as the ratio of the surface energy created per unit time to the energy brought to the liquid. The surface energy created per unit time is written as the difference between the surface energy of the spray and the surface energy of a cylindrical jet. The mechanical energy brought to the fluid is written as the product of the volume flow rate by the injection pressure. Thus, the atomization-efficiency can be written as:
η at =
8C d2 We L
3d − 1 2 D32
(4)
where Cd is the nozzle discharge coefficient, d is the discharge orifice diameter, D32 is the Sauter mean drop diameter, and WeL is the liquid Weber number calculated on the basis of the mean velocity of the issuing liquid flow and the diameter of the discharge orifice. The evolution of the atomization-efficiency as the eccentricity increases is shown in Fig. 4. The Sauter mean diameter required for the calculation of ηat was obtained from the volume-based drop-size distribution measurement performed at 50-mm. For an injection pressure of 3-bar, the poor degree of atomization observed when the eccentricity was equal to 0 or 90-µm did not allow the drop-size distribution measurement at 50-mm from the nozzle exit. For these two configurations, the atomizationefficiency can be considered very near 0. Figure 4 shows that the introduction of an eccentricity increases the atomization-efficiency, the highest efficiency being obtained for an eccentricity of 200-µm. This last result was also observed for the other injection pressures. It can be noted in Fig. 4 that the atomization-efficiency is never greater than 1%. Similar values were obtained for the other injection pressures. Such atomization-efficiencies are commonly obtained in pressure atomization processes where almost all the energy is converted into kinetic energy. Figure 4 shows also the evolution of the efficiency of non-axial kinetic-energy creation as the eccentricity increases. However, it is interesting to note that the evolution of ηEk shows the same trend as the evolution of ηat when the eccentricity increases. Therefore, in agreement with observations reported in the literature ([7] for instance) it is found here that the development of the internal flow has a dominant influence on the spray formation. However, the results presented in Fig. 4 do not give any insight into the influence of the internal flow on the drop formation. To try to answer this question, we propose to compare the velocity field in the discharge orifice section to the disintegration process that takes place on the liquid flow issuing from the nozzle. The comparison is shown in Fig. 5 for the six available eccentricities and for an injection pressure of 3-bar. It can be seen in this figure that the development of the double-swirl flow induces a flattening of the issuing liquid jet. The non-axial kinetic energy is transformed into jet surface energy, transforming the jet to a flat liquid sheet. The flat liquid sheet is orientated in the nozzle plane of symmetry and spreads mainly towards the axis of the nozzle. Indeed, the external edge of the flow (left edge in Fig. 5) is a thick rim of liquid whereas the internal part of the jet is composed of thin liquid membranes. These membranes disintegrate much faster than the liquid rim and produce very small drops. It can be seen in Fig. 5 that the flattening degree of the issuing liquid flow is directly related to the nonaxial kinetic energy of the flow in the discharge orifice section. Therefore, this result shows that the influence of the internal flow is to create jet surface. This jet surface creation induces a decrease of the liquid-system characteristic length-scales and the development of a different disintegration process, which, in the present case, is favorable to the production of small drops. Conclusion The work reported in this paper investigates the behavior of a series of simplified cavity nozzles in order to understand better the influence of the nozzle configuration on the spray production in situations where the aerodynamic forces are helpless. For different nozzle dimensions, the internal flow was numerically determined and the atomization process was characterized through a visualization of the issuing liquid flow and a measurement of the spray drop size distribution. The results provided by the numerical code were validated by the mass flow rate. Acceptable agreements between the calculated and the measured mass flow rate were obtained in each configuration. The numerical simulation reveals that the presence of a gap between the inlet and the outlet of the nozzle (the eccentricity) induces the creation of a structured non-axial mean liquid flow. The drop size distribution measurements indicate that the presence of this non-axial liquid flow increases the atomization-efficiency. Visualization of the issuing liquid flow just at the exit of the nozzle show that the influence of the nozzle eccentricity results in the distortion of the liquid flow that passes from a cylindrical jet configuration to a flat liquid sheet geometry. Furthermore, comparisons between the calculated results and the visualizations indicate that the degree of the jet distortion is directly related to the kinetic energy of the non-axial mean liquid flow in the orifice section. In agreement with Ren and Sayar’s conclusion [7], these results lead us to think that the variation of atomization-efficiency with the nozzle eccentricity is a consequence of a liquid flow distortion due to the presence of a non-axial mean flow. Thus, the influence of turbulence is likely to be neglected. References [1] Schley C.A., “Large-Eddy Simulation of Turbulence Structures in The Injector Flow and Comparison with Surface Perturbations of Turbulent Free Liquid Jets”, Sixth International Conference on Liquid Atomization and Spray Systems, paper V-6, 552-559, Rouen, France (1994) [2] Lai M.-C., Zhao F.-Q., Amer A.A., and Chue T.-H., “An Experimental and Analytical Investigation of the Spray Structure from Automotive Port Injectors”, SAE Technical Paper n°941873 (1994)
[3] Amer A.A., and Lai M.-C., “Time-Resolved Measurements in Transient Port Injector Sprays”, SAE Technical Paper n°950509 (1995) [4] Rivette S.N., and Evers L.W., “Compound Port Fuel Injector Nozzle Drop Sizes and Spray Patterns”, SAE Technical Paper n°960114 (1996) [5] Heyse J., Schatz F., Ader B., Schlerfer J., and Haubold S., “Electroformed Multilayer Orifice Plate for Improved Fuel Injection Characteristics”, SAE technical paper n°971070 (1997) [6] Chen J.L., Wells M., and Creehan J., “Primary Atomization and Spray Analysis of Compound Nozzle Gasoline Injectors”, Journal of Engineering for Gas Turbine and Power, 120, 237-243 (1998) [7] Ren W.M., and Sayar H., “Effects of the Nozzle Geometry on Spray Targeting and Atomization for Port Fuel Injector”, SAE Technical paper n°2001-01-0608 (2001) Disk 1 Disk 2 Disk 3
Eccentricity
Figure 1. Design of the simplified cavity nozzle Mass flow rate (g/s)
0.50 0.45 0.40 0.35 0.30 0.25 0.20
-a-
0.15
∆Pi = 3-bar
0.10
Measurements Calculations
0.05 0.00 0
100
200
300
400
500
600
700
800
900 1000
Nozzle eccentricity (µm)
Figure 2. Evolution of the calculated and measured mass flow rates with the nozzle eccentricity (∆Pi = 3-bar) 10
Efficiency (%)
1
ηat (Eq. (4))
0.1
ηEk (Eq. (3))
∆Pi = 3-bar 0
100
200
300
400
500
600
-b700
800
900 1000
Nozzle eccentricity (µm)
Figure 4. Evolution of the efficiencies with the nozzle eccentricity (∆Pi = 3-bar)
Figure 3. Internal flow in the nozzle (eccentricity = 200-µm, ∆Pi = 3-bar) a – Streamlines in the nozzle, b – Non-axial component of velocity in the discharge orifice section
Figure 5. Influence of the eccentricity on the issuing liquid flow and on the nonaxial mean velocity field at the discharge orifice (from top left to bottom right the eccentricity is: 0-µm, 90-µm, 200-µm, 500-µm, 700-µm, 900-µm)