Available online at www.sciencedirect.com
Procedia - Social and Behavioral Sciences 59 (2012) 254 – 263
UKM Teaching and Learning Congress 2011
Relationship between employability and program outcomes achievement Kamsuriah Ahmad , Noor Faridatul Ainun Zainal, Sufian Idris & Masura Rahmat Faculty of Information Science and Technology, Universiti Kebangsaan Malaysia
Abstract Competitive graduates in the job market often depend on strong curriculum of the programs. Structuring a comprehensive curriculum is important for the academic program. This study aims to measure the effectiveness of the program offered by the faculty in meeting to satisfy the needs of the industry and the ability of graduates in the job market. This study was conducted on graduates at the Faculty of Information Science and Technology (FTSM) for the 2010/2011 session. There are six programs offered at FTSM which are Computer Science, Science and Management Systems, Multimedia Studies, Information Science, Industrial Computing and Intelligent Systems. The effectiveness of these programs are evaluated based on students perceptions towards the learning outcomes associated with the program and their ability to get employed based on the knowledge they possessed. The data used in this study were obtained in September 2011, which means five months after the students completed their studies. The students were given the questionnaires online and manually. A total of 156 questionnaires were collected. Descriptive inference and statistical analysis technique were used to analyze the data. This analysis seeks to find a relationship between the achievement of programs’ objective and the employability of graduates. The findings are important to ensure that the programs offered at FTSM are compatible with market requirements. © 2011 Published by Elsevier Ltd. Selection and/or peer reviewed under responsibility of the UKM Teaching and Learning © 2011 Published by Elsevier Ltd. Selection and/or peer reviewed under responsibility of the UKM Teaching and Congress 2011. Learning Congress 2011 Keywords: Employability, measurement; program objective; questionnaire
1. Introduction A strong program structure is important to ensure that graduates acquire enough knowledge and also essential in supporting graduates in searching for a job after they graduated. The question is how the designed program able to develop graduates competitive enough in the job markets? Do graduates fail to get employed due to inadequate knowledge provided from the program? Each year thousands of IT graduates from various public and private universities and colleges (Hapidah & Sahandri, 2011). Graduates are competing among themselves to meet the job market in various sectors. Because of limited amount of job available, many graduates end up as unemployed. In fact, unemployment has increased from year to year due to this fact. Thus the complete structure of the program is very important in shaping the graduates to ensure they are competence in the job market (Ahmad Asrul, 2009). The
* Corresponding author. Tel.: +6-012-2338-644; fax: +6-03-8925-6732 E-mail address:
[email protected]
1877-0428 © 2011 Published by Elsevier Ltd. Selection and/or peer reviewed under responsibility of the UKM Teaching and Learning Congress 2011 doi:10.1016/j.sbspro.2012.09.273
Kamsuriah Ahmad et al. / Procedia - Social and Behavioral Sciences 59 (2012) 254 – 263
255
university should examine whether the programmes offered at the faculty are capable of providing complete knowledge to the graduates (Noraidah et al., 2009). This study aims to look at the employability of graduates and the robustness of program at FTSM in preparing graduates for job markets. This study also tries to find the relationships between the achievement of Programme Educational Objectives (PEOs) and Program Outcomes (POs) and the employability of graduates. 2. Programme Educational Objectives (PEOs) and Program Outcomes (POs) FTSM outlines long-term objectives that should be achieved by students after they graduated in the time period of three to five years (Kadderi, 2010). This study evaluated the ability of graduates to achieve PEOs after their graduation. There are five PEOs outlined by FTSM which are: PEO1: To produce graduates who are knowledgeable, skilled and innovative as IT professionals. PEO2: To produce graduates who are humanity skilled, professional and ethical in responsibility to Creator, clients and community. PEO3: To produce graduates who are able to communicate knowledge in ICT using Malay and English. PEO4: To produce graduates who can contribute to community development, responsive to environment and adaptable to the global work environment. PEO5: To produce graduates who are able to lead and conduct research in ICT field. POs are the program objectives of the program offered at FTSM. POs contain the knowledge that should be attained by all graduates who have completed their studies. There are six programs offered at FTSM, which are: Computer Science (TK), Science and Management System (TS), Industrial Computing (TR), Intelligent Systems (TC), Multimedia (TH), and Information Science (TP). Each program has its own curriculum with different objectives. The objectives for each program is designed so as to provide knowledge and skills adequate to the students. Table 1 listed all the POs of each program in FTSM. To assess the student perception towards the achievement of PEOs and POs, questionnaires are distributed. Indirectly, this study also tested the effectiveness of the programmes in producing quality graduates. Table 1. List of Programs offered at FTSM and its Objective
Program TS
TH
Program Objective (PO) PO1: 1 am able to apply problem solving principle in information systems development. PO2: I am able to model the information requirements and business processes of the organization and to develop a system that is consistent with the goals of the organization. PO3: I am able to apply information technology services industry. PO4: I am able to apply business intelligence, decision support systems, enterprise information systems and knowledge management systems for organizations. PO5: I am able to use data definition language and data manipulation language database management system. PO6: I am able to administer and manage database security. PO7: I am able to audit the use of information technology and information systems. PO8: I am able to develop further applications in various layers (n-tier) and the platform. PO1: I am able to demonstrate mastery of basic knowledge in the field of multimedia. PO2: I am able to communicate the knowledge effectively in the field of multimedia and professional issues. PO3: I am able to identify problems and devise creative solutions and innovative line of local values. PO4: I am able to work in groups and cross-disciplinary. PO5: I am able to demonstrate the understanding and mastery of entrepreneurial knowledge. PO6: I am able to identify and apply the latest technology for editing and integrating various sources of digital media. PO7: I am able to design, model, produce graphics and animation for 2D, 3D and high virtual environment usage.
256
Kamsuriah Ahmad et al. / Procedia - Social and Behavioral Sciences 59 (2012) 254 – 263
TK
TP
TR
TC
PO1: I am able to use the basic fundamental knowledge of computer science and information technology. PO2: I am able to design a computer program using at least one programming language. PO3: I am able to work in a group of software development projects. PO4: I am able to identify problems, evaluate and apply the current state-of-the-art technology in the management of computer-based systems. PO5: I am able to communicate effectively, not only in the IT community but also in other environments. PO6: I am able to understand the social responsibility, global and environmental and ethical as IT engineer. PO7: I am able to become IT entrepreneurs at the national and international levels. PO1: I am able to demonstrate basic knowledge in the field of Information Science. PO2: I am able to do requirement analysis and produce innovative information technology solutions. PO3: I am able to manage resources and information technology in the organization efficiently and effectively. PO4: I am able to design and apply the latest technology in the development of management systems and information retrieval. PO5: I am able to work in groups and cross-disciplinary. PO6: I am able to communicate knowledge effectively in dealing with professional issues. PO7: I am able to demonstrate the entrepreneurial understanding and knowledge. PO1: I am able to demonstrate creative and critical thinking and able to communicate effectively. PO2: I am able to become an entrepreneur practicing IT professional work ethic. PO3: I am able to administer and manage information technology resources in the organization efficiently and effectively. PO4: I am able to identify the real problems faced by the industry and produce innovative information technology solutions to solve the problem. PO5: I am able to develop information technology applications required for the industry either alone or in groups using a standard development methodology. PO6: I am able to do modeling, dynamic analysis (simulation and optimization) and visualization of the process or phenomenon in the industry PO7: I am able to adapt and apply the necessary information technology in the industry. PO8: I am able to contribute expertise in the design and product development. PO9: I am able to explore and develop the knowledge and skill in information technology using knowledge from various sources. PO1: I am able to design, develop and analyze Intelligent Systems software. PO2: I am able to apply the problem-solving principles in the development of Intelligent Systems. PO3: I am able to develop applications for domains such as Intelligent Systems bioinformatics, control and business. PO4: I am able to become skilled data analysts in using data mining principles to obtain useful knowledge in order to improve organizational performance by contributing in the 'business intelligence' PO5: I am able to develop a knowledge model from the data warehouse that can be used in decision making. PO6: I am able to develop an intelligent decision support systems to achieve business objectives in the various disciplines. PO7: I am able to work in multi-disciplinary teams to implement the intelligent application development projects in a team effectively. PO8: I am able to become knowledge engineers who are creative, innovative, competent and have good values.
3. Material and Method During the 39th UKM convocation on 2011, 280 FTSM students graduated in the six programmes offered at FTSM. This study only considers full time graduates at the faculty. Data collection for the study was done by using the survey. A set of questionnaires were developed such that it consists of three main parts: (i) Respondents’ profile,
257
Kamsuriah Ahmad et al. / Procedia - Social and Behavioral Sciences 59 (2012) 254 – 263
(ii) Skill possessed during the study, and (iii) Assessment of program curriculum. For the first part, the study was to review the employability of graduates by program in terms of: (i) number of graduates employed within 5 months after graduation, (ii) period taken by the graduates to get employed, (iii) distribution of wages they received, (iv) Graduates' perceptions towards PEOs, and (v) Graduates' perceptions towards POs. The duration of graduates to get employed is split into two: employed before May 2011, and employed within May to September 2011. Students employed before May 2011, show that they are employed immediately after they finished their third semester of their third year. There are cases where a number of students finished their studies in second of the third year, which are much earlier. The students fall in this category are considered as a marketable graduate. Those students who employed between May to September, means they get employed just before their Convocation Day. This quantitative survey used two approaches in distributing the questionnaire: online and manually distributed during the convocation. A total of 156 samples were collected from the graduates. The collected data and information was analyzed using descriptive statistics to achieve the objectives. This study used the Statistical Package for the Social Sciences (SPSS) software version 16 to analyze the result. The analysis of the survey results is discussed considering the assessment of graduates on their achievement of the PEOs and POs offered at the faculty. This achievement is then linked to the employability of graduate in order to see the relation between these two items. 4. Results and Discussion Analysis of the results obtained from research instruments have been analyzed based on two stages. The first stage is a descriptive analysis to look at the demographic distribution of respondents according to employment status and period of employment. The second stage is an analysis of two relationships: i) between the PEOs with employment status and period of employment, and ii) between POs with employment status and period of employment. Chi-Square test was used to examine the relationship between the PEOs and POs on the status and period of employment. 4.1 Descriptive analysis Status of employability is viewed from two aspects: on the program and the time taken by the graduates to get employed. Perception of graduates on their achievement of PEO and PO are also examined. Table 1 shows the result of the surveys. The result shows within 5 months after they graduated: the total graduates employed are 56%. Another 10% decided to further their studies at masters level and the remaining 34% are still unemployed. Details of employment status for each program are shown in Table 2 below. Table 2. Employment status for each program
Program TC Employed
N 9
Unemployed Furthur Studies Total
TH
TK
TP
TR
TS
% 69.2
N 9
% 33.3
N 26
% 53.1
N 7
% 50.0
N 18
% 75.0
N 19
% 65.5
Total 88
1
7.7
17
63.0
16
32.7
3
21.4
6
25.0
10
34.5
53
3
23.1
1
3.7
7
14.3
4
28.6
0
0.0
0
0.0
15
13
100
27
100
49
100
14
100
24
100
29
100
156
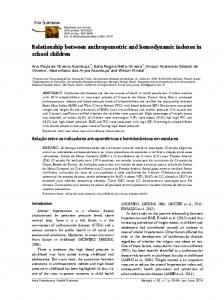
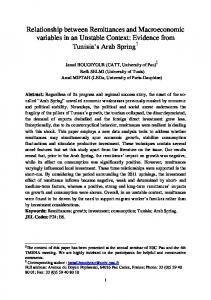
Table 1 shows that TR’s graduates are easy to get job with percentage of 75% of the total graduates from six programmes. Meanwhile only 33% of TH’s graduate are employed. Table 1 also shows that the unemployed graduates from the TC programmes is only 7.7%. Figure 1 shows TH graduates has the smallest percentage of employment and the largest number of unemployment compared to other programs . Most of the employed graduate found their job after they finished their study from May to September. For graduates who are employed, an analysis was made to look at their marketability by examining to the period in get a job. This study are divided into two;
258
Kamsuriah Ahmad et al. / Procedia - Social and Behavioral Sciences 59 (2012) 254 – 263
before May (before they finished studying) and between May and September (after they have finished studying and until their convocation). Table 3 shows the number of graduates related to the period they got employed.
Figure 1. Employment status for each program based on percentage program Table 3. Period to get job for each program
Program TC Before May 2011 May-September 2011 Total
TH
TK
TP
TR
TS
N 2
% 22.2
N 4
% 44.4
N 10
% 38.5
N 4
% 57.1
N 4
% 22.2
N 5
% 26.3
Total 29
7
77.8
5
55.6
16
61.5
3
42.9
14
77.8
14
73.7
59
9
100
9
100
26
100
7
100
18
100
19
100
88
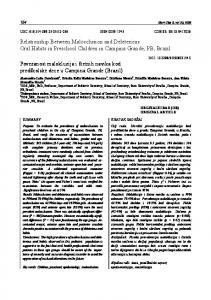
Table 3 shows that 29 graduates found a job before May 2011 compared to 59 graduates employed between May to September and shows TK’s graduates are more easier to get job before May compared to others.
Figure 2. Number of students for each program to get job within the period
4.2 Relationship PEOs With Employment Status and Period Of Employment Table 4 shows the Chi-Square value of the PEOs with status and period of employment. Results of the analysis found no significant relationship between the PEOs with status and period of employment. Table 4. Chi Square value for PEOs with Status dan Period of employment
Chi-Square Asymp. Sig. PEO
Status
Period
PEO1
0.397
0.580
259
Kamsuriah Ahmad et al. / Procedia - Social and Behavioral Sciences 59 (2012) 254 – 263
PEO2
0.375
0.778
PEO3
0.117
0.092
PEO4
0.916
0.451
PEO5
0.298
0.237
Table 5 shows the number of frequencies for PEOs to employment status based on the 5 scale namely ( “Strong Disagree” = 1, “Disagree” = 2, “Not Sure” = 3, “Agree” = 4 and “Strong Agree” = 5). Meanwhile Table 6 shows the frequency for PEOs to period of employment for those who have been working. Table 5. Frequency of employment status on PEOs based on scale
Status Employed PEO1
Strong Disagree Disagree Not Sure Agree Strong Agree
PEO2
Strong Disagree Disagree Not Sure Agree Strong Agree
PEO3
Strong Disagree Disagree Not Sure Agree Strong Agree
PEO4
Strong Disagree Disagree Not Sure Agree Strong Agree
PEO5
Strong Disagree Disagree Not Sure Agree Strong Agree
Unemployed
f 1
% 1
f 0
% 0
Total f 1
7
4
3
2
10
20
13
14
9
34
55
35
50
32
105
5
3
1
1
6
1
1
0
0
1
6
4
3
2
9
14
9
7
4
21
65
42
58
37
123
2
1
0
0
2
1
1
0
0
1
1
1
0
0
1
18
12
15
10
33
61
39
53
34
114
7
4
0
0
7
2
1
2
1
4
17
11
12
8
29
65
42
52
33
117
3
2
2
1
5
1
1
0
0
1
1
1
0
0
1
3
2
1
1
4
15
10
12
8
27
62
40
54
35
116
7
4
1
1
8
260
Kamsuriah Ahmad et al. / Procedia - Social and Behavioral Sciences 59 (2012) 254 – 263
Table 6. Frequency of period of employment on PEOs based on scale
Period Before May PEO1
PEO2
PEO3
Strong Disagree
% 0
f 1
% 1
Disagree
0
0
3
3
3
Not Sure Agree
7
8
8
9
15
18
20
44
50
62
Strong Agree
4
5
3
3
7
Strong Disagree
0
0
1
1
1
Disagree
2
2
4
5
6
Not Sure Agree
4
5
10
11
14
23
26
42
48
65
Strong Agree
0
0
2
2
2
0
0
1
1
1
0
0
1
1
1
Not Sure Agree
8
9
10
11
18
16
18
45
51
61
Strong Agree
5
6
2
2
7
Strong Disagree
0
0
2
2
2
Disagree
7
8
10
11
17
20
23
45
51
65
2
2
1
1
3
Strong Agree
0
0
1
1
1
Strong Disagree
0
0
1
1
1
Disagree
0
0
3
3
3
Not Sure Agree
7
8
8
9
15
18
20
44
50
62
Strong Agree
4
5
3
3
7
Strong Disagree
Not Sure Agree PEO5
Total f 1
f 0
Disagree
PEO4
May-September
4.3 Relationship POs With Employment Status And Period Of Employment 4.3.1 TC Program Based on the analysis POs in TC programmes indicates the existence of relationships between status and period of employment. Table 7 shows the value of Chi Square (p> 0.05) for each PO with status and period of employment. Table 7. Chi Square value for the TC program POs to the status and period of employment
PO1 PO2 PO3 PO4
Chi-Square Asymp. Sig. Status Period 0.109 0.858 0.569 0.257 0.786 0.852 0.188 0.571
Kamsuriah Ahmad et al. / Procedia - Social and Behavioral Sciences 59 (2012) 254 – 263
PO5 PO6 PO7 PO8
0.109 0.532 0.277 0.463
261
0.858 0.526 0.693 0.561
4.3.2 TH Program The result in Table 8 shows that only one PO of TH programmes has the most significant relationship (p < 0.05) with the employment status. Mean while results shows none of the significant relationship between POs of TH program with the period of employment. It means that a relationship between employability of TH graduates with the PO4 i.e. the ability to work in groups and cross-disciplinary. Table 8. Chi Square value for the POs of TH program to the status and period of employment
PO1 PO2 PO3 PO4 PO5 PO6 PO7
Chi-Square Asymp. Sig. Status Period 0.318 0.236 0.740 0.200 0.509 0.635 0.025* 0.343 0.099 0.233 0.257 0.124 0.547 0.124
4.3.3 TK Program The result shows there are many POs in the TK programmes which have relationships with status and period of employment. Table 9 shows the value of Chi Square (p> 0.05) for each PO with status and period of employment. Table 9. Chi Square value for the POs of TK program to the status and period of employment
PO1 PO2 PO3 PO4 PO5 PO6 PO7
Chi-Square Asymp. Sig. Status Period 0.741 0.177 0.371 0.508 0.656 0.508 0.779 0.314 0.081 0.270 0.278 0.177 0.600 0.177
4.3.4 TP Program The result shows many POs in the TK program have relationship with status and period of employment. Table 10 below shows the value of Chi Square (p> 0.05) for each PO with status and period of employment. Table 10. Chi Square value for the POs of TP program to the status and period of employment
PO1 PO2 PO3 PO4
Chi-Square Asymp. Sig. Status Period 0.299 0.350 0.580 0.350 0.299 0.350 0.513 0.809
262
Kamsuriah Ahmad et al. / Procedia - Social and Behavioral Sciences 59 (2012) 254 – 263
PO5 PO6 PO7
0.148 0.375 0.378
0.646 0.233 0.350
4.3.5 TR Program Result shows all POs in the TK program have relationship with status and period of employment. Table 11 shows the value of Chi Square (p> 0.05) for each PO with status and period of employment. Table 11. Chi Square value for the POs of TR program to the status and period of employment
Chi-Square Asymp. Sig. Status
Period
PO1
0.767
0.249
PO2
0.639
0.748
PO3
0.261
0.398
PO4
0.389
0.348
PO5
0.261
0.119
PO6
0.604
0.121
PO7
0.349
0.114
PO8
0.264
0.570
PO9
0.446
0.141
4.3.6 TS Program The result in Table 12 shows most POs in the TK program have relationship with employment status. Three POs have the most significant relationship (p < 0.05) with the employment period. It means that there is a relationship between employability of TH graduates with PO2, PO5and PO7. Table 12. Chi Square value for the POs of TS program to the status and period of employment
PO1 PO2 PO3 PO4 PO5 PO6 PO7 PO8
Chi-Square Asymp. Sig. Status Period 0.754 0.082 0.830 0.036* 0.572 0.096 0.750 0.087 0.455 0.038* 0.764 0.081 0.892 0.013* 0.687 0.138
5. Summary Based on the results obtained 56.4% of graduates have obtained employment within 5 months after graduation. While 10% continue their studies at the masters level. The results in Table 5 – 12 show the perception of graduates in their achievement towards PEOs and POs. This achievement is then mapped with the graduates employability status to find the existence of relationship between these items. Relationship between the graduates, there exist a achievement in PEOs and POs, and employability status. The graduates agreed that the programmes they took at the faculty had given them sufficient knowledge and also helps them in finding a job. By looking at the percentage of employed graduates (56.4%) within five months after graduation, we conclude that graduates are competitive in the
Kamsuriah Ahmad et al. / Procedia - Social and Behavioral Sciences 59 (2012) 254 – 263
263
job market by leveraging the knowledge they acquired while studying at the faculty. This also proves that the programmes offered at the faculty is in line with industry requirements. Acknowledgement We would like to thank Universiti Kebangsaan Malaysia for providing the research grant (UKM-PTS-2011). Reference Ahmad Asrul Ibrahim. (2009). Status Kebolehpasaran Graduan Kejuruteraan Elektrik, Elektronik dan Sistem, UKM. Kongres Pengajaran dan Pembelajaran UKM. Hapidah Mohamad & Mohd Sahandri Gani Hamzah. (2011). Employability Profiles of Graduates: The Malaysia Scenario from an Employer Perspective. The 5th QS-Apple Conference. Kadderi Mat Desa. (2010). Perkembangan Pelajar dan Kompetensi Generik. Pengalaman Pembelajaran Di UKM. Penerbit UKM. 99-109. Noraidah Sahari@Ashari, Tengku Siti Meriam Tengku Wook, Haslina Arshad, Nazlia Omar, Zaihosnita Hood & Hairuliza Mohamad Judi. (2009). Penerapan kemahiran kebolehpasaran melalui latihan industri. Kongres Pengajaran dan Pembelajaran UKM.