WATER RESOURCES RESEARCH, VOL. 35, NO. 4, PAGES 983–999, APRIL 1999
Relationship between geomorphic settings and unsaturated flow in an arid setting Bridget R. Scanlon Bureau of Economic Geology, University of Texas at Austin
Richard P. Langford Department of Geology, University of Texas at El Paso
Richard S. Goldsmith Bureau of Economic Geology, University of Texas at Austin
Abstract. Because geomorphology can readily be mapped, our ability to characterize unsaturated flow over large areas would be greatly enhanced if relationships between geomorphic settings and unsaturated flow could be identified. The purpose of this study was to evaluate relationships between geomorphic settings and spatial and temporal variability in unsaturated flow at a field site in the Chihuahuan Desert of Texas. This study differs from most previous studies in the variety of geomorphic settings studied, including drainage areas (Blanca Draw and Grayton Lake playa) and interdrainage areas (basin-fill deposits, eolian sheets, alluvial fans, and a fissure), density of data (;50 sampled boreholes 3–31 m deep), and variety of techniques (physical, chemical, and electromagnetic) used to quantify unsaturated flow. Spatial variability in unsaturated flow parameters is related to geomorphic settings. The various geomorphic settings form distinct groups on a plot of chloride versus water potential. Interdrainage areas have low water potentials and high chloride concentrations, indicating low water fluxes. Mean water fluxes estimated from chloride data ranged from 0.02 to 0.05 mm yr21. In contrast, localized topographic depressions (fissure, gully, and borrow pit) have high water potentials and low chloride concentrations which indicate high mean water flux (;100 mm yr21). These topographic depressions occupy ,1% of the basin area. Drainage areas have low water potentials, which indicate low water fluxes and low to moderate chloride concentrations, which indicate higher water fluxes in the past (#40 mm yr21). Short-term variability in response to precipitation events was only monitored in topographic depressions. The age of the pore water in the interdrainage areas spanned paleoclimatic variations (#136,000 years at 25 m depth); however, most interdrainage profiles show negligible response to past climate fluctuations. Some profiles in eolian sheets showed increased water flux in response to Pleistocene climate change. The findings from this study indicate that geomorphology can provide valuable information on unsaturated flow and underscore the importance of localized topographic depressions for focusing unsaturated flow.
1.
Introduction
Variations in geomorphology may include differences in topography, soil texture, and vegetation. Previous studies have shown that surface water collects in topographic depressions and results in focused flow through the unsaturated zone. Water fluxes are much higher beneath sinkholes ($60 mm yr21) than in surrounding vegetated topographic settings (0.06 –1.7 mm yr21) in South Australia [Allison et al., 1985]. Ephemeral lakes or playas in the Southern High Plains of Texas and New Mexico also focus recharge [Stone, 1990; Wood and Sanford, 1995; Scanlon and Goldsmith, 1997]. Fissured sediments in the Chihuahuan Desert of Texas concentrate surface runoff, and water fluxes beneath these fissures are up to 3 orders of magnitude higher than in surrounding areas [Scanlon, 1992; ScanCopyright 1999 by the American Geophysical Union. Paper number 98WR02769. 0043-1397/99/98WR-02769$09.00
lon et al., 1997b]. Texture of surficial sediments also plays an important role in controlling unsaturated flow. Fine-grained surficial sediments provide a storage capacity large enough to retain infiltrated water near the surface, where it is available for evapotranspiration. Cook et al. [1992] noted an apparent negative correlation between clay content in the upper 2 m and the recharge rate. High water fluxes (23 mm yr21) have been inferred on the basis of tritium data in coarse sand dune sediments in Saudi Arabia [Dincer et al., 1974]. Vegetation also affects unsaturated flow in desert systems. Lysimeter studies in Hanford, Washington, and Las Cruces, New Mexico, show deep drainage ranging from 10% to .50% of the annual precipitation in bare, sandy soils [Gee et al., 1994]. The presence of plants in other areas of the Hanford site reduced deep drainage by up to 2 orders of magnitude [Prych, 1995; Murphy et al., 1996]. Studies in Cyprus show that recharge rates were highest in areas of sparse vegetation and were lowest in areas of bush vegetation [Edmunds et al., 1988].
983
984
SCANLON ET AL.: ARID GEOMORPHIC SETTINGS AND UNSATURATED FLOW
The aforementioned studies indicate that basic variables among geomorphic settings, such as topography, sediment texture, and vegetation, greatly affect unsaturated flow. Identifying relationships between geomorphic settings and unsaturated flow would increase our ability to characterize unsaturated flow over large areas because geomorphology can be readily mapped. Allison et al. [1994] found that recharge in some areas was quite variable locally on a 100 m scale and noted that use of geomorphic techniques for estimating recharge over large areas is still a “seminal problem” in recharge evaluation. What techniques can be used to evaluate unsaturated flow within and among various geomorphic settings? There has been much debate about the reliability of various techniques as indicators of unsaturated flow. Traditional techniques can generally be subdivided into direct physical methods such as lysimeters, indirect physical methods such as water balance and Darcy’s law approaches, and environmental tracers such as chloride and tritium. Although reviews of techniques in unsaturated zone hydrology suggest that physical methods are less accurate than environmental tracers in estimating water flux [Gee et al., 1994], the two approaches, physical methods and environmental tracers, provide information on unsaturated flow over different timescales. Physical measurements allow evaluation of dynamic processes under current climatic conditions, whereas environmental tracers generally provide information on net water fluxes over longer time periods (up to thousands of years for chloride). A comprehensive understanding of unsaturated flow requires both physical and environmental tracer data. Noninvasive techniques, such as electromagnetic (EM) induction and ground-penetrating radar, are becoming increasingly popular for evaluating unsaturated flow because they can be used to evaluate unsaturated flow rapidly over large areas and because they provide an evaluation of conditions between point measurements from boreholes. In an Australian study the correlation coefficient r between apparent electrical conductivity and recharge estimated according to unsaturated zone chloride data was 0.7 [Cook et al., 1992]. These data suggest that although EM induction cannot estimate recharge directly, it may be useful in reconnaissance and interpolation between borehole measurements. The objectives of this study were to evaluate relationships between geomorphic settings and the spatial and temporal variability in unsaturated flow at a field site in an arid region and to determine fundamental controls on unsaturated flow. This work differs from previous field studies in arid settings in the variety of geomorphic settings evaluated, size of the study area examined (60 km2), the density of data (;50 boreholes 3–31 m deep in different geomorphic settings), and the variety of techniques (physical, chemical, and isotopic).
2.
Site Description
The study area (;60 km2; 3187'N, 105816'W), ;120 km southeast of El Paso, lies in northwest Eagle Flat basin, in the Chihuahuan Desert of Texas (Figure 1). Northwest Eagle Flat basin, a closed topographic depression ;500 km2 in area, is a sediment-filled basin within the Basin and Range physiographic province [Gile et al., 1981]. The unsaturated zone is extremely thick, as indicated by the depth of the regional potentiometric surface (198 –230 m). The regional climate is subtropical arid [Larkin and Bomar, 1983]. Long-term meteorological data were obtained at Sierra
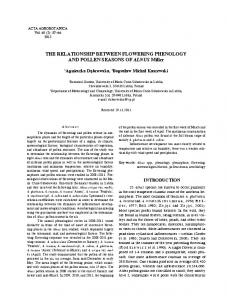
Blanca, on the west edge of the study area. Mean annual precipitation is 320 mm for a 25 year record. Precipitation during sample collection and monitoring in this study ranged from 179 mm in 1994 to 353 mm in 1993 (Figure 2). Most precipitation falls in local, intense, short-duration convective storms during the summer, when temperature and potential evaporation are highest. Minor winter frontal storms are of longer duration. The geomorphic evolution of the landscape was described by Scanlon et al. [1999]. The study area has been subdivided into interdrainage and drainage areas. The interdrainage area consists of fine-grained basin-fill deposits and eolian sheets surrounded by a narrow rim of alluvial fans at the margin of the basin. An earth fissure is also found in the interdrainage area. The drainage area includes Blanca Draw and Grayton Lake. The floor of Eagle Flat basin consists mostly of muds overlain by the Arispe Surface, which has well-developed soils. The basin-fill deposits are overbank deposits from the braided streams and from the toes of the alluvial fans. These deposits are stable, vegetated landforms that do not exhibit channels or erosional or depositional features resulting from fluvial or alluvial activity. Three calcic soil horizons are found at depths of 0 to 1, 3, and 6 m, which suggest extremely stable conditions [Jackson et al., 1993]. The vegetation consists of scattered short bunch grasses and small Tobosa (Hilaria mutica) grass flats. Shrubs are much rarer, and the overall vegetation is less dense than that of the adjacent eolian sheets. The eolian sheets are characterized by irregular microtopography consisting of 0.1– 0.2 m hummocks and swales superimposed onto larger-scale eolian bedforms. Black gramma (Bouteloua eriopoda) and other grasses are dense and common, along with soaptree yucca (Yucca elata) and mesquite (Prosopis glandulosa). An earth fissure that was found ;0.3 km west of Blanca Draw in an interdrainage setting was described by Jackson et al. [1993]. The surface expression of the fissure is ;640 m long. On aerial photographs as far back as 1957 it can be distinguished by a linear vegetation feature (mesquite bushes). The fissure consists of an alignment of horizontal pipes or collapse pits up to ;1 m in diameter underlain by a tension fracture that is filled with sediment. The width of the fracture is ;0.2 m at 2– 6 m depth. The maximum vertical extent of the fracture is unknown because we did not dig trenches deep enough to see the base of the fracture. In addition to natural geomorphic settings, some areas have been subjected to anthropogenic influence. Borrow pits next to the highway were excavated in the 1960s for road construction (Figure 1). Blanca Draw is the axial drainage system for Eagle Flat basin and is flanked by moderate slopes formed when the drainage incised into the surrounding basin-fill deposits (Figure 1). The slopes, ;250 m in width, have an average gradient of 0.013. Locally, the slopes are dynamically eroding. The floor of Blanca Draw is fairly stable and has no active channel with mobile sediment. A discontinuous gully lies in one section of Blanca Draw. Although Blanca Draw is generally dry, water may pond for long periods in the gully after heavy rains. The dominant vegetation in the area of Blanca Draw that was studied is scattered dense mesquite trees (1–2 m22) interspersed with grasses and other shrubs (Figure 3). Thickly vegetated grass flats containing dense patches of Tobosa grass form isolated patches both in the slope area next to Blanca Draw and near Grayton Lake, where the wash floor is wide and the gradient low.
SCANLON ET AL.: ARID GEOMORPHIC SETTINGS AND UNSATURATED FLOW
985
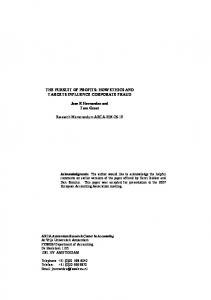
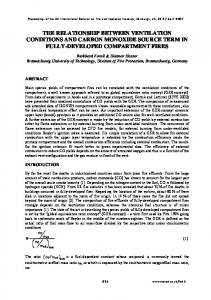
Figure 1. Location of sampled boreholes, unsaturated zone monitoring equipment, and electromagnetic transects relative to geomorphic settings.
Blanca Draw drains into Grayton Lake (20 km2), an ephemeral playa that was flooded between May 1992 and October 1993 (Figure 1). When not flooded, it is sparsely vegetated with herbs. The floor of the playa consists of clay containing mud cracks resulting from shrinking and swelling of the sediment.
3. 3.1.
Methods Theory
Three basic approaches were used to evaluate unsaturated flow in the study area: electromagnetic induction, physical measurements, and chemical measurements. Electromagnetic induction was used to obtain information on large-scale spatial variability in unsaturated zone characteristics and to interpo-
late and extrapolate data from point estimates provided by boreholes. Physical data provided information on current flow processes, whereas chemical tracers provided information on net water fluxes on timescales from years to thousands of years. Because borehole data provide only point estimates of hydraulic and hydrochemical parameters, it is important to evaluate variability between boreholes and between geomorphic settings using noninvasive techniques such as EM induction. The apparent electrical conductivity (ECa) of the subsurface is directly proportional to the conductivity of the pore water, to the water content, and to the solid phase conductance [Rhoades et al., 1976, 1989]. The solid-phase conductance is determined primarily by the clay content and the cation exchange capacity of these clays. To evaluate factors affecting
986
SCANLON ET AL.: ARID GEOMORPHIC SETTINGS AND UNSATURATED FLOW
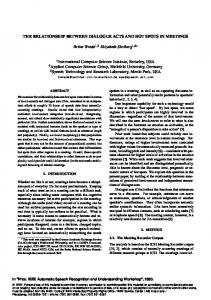
Figure 2. Daily precipitation recorded at Sierra Blanca during sample collection and monitoring.
ECa measured on the land surface with the EM31 meter, average values of water, chloride, and clay content (Table 1) were calculated by weighting the depth distribution of these parameters (represented by x in (1)) according to the sensitivity of the EM31 meter in the vertical dipole mode (subscript v, restricted to 6 m depth) [McNeill, 1980]: 4z x v~ z! 5 ~4z 2 1 1! 3/ 2
(1)
Although the physical approach may not provide accurate estimates of water flux, it provides invaluable information on current unsaturated flow processes. Variations in water content cannot be used to assess the direction of water movement because water content is discontinuous across sediment types. Monitoring water content is generally useful in evaluating movement of water pulses in areas of moderate to high water flux. In contrast to water content, energy potential is continuous across the interfaces between different sediment types under steady flow conditions and is typically used to infer flow direction. Evaluation of the flow direction requires information on the head gradient. Thermocouple psychrometers are required to measure the low water potentials (sum of matric
and osmotic potentials), generally ,21 MPa, characteristic of arid settings. In addition to using the gradient, we can also use the position of the measured matric potential relative to a static equilibrium matric potential to assess the flow direction under steady state conditions [Bear, 1972, Figure 9.4.16, p. 506]. Chloride concentrations in pore water have been used to evaluate water fluxes in semiarid systems over timescales up to thousands of years [Allison et al., 1985]. Chloride from rain and dry fallout concentrates in the root zone as a result of evapotranspiration because the volatility of chloride is negligible and chloride uptake by plants is minimal [Gardner, 1967]. Volumetric water flux below the root zone (q w , L T21) can be estimated on the basis of the degree of enrichment of chloride in pore water relative to its concentration in precipitation according to the chloride mass balance equation q w 5 J Cl/c Cl uz 5 Pc Cl P/c Cl uz
(2)
where J Cl is the chloride mass flux or chloride deposition flux at the surface (M L22 T21), c Cl uz is the pore water chloride concentration (M L23), P is precipitation (assumed to include dry fallout, L T21), and c Cl P is the chloride concentration in precipitation and dry fallout (M L23). This equation ignores hydrodynamic dispersion and assumes that chloride moves by piston flow. The age or residence time t represented by chloride at depth z can be evaluated by dividing the cumulative total mass of chloride from the surface to that depth by the annual chloride deposition flux: t5
E
0
z
u c Cl uz dz/J Cl 5
E
z
r bM Cl uz dz/J Cl
(3)
0
where u is the volumetric water content (L3 L23), r b is the dry bulk density (M L23), and M is the chloride concentration
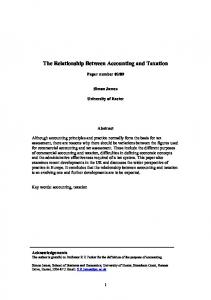
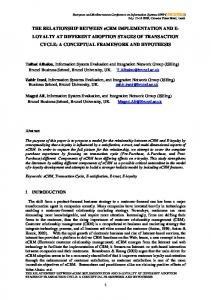
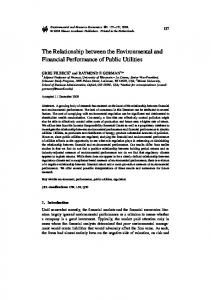
Figure 3. Aerial photograph of Blanca Draw and surrounding interdrainage area. Plots labeled 1 and 2 represent 15 m2 areas where the number of mesquite trees was counted and ranged from 26 trees in 1 to 19 trees in 2. An electromagnetic (EM) transects is located from EF 94 in Blanca Draw gully to EF 28 and EF 111 in the interdrainage basin-fill deposits.
SCANLON ET AL.: ARID GEOMORPHIC SETTINGS AND UNSATURATED FLOW
(M Cl M21 soil). The main assumptions of the chloride mass balance method are (1) one-dimensional, vertically downward piston flow and (2) constant chloride deposition flux for the period being considered. If other sources, such as leaching from the mineral phase or runon, contribute chloride to the system, such sources should be included. Runon represents surface water input from an area. The simple chloride mass balance equation was modified by Wood and Sanford [1995] to include the effects of runon into playas: qw 5
S
A bc Cl R0 Pc Cl P 1 R0 c Cl uz A f c Cl uz
D
(4)
where c Cl R 0 (M L23) is the chloride concentration in runon, R 0 is runon (L), A b (L2) is the area of the basin, and A f is the area of the playa floor. Chloride mass deposition flux can be estimated from (1) chloride concentrations in precipitation and dry fallout times the mean annual precipitation or (2) the estimated atmospheric fallout of 36Cl at the latitude of the site (23 atoms m22 s21 [Bentley et al., 1986]) divided by the measured prebomb 36 Cl/Cl ratio in the unsaturated zone (samples from 3.1 to 10.7 m in borehole EF 60 (490 3 10215 [Scanlon et al., 1998]). Method 1 resulted in a precipitation weighted average chloride concentration of 0.14 g m23 (approximate monthly measurements of chloride for 2 years), whereas method 2 resulted in a chloride deposition flux of 87 mg m22 yr21, which is equivalent to a chloride concentration in precipitation and dry fallout of 0.27 g m23 calculated on the basis of a long-term mean annual precipitation of 320 mm. Method 2 is considered more valid for this study because it provides an estimate of long-term chloride mass deposition flux [Scanlon et al., 1998]. If the variations in 36Cl fallout with precipitation are taken into account as described by Scanlon et al. [1997a], the resultant chloride deposition flux is 102 mg m22 yr21. This value implies an average chloride concentration in precipitation of 0.32 g m23. The range of deposition fluxes (87–102 mg m22 yr21) gives some indication of the uncertainties in this parameter. Tritium (half-life 12.43 years) is produced naturally by cosmic ray neutrons in the upper atmosphere, and tritium concentrations in precipitation range from 5 to 10 tritium units (TU). Tritium concentrations increased from 10 to $2000 TU during atmospheric nuclear testing [International Atomic Energy Agency (IAEA), 1983] that was initiated in 1952 and peaked in 1963–1964. The subsurface distribution of bombpulse tritium can be used to estimate water fluxes and to evaluate preferential flow. 3.2.
Field and Laboratory Methods
Detailed descriptions of methods are given by Scanlon [1994] and Scanlon et al. [1998]. The EM31 ground conductivity meter (Geonics Limited, Mississauga, Ontario, Canada) was used to measure ECa of the subsurface [McNeill, 1992]. The intercoil spacing in the EM31 is 3.7 m. The exploration depth is ;3 m when the instrument is operated in the horizontal dipole mode (both coils vertical on the ground) and ;6 m when the instrument is operated in the vertical dipole mode (both coils horizontal on the ground). Electromagnetic induction transects were conducted perpendicular to Blanca Draw (EF 94 to EF 111; Figure 3), Grayton Lake, and the fissure (Figure 1). Boreholes were drilled with a hollow-stem auger without any drilling fluid, and samples were collected with a split spoon. Particle-size analyses were conducted on sediment samples from 37 boreholes using sieving and hydrometer analyses [Gee
987
Table 1. Mean Water Content, Chloride Content, and Clay Content Calculated From Sediment Samples in the Upper 6 m From Boreholes According to Equation (8) and Compared with ECa Measured at the Surface With the EM31
Borehole EF 94 EF 110 EF 93 EF 28 EF 111 GL 2 GL 4 EF 35 EF 36
Geomorphic Setting gully Blanca Draw slope interdrainage interdrainage playa eolian sheet fissure 10 m from fissure
Water Chloride Clay ECa Content Mean, Content (VD) 21 Mean, mg Cl kg Mean, Mean, g g21 sediment % mS m21 0.17 0.13 0.09 0.07 0.1 0.15 0.05 0.12 0.08
14 5 602 184 318 59 89 10 511
50 45 45 52 45 61 21 24 39
135 30 110 50 50 66 30 75 61
ECa, apparent electrical conductivity; VD, vertical dipole.
and Bauder, 1986] (Table A11). Sediment samples were also collected from 50 boreholes for laboratory determination of gravimetric water content by oven drying the samples for 24 hours [Gardner, 1986] and for chloride content (Figure 1 and Table A1). Many samples were collected from the same boreholes as those that had been sampled for texture. To determine chloride content, double-deionized water was added to the dried sediment sample in a 3:1 ratio. Both ion chromatography (detection limit 0.1 g m23) and potentiometric titration (detection limit 2 g m23) were used to analyze chloride concentrations in the supernatant. Chloride concentrations are expressed as g Cl m23 pore water (equivalent to milligrams Cl per liter of water). Water content was monitored by a neutron moisture probe (model 503 DR, CPN Corporation, Martinez, California) in nine neutron probe access tubes (Figure 1). Monitoring depths ranged from 0.3 m to maximum depths of 2.2– 8.6 m in different access tubes. Sediment samples were collected from 47 boreholes to a maximum depth of 31 m for water-potential measurements in the laboratory (Figure 1 and Table A1). Water potential was measured with a water activity meter (model CX-2) and a thermocouple psychrometer sample changer (model SC-10A), both manufactured by Decagon Devices, Inc., Pullman, Washington. The water activity ( A w ) was converted to water potential (c, Pa) using the Kelvin equation [Gee et al., 1992]. Because water potentials measured with the two instruments were similar [Scanlon et al., 1999], the results section presents only water potentials measured with the Decagon SC10A thermocouple psychrometer. Field psychrometers consisted of screencaged, thermocouple psychrometers (model 74, PST 66, J.R.D. Merrill Specialty Equipment, Logan, Utah) and were installed at different times beginning in April 1993. Water potentials and temperatures were logged daily at depths of 0.3–19.3 m at 0900 LT. Good agreement was found between duplicate psychrometers installed at 0.3, 0.4, 0.5, 7.6, and 19.3 m depth. At all other depths, one or both of the duplicate psychrometers stopped functioning. 1 Table A1 is available on diskette or via anonymous FTP from kosmos.agu.org, directory APEND (Username 5 anonymous, Password 5 guest). Diskette may be ordered by mail from AGU, 2000 Florida Avenue, NW, Washington, DC 20009 or by phone at 800-9662481; $15.00. Payment must accompany order.
988
SCANLON ET AL.: ARID GEOMORPHIC SETTINGS AND UNSATURATED FLOW
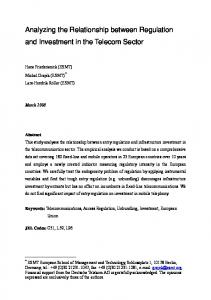
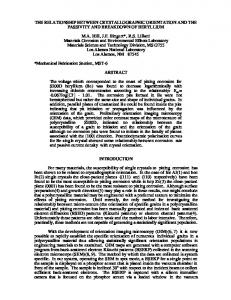
Figure 4. (a) Apparent electrical conductivity (ECa) measured with a surface EM31 meter in a transect from EF 94 in the gully in Blanca Draw to EF 28 and EF 111 in the interdrainage basin-fill deposits; (b)–(e) profiles of gravimetric water content, (f)–(i) water potential, and (j)–(m) chloride concentration along the transect. Samples were collected for tritium analysis from boreholes EF 79 and EF 117 in the interdrainage eolian sheet, EF 92 beneath the fissure, EF 96 10 m from the fissure, and GL 2 in Grayton Lake. Water was extracted from core samples in the laboratory by toluene azeotropic distillation and purified using paraffin wax [Ingraham and Shadel, 1992]. The samples were enriched and analyzed using liquid scintillation methods at the University of Arizona Tritium Laboratory or using gas proportional counting at the University of Miami Tritium Laboratory.
4.
Results and Discussion
4.1.
Electromagnetic Induction
Electromagnetic induction was used to evaluate large-scale spatial variability in unsaturated zone characteristics among
geomorphic settings. The surface EM transect from the gully in Blanca Draw (EF 94) to the interdrainage basin-fill deposits (EF 28 and EF 111) showed a wide range of ECa (Figures 1, 3, and 4a). Because clay content is fairly uniform in profiles along the transect (45%–52%), differences in surface conductance associated with variations in clay content cannot be used to explain the variations in ECa (Table 1). High values of ECa were mapped in the gully, which correspond to high water contents (EF 94; mean 0.17 g g21) attributed to frequent ponding of water in the gully. The large decrease in ECa from the gully (EF 94) to the surrounding draw (EF 110) (vertical dipole (VD): ;30 mS m21) is consistent with a 24% reduction in mean water content and with the threefold decrease in chloride content. Values of ECa increased markedly from the draw, where mesquite is found, to the slope (VD: 80 –110 mS m21),
SCANLON ET AL.: ARID GEOMORPHIC SETTINGS AND UNSATURATED FLOW
where grasses occur. This increase in ECa correlates with a 120-fold increase in chloride content from the draw (EF 110) to the slope (EF 93). The ECa remained high for ;100 m in the slope area and decreased gradually to lower values typical of the interdrainage basin-fill deposits (VD: 23–50 mS m21), which is consistent with the twofold or threefold decrease in chloride. Similar trends in ECa were measured in four other transects at right angles to the draw, which showed low ECa in the draw and sharp increases in ECa values in the adjacent slope areas [Scanlon et al., 1999]. The floor of Grayton Lake playa was characterized by fairly uniform values of ECa, which is consistent with the similarity in water and chloride contents in three profiles beneath the playa (Figures 5a, 5c, and 5g and Table 1). Higher values of ECa in the playa relative to the adjacent eolian sheet area are attributed to the higher clay and water content beneath the playa. Chloride profiles are similar in both settings (Figures 5f and 5g). In the vicinity of the fissure, ECa was approximately 2 times higher than in the surface adjacent to the fissure (Figure 6a). The EM transect was conducted adjacent to profiles EF 35 and EF 36. Chloride is flushed out beneath the fissure, resulting in lower pore water conductivity. Low chloride content in the pore water is characteristic of fissured sediments [Scanlon et al., 1997b]. Although the 50-fold lower chloride content and 38% lower clay content beneath the fissure (EF 35) should result in lower ECa, these two effects are offset by the 50% higher water content beneath the fissure than 10 m from the fissure (EF 36). The insensitivity of the EM response to the higher chloride content adjacent to the fissure suggests that the water content in this zone is below the critical level and that the EM31 is primarily measuring surface conductance. When water content is below the critical level, electromagnetic induction is insensitive to variations in chloride content in the pore water, as seen in the data adjacent to the fissure. Above the critical water content, ECa varies with all three parameters, water content, chloride content, and clay content. In most cases, although high water flux is associated with high water content and low chloride content which have opposite effects on ECa, the data from the gully and the fissure indicate that water-content variations dominate the EM variations. Variation in chloride content is a secondary control and is seen in many of the profiles in the drainage-interdrainage transect (Figure 4). 4.2. Spatial Variability in Sediment Texture and Water Content Sediments throughout the basin are generally fine grained. Mean clay contents in the drainage and interdrainage areas, excluding the eolian sheets, range from 38% to 56% (Tables A1 and 2). The finest sediments are found in Grayton Lake playa (mean clay content 56%). Clay minerals in the playa include smectite, illite, and kaolinite with moderate shrink/ swell potential [Scanlon et al., 1998]. The only geomorphic setting with coarse-textured sediments is the young eolian sheet (mean sand content 56%). Local zones of coarse-grained sediments with up to 50% gravel are found beneath the eolian sheets and reflect paleochannels (E. C. Collins, personal communication, 1996). Sand contents in the older eolian sheet (mean 41%) are slightly lower than those in the young eolian sheet. Spatial variability in water content is controlled primarily by differences in texture of the sediments. Mean water content is negatively correlated with percentage of sand (R 5 20.67 and n 5 37; Figure 7a) and is positively correlated with
989
Figure 5. (a) ECa measured with a surface EM31 meter in a transect from the eolian sheet adjacent to Grayton Lake (GL 4) toward the center of Grayton Lake (GL 2); (b) and (c) profiles of gravimetric water content, (d) and (e) water potential, and (f) and (g) chloride concentration. Boreholes GL 5 and 6 were drilled in Grayton Lake but not on the transect.
percentage of clay (R 5 0.69 and n 5 37; Figure 7b). All correlations are statistically significant at a 5 0.05. These data indicate that water content can be used to infer the texture of these sediments. The lowest water contents (mean 0.07 g g21; Tables A1 and 2), which correspond to the coarsest sediments, were found in the young eolian sheet, and the highest water contents (mean 0.15 g g21), which correspond to the highest clay contents, were found in Grayton Lake. Higher mean water contents in topographic depressions (fissure, gully, and borrow pit) relative to those in other geomorphic settings with similar textures are attributed to higher water fluxes in these depressions (Table 2 and Figure 7). 4.3.
Spatial Variability in Water Potential and Chloride
Mean water potentials were plotted against mean chloride concentrations to evaluate variations in unsaturated flow in the different geomorphic settings (Figure 8). The various geomorphic settings form distinct groups on this plot. Significance tests
990
SCANLON ET AL.: ARID GEOMORPHIC SETTINGS AND UNSATURATED FLOW
Figure 6. (a) ECa measured with a surface EM31 meter in a transect at right angles to Eagle Flat fissure; and profiles of (b) gravimetric water content, (c) water potential, and (d) chloride concentration in (EF 35) and 10 m from the fissure (EF 36). conducted on mean differences, given unknown and unequal variance, showed that the geomorphic settings are significantly different [Scanlon et al., 1998]. The water potential/chloride plot can basically be divided into four unequal sections: high water potential, low chloride (localized topographic depressions) (Figure 8a); high water potential, moderate to high chloride (Figure 8b); low water potential, low chloride (Blanca
Draw) (Figure 8c); and low water potential, moderate to high chloride (Grayton Lake, interdrainage eolian sheet, and interdrainage other) (Figure 8d). Note that none of the profiles plot in Figure 8b because high water potentials imply high current water fluxes, which would flush out chloride. The high water potentials and low chloride concentrations in the localized topographic depressions indicate high water fluxes. The low
Table 2. Summary of Texture, Water Content, Water Potential, Chloride, Tritium, and Water Fluxes for Different Geomorphic Settings Water Content Mean, g g21
Sand Mean, %
Silt Mean, %
Clay Mean, %
Interdrainage (eolian sheet) eolian sheet (old) eolian sheet (young)
41 56
24 17
34 25
Interdrainage (other) alluvial fan basin-fill deposits slope (Blanca Draw) 10 m from fissure
0.09 0.07 0.07
23 23 28 35
20 29 26 24
38 48 46 40
Drainage Grayton Lake playa Blanca Draw
22 31
22 27
Localized topographic depressions fissure gully borrow pit
35 24 53
30 24 17
Geomorphic Setting
Water Potential Mean, MPa
Chloride Mean, g m23
Tritium Range, TU
25.0 24.9
3264 1789 2138
0.1–11.4
0.07 0.11 0.11 0.10 0.10
27.6 25.2 25.8 26.8
5757 3187 6230 5328 5184
56 40
0.15 0.10 0.12
25.1 23.6
544 87 407
3.2–16.8
34 51 24
0.13 0.17 0.12 0.14
20.9 (5) 21.1 (1) 20.3
576 349 10 313
6.8–33.2
6.2–15.2
Water Flux Mean,* mm yr21
Water Flux Range, mm yr21
0.03 (2) 0.06 (2) 0.05 (2)
0.02–0.05 (2) 0.01–0.36 (2) 0.01–0.36 (2)
0.02 (1) 0.03 (1) 0.02 (1) 0.02 (1) 0.02 (1)
0.01–0.02 (1) 0.01–0.05 (1) 0.01–0.10 (1) 0.01–0.03 (1) 0.01–0.10 (1)
0.23 (1 er) 3.8 (1 er) 1.5 (1 er)
0.07–0.98 (1 er) 0.2–20 (1 er) 0.07–20 (er)
8.3 (4 er) 1.5 (3 er) 13.4 (er) 10.4
0.56–25.5 (4 er) 0.4–2.8 (3 er) 2.4–32.9 (er) 0.4–32.9 (er)
Water fluxes are estimated from chloride data. * Calculated mean using samples (1), below 1 m depth; (2), below 2 m depth; (3), upper 5 m; (4), upper 7.5 m (EF 120); and (5) upper 5.0 to 9.1 m; (er) excludes runon.
SCANLON ET AL.: ARID GEOMORPHIC SETTINGS AND UNSATURATED FLOW
991
Figure 7. Correlation between mean water content and mean percent (a) sand and (b) clay in 37 profiles. water potentials and high chloride concentrations characteristic of the interdrainage areas indicate low water fluxes. Data from the eolian sheet plot in the center and indicate higher water fluxes than those of other interdrainage settings. An apparent inconsistency between low water potentials in Blanca Draw, which indicate low water fluxes, and low chloride concentrations, which indicate high water fluxes, can be resolved by considering the different timescales represented by water potential and chloride data. Water potential data represent current water fluxes, which are low, whereas chloride data represent long-term net water fluxes and indicate that water fluxes were higher at some time in the past. Because water ponds in Grayton Lake and was ponded during the study for ;1 year, chloride concentrations were expected to be negligible; however, chloride concentrations were higher than expected. The higher mean chloride concentration in Grayton Lake (mean 544 g m23) relative to that in Blanca Draw (87 g m23) may be attributed to the higher clay content in Grayton Lake, which decreases water fluxes (Tables A1 and 2). Vertical water potential profiles can be used to evaluate the direction of water movement. Typical laboratory-measured
water potential profiles outside the localized zones of surface ponding had low values near the surface that increased with depth (Figures 4g– 4i, 5d, and 5e). The upward decrease in water potentials indicates an upward driving force for water flow. In addition to estimation of the flow direction from the upward gradient in water potential, water potentials generally plotted to the left of the equilibrium line in most profiles, which also indicates upward flow under steady flow conditions. Mean water potentials in Blanca Draw (23.6 MPa; Figure 4g and Tables A1 and 2) were higher than those in the profiles in the adjacent slopes (26.0 MPa; Figure 4h) and water potentials plotted to the right of the equilibrium line at depths $6 –15 m (Figure 4g), which suggests drainage at depth below the draw. Water potentials in Grayton Lake were uniformly low (mean 23.8 to 25.7 MPa) throughout the profiles (Figure 5e and Table A1). High water potentials in the localized topographic depressions, such as the fissure (Figure 6c), the gully (Figure 4f), and the borrow pit, generally plotted to the right of the equilibrium line, which indicates drainage under steady flow conditions. High water potentials beneath the fissure were generally re-
Figure 8. Relationship between mean water potentials and mean chloride concentrations calculated from profiles drilled in various geomorphic settings. Profiles group into interdrainage eolian sheet, including young and old eolian sheets; interdrainage (other), including alluvial fan, basin-fill deposits, slope adjacent to Blanca Draw, and adjacent to the fissure; drainage areas including Grayton Lake; and Blanca Draw and localized topographic depressions (fissure, gully in Blanca Draw and borrow pit). Confidence intervals on the means for each geomorphic setting given an unknown variance were calculated.
992
SCANLON ET AL.: ARID GEOMORPHIC SETTINGS AND UNSATURATED FLOW
Figure 9. Mean water fluxes calculated from chloride data for the various geomorphic settings. Data from depths .1 m were used for all settings except the interdrainage eolian sheets, where data from depths .2 m were used. Water fluxes in the drainage areas and in the topographic depressions were increased by an order of magnitude to account for chloride in runon. stricted to the upper 6 –10 m of the profiles. Below this zone, water potentials decreased sharply to values similar to those in profiles 10 m away from the fissure. Vertical chloride profiles were also examined. In the interdrainage areas outside the eolian sheets, peak chloride concentrations (4534 –17,821 g m23; Table A1) were found at 0.5–2.6 m depth, and chloride concentrations decrease gradually below the peak (Figures 4l and 4m). The highest chloride concentrations were found in the slope area adjacent to Blanca Draw (EF 93; Figure 4l) and adjacent to the fissure (EF 36; Figure 6d). Surface water runon in these areas may have added chloride to these profiles in addition to that provided by precipitation. Chloride was flushed out (concentrations #250 g m23) in the upper 0.5–2 m depth in the eolian sheet because the sediments are coarse-grained. Peak chloride concentrations ranged from 1716 to 7831 g m23 in the eolian sheet (Table A1). All three chloride profiles in Grayton Lake had bulge shapes and similar concentrations, with peak values from 1084 to 1315 g m23 (Figure 5g). Vertical chloride profiles beneath Blanca Draw (mean 87 g m23), including the gully (mean 349 g m23), were generally uniformly low (Figures 4j and 4k). The localized topographic depressions generally had uniformly low vertical chloride profiles. Low chloride concentrations were restricted to the upper 6 –10 m beneath the fissure, whereas concentrations in the profiles 10 m away from the fissure were high (Figure 6d and Table A1). This variation in chloride concentration is similar to the variations in water potential and indicates higher water fluxes restricted to the upper 6 –10 m zone. Chloride was leached throughout the profile in the borrow pit (mean 10 g m23; EF 15; Tables A1 and 2). 4.4.
Water Flux Estimates From Meteoric Chloride
Calculated water fluxes from chloride data (equation (2); Cl deposition flux 87 g m22 yr21) were uniformly low in the eolian sheets below 2 m depth (mean 0.05 mm yr21) and in the other interdrainage areas below 1 m depth (mean 0.02 mm yr21) (Tables A1 and 2 and Figure 9). Surface leaching of chloride to a depth of ;2 m corresponded to higher water fluxes in nearsurface coarse eolian sediments. Water fluxes in the slope
region adjacent to Blanca Draw and to the fissure may be underestimated because additional chloride provided by runon was not accounted for in the analysis. The higher water fluxes in the eolian sheets relative to the other interdrainage settings is also corroborated by the shorter residence times of pore water in the eolian sheet (mean ;30,000 years at 10 m depth) relative to the other interdrainage settings (mean ;83,000 years at 10 m depth). It is difficult to estimate water fluxes from chloride profiles in the drainage areas because runon or chloride concentrations in runon were not quantified. Minimum mean water fluxes below the upper meter based on (2) that neglect runon ranged from 0.1 to 1.0 mm yr21 (mean 0.2 mm yr21) in Grayton Lake and from 0.2 to 20 mm yr21 (mean 4 mm yr21) in Blanca Draw (Table 2). The effect of runon on water flux was evaluated by using (4) with the following parameters: runon (estimated to be ;10% of the precipitation (32 mm yr21)), area of basin (northwest Eagle Flat) 5 500 km2, area of playa floor (Grayton Lake) 5 20 km2, and chloride concentration in runon (estimated to be ;5 times that in precipitation (1.4 g m23)). The resultant water fluxes were about an order of magnitude greater than those based on (2) that neglected runon (Figure 9). Water fluxes were also estimated for the topographic depressions. The EF 120 chloride profile beneath the fissure that was fairly completely flushed was used to estimate water flux using (2). The mean chloride concentration for EF 120 in the upper 7.5 m was 21 g m23, and the mean water flux was 8 mm yr21 (Table 2). Inclusion of runon effects should increase this estimate by about an order of magnitude to 80 mm yr21. Water flux can also be estimated from the depth of the chloride front by assuming, on the basis of aerial photographs, that the fissure has been active for at least 50 years. The approximate location of the chloride front was 9 m (EF 35); therefore the resultant water velocity was ;180 mm yr21. The resultant water flux was 36 mm yr21 (mean u; 0.2 m3 m23). Because water flow is episodic in desert systems, most of the flux may have taken place after a sequence of rainfall events. Minimum estimates of water flux for the borrow pit ranged from 2 to 33 mm yr21 (mean 13 mm yr21) (Tables A1 and 2). Low chloride concentrations in the upper 5 m beneath the gully in Blanca Draw indicate a mean water flux of 1.5 mm yr21. It is difficult to estimate the amount of runon into these topographic depressions; however, we estimate at least an order of magnitude increase in flux as a result of runon. 4.5.
Spatial Variability in Tritium
High tritium concentrations (3.1–11.4 TU) in an interdrainage profile (EF 79) in the upper 5 m probably reflect the tail of the bomb pulse (Figure 10). Tritium levels below this zone were low in EF 79 and EF 117 (range 0.14 6 0.24 –1.71 6 0.44 TU (62 standard deviations)). In some cases the tritium levels were ,2 standard deviations, indicating no tritium. The tritium level in a procedural blank (0.98 6 0.5 TU; dead, tritiated water added to an oven-dried sample) was similar to the tritium levels found in EF 79 and EF 117 profiles at depth and indicates no tritium in these settings [Scanlon et al., 1999]. The absence of tritium is consistent with the high chloride concentrations and low water fluxes estimated for these sediments. High tritium levels were found beneath and adjacent to the fissure and beneath the playa (Figure 10). Tritium penetrated much deeper beneath the fissure (;20 m) than expected from the depth of chloride leaching (;10 m; Figure 6d). The most
SCANLON ET AL.: ARID GEOMORPHIC SETTINGS AND UNSATURATED FLOW
Figure 10. Profiles of tritium in EF 79 and EF 117 (interdrainage eolian sheet), EF 92 (fissure), EF 96 (10 m from fissure), and GL 2 (Grayton Lake). plausible explanation for the high tritium concentrations is preferential flow [Scanlon et al., 1997b]. 4.6.
Temporal Variability in Unsaturated Flow
The previous section focused on mean water fluxes; however, water fluxes may change over time. Temporal variability in unsaturated flow was evaluated over different timescales: short-term variability based on water content and water potential monitoring during the time of the study, longer-term variability based on comparison of water potential and chloride data, and long-term variability based on chloride data. Water content monitoring with a neutron probe in the various geomorphic settings showed that penetration of water was restricted to the upper 0.6 m depth except in areas subject to
993
ponding, such as the fissure (Figure 11c) and the gully in Blanca Draw (Figure 11a). Water penetrated to 1.2 m depth beneath the fissure after 131 mm of rain fell in July 1993 (38 mm in 1 day); however, the infiltrated water was removed from the subsurface by evapotranspiration in ;3 months. These data show how effectively the creosote bushes along the fissure remove infiltrated water. The zone of infiltration beneath the fissure was localized, as shown by the lack of variations in water content in a neutron probe access tube 10 m from the fissure (Figure 11d). High rainfall in September 1995 (116 mm) resulted in water penetration to 0.8 m in the gully (EF 100NP; Figure 11a). Ponding probably occurred after this wet period in the gully because 70 mm of rain fell in 1 day. Water content did not vary with time in Blanca Draw outside the gully (Figure 11b). Water ponded ephemerally in Blanca Draw and Grayton Lake. Blanca Draw was flooded in May 1992, and water levels were up to 0.4 m above ground surface in some areas; however, the flooding lasted ,1 week, and samples from boreholes drilled in October 1992 had low water contents (mean 0.09 g g21; EF 41 and 85; Figure 4c) similar to those in profiles in adjacent geomorphic settings (mean 0.11 g g21; EF 43; slope area; Figure 4d). Grayton Lake was also flooded in May 1992 and remained flooded until approximately October 1993. Mean water content in sediment samples from GL 2 (0.15 g g21) drilled in September 1994 was similar to mean water contents in GL 5 (0.16 g g21) and GL 6 (0.14 g g21), which were drilled in April 1996 (Figure 5c and Table A1). These data indicate little infiltration of water after flooding. In situ water potentials were monitored in the interdrainage eolian sheet area by thermocouple psychrometers (Figure 12). Water potentials at 0.3– 0.5 m depth were quite variable. The greatest increase in water potentials in the shallow zone oc-
Figure 11. Variation in water content with depth and time in neutron probe access tubes.
994
SCANLON ET AL.: ARID GEOMORPHIC SETTINGS AND UNSATURATED FLOW
Figure 12. Temporal variations in water potential monitored by in situ thermocouple psychrometers in the old eolian sheet at depths of 4.9 and 7.6 m (April 1993 to August 1996), 0.3–1.8 m (February 1994 to August 1996), and 19.3 m (July 1995 to August 1996). For clarity, only data from one psychrometer is shown for each depth. curred after 70 mm of rain fell on September 15, 1995, and June 27, 1996. Water potentials at 0.3 m depth increased only to ;20.5 MPa 3 days after these rainfall events, indicating that the sediments did not become saturated at this depth. Sequential increases in water potential at 0.3, 0.4, and 0.5 m depth over time suggest uniform downward movement of water in this zone. Water potentials at 1.7 and 4.9 m depth showed small-scale seasonal fluctuations attributed to seasonal temperature fluctuations [Scanlon and Milly, 1994], whereas water potentials at 7.6 m depth were fairly uniform over time. Water potentials at depths .10 m converged to ;23 MPa. Vertical profiles of water potential on May 28, 1996, showed that water potentials increased with depth and suggest an upward driving force for water movement, which is consistent with laboratorymeasured data (Figure 13). Field-measured water potentials were slightly higher than laboratory-measured water potentials in a nearby borehole (EF 66), which is attributed to slight drying of sediment during sample collection and analysis. Comparison of soil physics and environmental tracer data gives some indication of temporal variability in unsaturated flow. Low water potentials in Blanca Draw indicate current low water fluxes, whereas low chloride concentrations indicate higher water fluxes at some time in the past (Figures 4g and 4k). The time period represented by the current low water potentials is difficult to estimate. It depends partly on how efficiently mesquite trees can remove water from the subsurface. Vertical chloride profiles can also be used to estimate temporal variability in water flux. Beneath the fissure, water fluxes changed from low (;0.02 mm yr21; chloride ;5000 g m23 at depth) to high (;80 mm yr21 including runon; chloride 3–30 g m23 near the surface; mean 13 g m23) (EF 120). The long period represented by chloride profiles in the interdrainage settings spans paleoclimatic variations (Figures
14a, 14c, and 14e). Response to paleoclimate varied among these settings and was examined using plots of cumulative chloride versus cumulative water content (Figures 14b, 14d, and 14f). Profiles in the interdrainage basin-fill deposits and old eolian sheet did not respond to postulated increased precipitation during the Pleistocene, as shown by the uniform slope in the cumulative chloride versus cumulative water plot (Figure 14b). In contrast, there is a marked change in slope of the cumulative chloride versus cumulative water plots for some profiles in the young eolian sheet (EF 91, 101, and GL 4) that corresponds to a chloride mass balance age of 8900 (EF 101) to 16,400 years (GL 4) (Figure 14f). Uncertainty in these ages is at least 30%, based on uncertainties in the chloride deposition
Figure 13. Comparison of water potentials measured in sediment samples from borehole EF 66 with water potentials monitored by in situ thermocouple psychrometers on May 28, 1996.
SCANLON ET AL.: ARID GEOMORPHIC SETTINGS AND UNSATURATED FLOW
995
Figure 14. Calculated age based on chloride mass balance and cumulative water versus cumulative chloride for profiles in the (a) and (b) interdrainage basin-fill deposits and old eolian sheet and (c), (d), (e), and (f) young eolian sheet. flux. Higher water fluxes before that time correspond approximately to the Pleistocene period. Water fluxes increased by up to a factor of 5 in GL 4 (0.15 mm yr21 prior to 16,400 years to 0.03 mm yr21 after 16,400 years). Some profiles in the young eolian sheet may not have extended deep enough to reflect the Pleistocene climate change (EF 95; Figure 14c). Other shallow profiles in the young eolian sheet, however, showed no response to the Pleistocene climate change (EF 70, 75, and 76; Figures 14c and 14d). It is difficult to determine what controls the system’s response to increased precipitation in the Pleistocene. The sediment texture in the shallow zone in profiles EF 91, EF 101, and GL 4 is similar to those in other profiles in the young eolian sheet that did not show any response to Pleistocene climate change, suggesting that some factor other than texture is responsible. It is possible that microtopographic variations may have been important. 4.7. Relationship Between Geomorphic Setting and Unsaturated Flow Results of this study show that geomorphology and unsaturated flow are highly related. Variability in physical and chemical parameters within geomorphic settings was generally much less than variability between geomorphic settings. The large number of boreholes within each geomorphic setting provided detailed information on spatial variability that was
supported by data from noninvasive geophysical techniques between boreholes. Physical and chemical results were consistent. Interdrainage settings, including alluvial fans, basin-fill deposits, and eolian sheets, are generally characterized by low water fluxes, as indicated by low water contents, low water potentials, and high chloride concentrations. Mean water fluxes estimated from the chloride data ranged from 0.05 mm yr21 in the eolian sheets below the upper 2 m zone to 0.02 mm yr21 in the other interdrainage areas below the upper 1 m zone (Figure 9 and Table 2). Some chloride profiles in the young eolian sheet indicate leaching to a 2 m depth associated with coarse-textured sands. The drainage system includes Blanca Draw and Grayton Lake playa. Current water fluxes in Blanca Draw are low outside the gully, as shown by low water contents and low water potentials. Low chloride concentrations in these profiles indicate that chloride either never accumulated or was flushed out in the past. The mean water flux estimated from chloride data is 4 mm yr21 (excluding runon; Tables A1 and 2). Including the effects of runon would increase the water fluxes by about an order of magnitude (Figure 9). Grayton Lake playa is characterized by very uniform profiles of low water content and low water potentials, indicating low water fluxes during the sam-
996
SCANLON ET AL.: ARID GEOMORPHIC SETTINGS AND UNSATURATED FLOW
Geomorphology may have also influenced the response of the unsaturated zone to higher precipitation in the Pleistocene. This variation in response is suggested by some deep profiles (#25 m depth) in selected areas of the young eolian sheet, which had low chloride concentrations at depth (EF 91, 101, 102, and GL 4) that are attributed to higher water fluxes during the Pleistocene. Most other profiles in interdrainage settings showed no variations in chloride concentration in response to Pleistocene climate. 4.8. Comparison With Data From Geomorphic Settings in Other Basins Figure 15. Relationship between mean water potentials and mean chloride concentrations calculated from profiles drilled in drainage and interdrainage areas in the Hueco Bolson [Scanlon, 1994], interdrainage alluvial fans at Beatty, Nevada, and Ward Valley, California [Prudic, 1994], and at the Nevada Test Site [Tyler et al., 1996]. Confidence intervals for mean values for different geomorphic settings in the Eagle Flat basin are included for comparison. pling time. The mean water flux estimated from chloride data is 0.2 mm yr21 (excluding runon). Inclusion of runon would increase this value to ;2 mm yr21 (Tables A1 and 2). The presence of bomb-pulse tritium throughout the sampled profile is attributed to preferential flow. Although desiccation cracks during the early stages of flooding of the playa act as preferred pathways, these cracks eventually seal and additional infiltration is greatly reduced by the thick clay section, as indicated by long-term ponding of water during the study. Water fluxes were highest beneath localized topographic depressions that periodically pond, such as the fissure, the gully, and the borrow pit. Evidence of high water fluxes was provided by high water contents, high water potentials, and low chloride concentrations. The area of the basin occupied by these features is very small, #1%. The vertical extent of leaching is limited to the upper 6 –10 m beneath the fissure. The mean water flux based on pore water chloride concentrations was ;8 mm yr21 (Table 2). Inclusion of the effects of runon would increase this value to ;80 mm yr21. Textural data from many boreholes beneath the fissure indicate that a coarse layer lies at a depth of ;10 m, which may serve as a natural capillary barrier that correlates with the chloride increase beneath the fissure (EF 35) [Scanlon et al., 1997b]. Temporal variability in water flux is also related to geomorphic settings. Short-term variability in response to precipitation events was monitored in topographic depressions. Longer term variability is shown by the coexistence of high water potentials and low chloride concentrations in the Blanca Draw drainage area, which indicate low current water fluxes and higher water fluxes in the past. We can estimate bounds for the time period represented by the currently low water fluxes because we know that it has not been long enough for substantial quantities of chloride to accumulate. It may be very short, depending on how effectively dense mesquite vegetation can remove water from the unsaturated zone. The effectiveness of vegetation in removing water was demonstrated in a lysimeter study at the Hanford site, where revegetation of a bare lysimeter by deeprooted plants (Russian thistle) removed excess water in 3 months to a depth of ;3 m [Gee et al., 1994]. Bulge-shaped chloride profiles beneath Grayton Lake may also indicate higher water flux in the past.
Unsaturated zone hydrologic studies have been conducted in arid systems throughout the world. In many cases, however, the studies have been restricted to a particular geomorphic setting, and few studies have examined the relationship between different geomorphic settings and unsaturated flow. Detailed studies of unsaturated flow were previously conducted in drainage and interdrainage settings in the Hueco Bolson, immediately northwest of the Eagle Flat basin [Scanlon, 1992, 1994] and in alluvial fan settings in Ward Valley (California), Amargosa Valley (Beatty, Nevada) [Prudic, 1994], and the Nevada Test Site (Nevada) [Tyler et al., 1996]. Data from these settings are shown on a plot of water potential versus chloride (Figure 15). Data from the interdrainage settings are similar to those in the Eagle Flat basin and suggest low water fluxes under current climatic conditions. The plotted points represent data from the upper 10 m at the Beatty site and from the upper 30 m at the Nevada Test Site. Chloride concentrations at the Beatty site decreased to 50 g m23 at depths $10 m, indicating an increase in water flux from 0.01 (1–10 m zone) to 2 mm yr21 ($10 m depth). The higher water fluxes at depth were attributed to the Amargosa River being more active during the Pleistocene [Prudic, 1994]. Low chloride concentrations at depths of 30 – 60 m (mean 18 g m23) at one of the Nevada Test Site profiles were attributed to its location at the confluence of alluvial fans, which affected the system’s response to higher precipitation during the Pleistocene. Data from the Hueco Bolson drainage have about an order of magnitude higher mean chloride concentration (mean 880 g m23) than those in the Blanca Draw (mean 87 g m23). The higher chloride concentration and resultant lower water flux in the Hueco Bolson drainage are attributed to the lower topographic expression (maximum relief ;0.6 m) relative to Blanca Draw (maximum relief ;3 m) in the Eagle Flat basin. These data suggest that drainage size is important and that small drainages, such as those studied in the Hueco Bolson, may not be effective in creating high water fluxes through the unsaturated zone. Although the data are limited, many basins show the effect of higher recharge associated with drainage areas, either currently or during Pleistocene times. Lower water fluxes are generally found in interdrainage settings. The similarities between profiles in coarse-grained alluvial fan sediments in Ward Valley, Amargosa Valley, and the Nevada Test Site and those in fine-grained sediments in Eagle Flat basin suggest that sediment texture is not the primary control on water flux in the unsaturated zone. 4.9. Comparison of Different Methods of Evaluating Unsaturated Flow Results of this study show that multiple independent lines of evidence are required to obtain a comprehensive understanding of unsaturated flow processes. For example, use of chloride
SCANLON ET AL.: ARID GEOMORPHIC SETTINGS AND UNSATURATED FLOW
data alone in the drainage area (Blanca Draw) would suggest high water fluxes, whereas water-content and water-potential data indicate that current water fluxes are low. Electromagnetic induction provides valuable information on interborehole variability. The transects are inexpensive and can be conducted quickly. Apparent electrical conductivity varies with water content, chloride, and texture. In arid settings, however, water content is commonly below the critical level, and electromagnetic induction simply maps the surface conductance or textural variability. EM induction is a good reconnaissance tool; however, borehole data are required to determine accurately what is controlling variations in ECa mapped with the EM instruments. Data on physical parameters provide valuable information on current, unsaturated flow processes. Spatial variability of water content was of limited use in this study because of the high correlation between water content and sediment texture (Figure 7). Water-content monitoring was very useful in delineating zones of high water flux. Zones of high water flux were accurately delineated by water-potential data, such as beneath the fissure, the gully, and the borrow pit. Water-potential measurements also provide information on the direction of water movement. The water-potential data suggest current generally upward water movement in interdrainage and drainage areas and downward water movement in localized topographic depressions. The significance of low water potential measurements with regard to unsaturated water movement depends on how long it takes to develop such profiles. In areas of dense vegetation such as mesquite with deep roots, water may readily be removed from the subsurface and low water potentials may develop quickly. Information on long-term net water fluxes is provided by environmental tracers. Low chloride concentrations indicate high water fluxes beneath the fissure, the borrow pit, and the draw. The timing of these high water fluxes cannot be determined from chloride data alone because once flushed out of the sediment, chloride takes a long time to accumulate, and low chloride concentrations could be a relic of some past period of high water fluxes. The relic status of low chloride concentrations in profiles beneath the draw setting is suggested by the discrepancy between the chloride data, which indicate high water fluxes, and the low water-content and waterpotential data, which suggest current, low water fluxes. 4.10.
Controls on Unsaturated Flow
Previous studies suggest that topography, sediment texture, and vegetation can affect unsaturated flow. It is difficult to determine which of these parameters controls unsaturated flow because flow in the natural system reflects a delicate balance between the various parameters. The most important control on high current water fluxes in the study area is topographic depressions that pond water ephemerally, such as the fissure, the gully, and the borrow pit. In some cases, topographic control is not as obvious. Higher water fluxes during the Pleistocene in some areas of the young eolian sheet are attributed to microtopographic variations. Texture is also important. For example, the effects of water ponding in Grayton Lake on unsaturated flow are damped by swelling clays that minimize water flux. The vertical extent of chloride leaching beneath the fissure is attributed to natural capillary barriers that retain water. Vegetative cover in the various geomorphic settings is distinctive. Plants are opportunistic and concentrate in areas
997
where water is available. Mesquite, found along the fissures and in the draw, reflects zones of high water flux. Active roots of mesquite plants have been found to depths of at least 6 m in fractures beneath fissures in the Hueco Bolson [Scanlon, 1992]. The distribution of these plants therefore is a good indicator of zones of high water movement. The plants nevertheless do not appear to control the areas of high water flux but simply concentrate in those areas. 4.11.
Conceptual Flow Model
Results of physical and environmental tracer studies can be used to develop a conceptual model of unsaturated flow in the Eagle Flat basin. Most precipitation in the study area falls as local, intense, short duration convective summer storms. After such intense rainfall events, because water runs off and collects in topographic depressions such as the fissure, the gully, and the borrow pit, these topographic depressions spatially focus water. The depth of penetration of most water beneath the fissure is restricted to the upper 6 –10 m and is controlled partly by layering of sediments and natural capillary barriers. Preferential flow occurs to greater depths, as indicated by tritium data. Surface water runoff in the areas adjacent to the fissure and the slope region adjacent to the draw results in chloride addition to profiles adjacent to the fissure and in the slopes. The low permeability of the sediments results in shallow penetration of this runoff water and subsequent evapotranspiration, which concentrates chloride near the surface. Ponding of water also occurs in the draw and in the playa. Initial ponding in the playa results in preferential flow of water in desiccation cracks, as shown by deep penetration of tritium. Long-term ponding in the playa is attributed to expansion of the clays, which greatly reduces permeability of the clays after they have been wetted. Evaporation of the ponded water and slow infiltration results. Interdrainage areas outside localized topographic depressions are generally characterized by low water fluxes. Most of these areas show negligible response to past climate change such as during the Pleistocene.
5.
Conclusions
The relationship between geomorphic settings and unsaturated flow is clearly delineated in the Eagle Flat study area. The various geomorphic settings form distinct groups on a plot of water potential versus chloride. Interdrainage areas have low water potentials and high chloride concentrations, which indicate low water fluxes. Mean water fluxes range from 0.02 to 0.05 mm yr21. In contrast to interdrainage areas, localized topographic depressions (fissure, gully, and borrow pit) have high water potentials and low chloride concentrations, which indicate high water fluxes. The mean water flux in topographic depressions was estimated from chloride data to be ;10 mm yr21. Inclusion of runon would increase this estimate by about an order of magnitude to 100 mm yr21. The depth of penetration of the high water fluxes was restricted to the upper 10 m zone beneath the fissure. The topographic depressions occupy ,1% of the basin area. Drainage areas have low water potentials, which indicate low current water fluxes, and low to moderate chloride concentrations, which indicate higher water fluxes in the past. Minimum estimates of water fluxes estimated from chloride data range from 0.2 to 20 mm yr21 in Blanca Draw. Water fluxes beneath Grayton Lake ranged from 0.1 to 1.0 mm yr21. Inclusion of runon would increase these estimates of water flux by about an order of magnitude. Tritium
998
SCANLON ET AL.: ARID GEOMORPHIC SETTINGS AND UNSATURATED FLOW
down to a 17 m depth beneath the playa is attributed to preferential flow along pathways that result from desiccation of the shrink-swell clays. Geomorphic settings are also related to the degree of temporal variability in unsaturated flow. Pore water residence times in interdrainage areas were up to 136,000 years at 25 m depth, which spans paleoclimatic variations. Most interdrainage profiles showed negligible response to past climate fluctuations, with the exception of some profiles in eolian sheets, which showed increased water flux in response to Pleistocene climate change. Short-term variability in response to current precipitation events was restricted to topographic depressions. These findings indicate that geomorphology can provide valuable information on unsaturated flow, and they underscore the importance of localized topographic depressions for focusing unsaturated flow. This study emphasizes the importance of using multiple techniques to investigate unsaturated flow because each technique has limitations. Electromagnetic induction allowed evaluation of interborehole variability. Spatial variability in water content was controlled primarily by textural variability and was not a very good indicator of water movement. Water-content monitoring clearly delineated the zones of high water flux. Water potential and chloride were good indicators of areas of low and high water flux. The variety of techniques used in this study provided multiple independent lines of data to explain flow processes comprehensively. Acknowledgments. This research was funded by the Texas LowLevel Radioactive Waste Disposal Authority. We gratefully acknowledge the assistance of B. Mullican (BEG) in organizing the drilling and of the Bureau drilling crew. J. Liao, S.-C. Hsu, and J. Liang assisted with data reduction. The authors greatly appreciate data for the Nevada Test Site provided by J. Chapman (DRI) and M. Sully (Bechtel). The authors would like to acknowledge reviews by P. Cook (CSIRO), M. Person (Associate Editor, AGU, University of Minnesota), F. Phillips (New Mexico Tech), and two anonymous reviewers. Publication authorized by the Director, Bureau of Economic Geology.
References Allison, G. B., W. J. Stone, and M. W. Hughes, Recharge in karst and dune elements of a semi-arid landscape as indicated by natural isotopes and chloride, J. Hydrol., 76, 1–26, 1985. Allison, G. B., G. W. Gee, and S. W. Tyler, Vadose zone techniques for estimating groundwater recharge in arid and semiarid regions, Soil Sci. Soc. Am. J., 58, 6 –14, 1994. Bear, J., Dynamics of Fluids in Porous Media, Dover, Mineola, N. Y., 1972. Bentley, H. W., F. M. Phillips, and S. N. Davis, 36Cl in the terrestrial environment, in Handbook of Environmental Isotope Geochemistry, vol. 2b, edited by P. Fritz and J.-C. Fontes, pp. 422– 475, Elsevier Sci., New York, 1986. Cook, P. G., G. R. Walker, G. Buselli, I. Potts, and A. R. Dodds, The application of electromagnetic techniques to groundwater recharge investigations, J. Hydrol., 130, 201–229, 1992. Dincer, T., A. Al-Mugrin, and U. Zimmermann, Study of the infiltration and recharge through the sand dunes in arid zones with special reference to stable isotopes and thermonuclear tritium, J. Hydrol., 23, 79 –109, 1974. Edmunds, W. M., W. G. Darling, and D. G. Kinniburgh, Solute profile techniques for recharge estimation in semi-arid and arid terrain, in Estimation of Natural Groundwater Recharge, edited by I. Simmers, pp. 139 –157, D. Reidel, Norwell, Mass., 1988. Gardner, W. H., Water content, in Methods of Soil Analysis, vol. 1, Physical and Mineralogical Methods, Monogr., vol. 9, edited by A. Klute, pp. 493–545, Am. Soc. of Agron., Madison, Wis., 1986. Gardner, W. R., Water uptake and salt-distribution patterns in saline soils, paper presented at Symposium on the Use of Isotope and
Radiation Techniques in Soil Physics and Irrigation Studies, Int. At. Energy Agency, Istanbul, Spain, 1967. Gee, G. W., and J. W. Bauder, Particle-size analysis, in Methods of Soil Analysis, vol. 1, Physical and Mineralogical Methods, Monogr., vol. 9, edited by A. Klute, pp. 383– 410, Am. Soc. of Agron., Madison, Wis., 1986. Gee, G. W., M. D. Campbell, G. S. Campbell, and J. H. Campbell, Rapid measurement of low soil water potentials using a water activity meter, Soil Sci. Soc. Am. J., 56, 1068 –1070, 1992. Gee, G. W., P. J. Wierenga, B. J. Andraski, M. H. Young, M. J. Fayer, and M. L. Rockhold, Variations in water balance and recharge potential at three western desert sites, Soil Sci. Soc. Am. J., 58, 63–71, 1994. Gile, L. H., J. W. Hawley, and R. B. Grossman, Soils and Geomorphology in the Basin and Range Area of Southern New Mexico: Guidebook to the Desert Project, Mem. vol. 39, N. M. Bur. of Mines and Miner. Res., Scororro, N. M., 1981. Ingraham, N. L., and C. Shadel, A comparison of the toluene distillation and vacuum/heat methods for extracting soil water for stable isotopic analysis, J. Hydrol., 140, 371–387, 1992. International Atomic Energy Agency (IAEA), Isotope techniques in the hydrogeological assessment of potential sites for the disposal of high-level radioactive wastes, Tech. Rep. Ser. 228, chap. 7, pp. 57– 61, Vienna, Austria, 1983. Jackson, M. L. W., R. P. Langford, and M. J. Whitelaw, Basin-fill stratigraphy, Quaternary history, and paleomagnetics of the Eagle Flat study area, Southern Hudspeth County, Texas, final contract report prepared for the Texas Low-Level Radioactive Waste Disposal Authority, Bur. of Econ. Geol., Univ. of Texas at Austin, 1993. Larkin, T. J., and G. W. Bomar, Climatic atlas of Texas, Rep. LP-192, Tex. Dep. of Water Res., Austin, Texas, 1983. McNeill, J. D., Electromagnetic terrain conductivity measurement at low induction numbers, Tech. Note TN-6, Geonics Ltd., Mississauga, Ontario, Can., 1980. McNeill, J. D., Rapid, accurate mapping of soil salinity by electromagnetic ground conductivity meters, in Advances in Measurement of Soil Physical Properties: Bringing Theory Into Practice, edited by G. C. Topp and W. D. Reynolds, Soil Sci. Soc. Am. Spec. Publ., 30, 209 – 229, 1992. Murphy, E. M., T. R. Ginn, and J. L. Phillips, Geochemical estimates of recharge in the Pasco basin: Evaluation of the chloride mass balance technique, Water Resour. Res., 32, 2853–2868, 1996. Prudic, D. E., Estimates of Percolation Rates and Ages of Water in Unsaturated Sediments at Two Mojave Desert Sites, CaliforniaNevada, U.S. Geol. Surv. Water Resour. Invest. Rep., 1994. Prych, E. A., Using chloride and chlorine-36 as soil-water tracers to estimate deep percolation at selected locations on the U.S. Department of Energy Hanford site, Washington, U.S. Geol. Surv. Open File Rep., 94-514, 1995. Rhoades, J. D., P. A. C. Raats, and R. J. Prather, Effects of liquidphase electrical conductivity, water content, and surface conductivity on bulk soil electrical conductivity, Soil Sci. Soc. Am. J., 40, 651– 655, 1976. Rhoades, J. D., N. A. Manteghi, P. J. Shouse, and W. J. Alves, Soil electrical conductivity and soil salinity: New formulations and calibrations, Soil Sci. Soc. Am. J., 53, 433– 439, 1989. Scanlon, B. R., Moisture and solute flux along preferred pathways characterized by fissured sediments in desert soils, J. Contam. Hydrol., 10, 19 – 46, 1992. Scanlon, B. R., Water and heat fluxes in desert soils, 1, Field studies, Water Resour. Res., 30, 709 –719, 1994. Scanlon, B. R., and R. S. Goldsmith, Field study of spatial variability in unsaturated flow beneath and adjacent to playas, Water Resour. Res., 33, 2239 –2252, 1997. Scanlon, B. R., and P. C. D. Milly, Water and heat fluxes in desert soils, 2, Numerical simulations, Water Resour. Res., 30, 721–733, 1994. Scanlon, B. R., R. S. Goldsmith, and W. F. Mullican, Spatial variability in unsaturated flow beneath playa and adjacent interplaya settings and implications for contaminant transport, Southern High Plains, Texas, Rep. Inv. 243, 68 pp., Bur. of Econ. Geol., Univ. of Tex. at Austin, 1997a. Scanlon, B. R., R. S. Goldsmith, and J. G. Paine, Analysis of unsaturated flow beneath fissures in the Chihuahuan Desert, Texas, USA, J. Hydrol., 203, 58 –78, 1997b. Scanlon, B. R., R. S. Goldsmith, and R. S. Langford, Geomorphic controls on subsurface flow in an arid setting: Case study in the
SCANLON ET AL.: ARID GEOMORPHIC SETTINGS AND UNSATURATED FLOW Chihuahuan Desert, Texas, report of investigations, Bur. of Econ. Geol., Univ. of Tex. at Austin, in press, 1999. Stone, W. J., Natural recharge of the Ogallala aquifer through playas and other non-stream-channel settings, eastern New Mexico, in Geologic Framework and Regional Hydrology: Upper Cenozoic Blackwater Draw and Ogallala Formations, Great Plains, edited by T. C. Gustavson, pp. 180 –192, Bur. of Econ. Geol., Univ. of Tex. at Austin, 1990. Tyler, S. W., J. B. Chapman, S. H. Conrad, D. P. Hammermeister, D. O. Blout, J. J. Miller, M. J. Sully, and J. M. Ginanni, Soil-water flux in the southern Great Basin, United States: Temporal and spatial variations over the last 120,000 years, Water Resour. Res., 32, 1481–1499, 1996. Wood, W. W., and W. E. Sanford, Chemical and isotopic methods for
999
quantifying ground-water recharge in a regional, semiarid environment, Ground Water, 33, 458 – 468, 1995. R. S. Goldsmith and B. R. Scanlon, Bureau of Economic Geology, University of Texas at Austin, University Station, Box X, Austin, TX 78713-8924. (
[email protected]) R. P. Langford, Department of Geology, University of Texas at El Paso, El Paso, TX 79968.
(Received June 22, 1998; revised August 17, 1998; accepted August 19, 1998.)
1000