Relationship between hybrid performance and AFLP based genetic distance in highland maize inbred lines B. W. Legesse1, 2 , A. A. Myburg2, K. V. Pixley3, S. Twumasi-Afriyie4 and A. M. Botha2 (1) Ethiopian Agricultural Research Organization (EARO), P.O. Box 2003, Addis Ababa, Ethiopia (2) Department of Genetics & Forestry and Agricultural Biotechnology Institute (FABI), University of Pretoria, 0002 Pretoria, South Africa (3) CIMMYT, Int. Col, El Batan, Texcoco, Edo. De Mexico, C.P. 56130, Mexico (4) CIMMYT-Ethiopia, P.O.Box 5689, Addis Ababa, Ethiopia B. W. Legesse Email:
[email protected]
Abstract The objectives of this study were to determine the crossing performance of highland maize inbred lines for grain yield, days to silk and plant height; estimate genetic distance (GD) among the inbred lines and in association with tester parents, and to investigate the relationship of GD with hybrid performance and midparent heterosis (MPH). A total of 26 inbred lines were crossed with six (population and line) testers in a factorial-mating scheme. The F1’s and the parents were evaluated at five locations in Ethiopia. Nine amplified fragment length polymorphism (AFLP) primer pairs were used to genotype all the parents. The F1’s were found to vary widely for grain yield and other traits measured. Yield superiority of more than 30% over the best hybrid check was obtained for some testcross hybrids. Midparent heterosis on average was moderate for grain yield and, plant height. And for days to silking, MPH values were mostly negative. Mean GD values determined from the inbred lines by population tester (0.680) and line tester (0.661) combinations were not significantly different. Cluster analysis separated the tester parents from the corresponding inbred lines. AFLP grouping of the inbred lines was in agreement with their pedigree records. Genetic distances derived from the inbred lines × all testers and from the population testers’ sub-group were not positively correlated with hybrid performance and MPH for most traits. In contrast, correlations of GDs involving the line testers’ sub-group with F1’s and MPH were significantly positive but with low magnitude to be of predictive value. Abbreviations AFLP Amplified fragment length polymorphism - GD Genetic distance - MPH Midparent heterosis
Introduction Maize (Zea mays L.) is one of the important cereals broadly adapted worldwide. In Ethiopia, it is grown in the lowlands, the mid-altitudes and the highland regions. It is an important field crop in terms of area coverage, production and utilization for food and feed purposes. However, maize varieties mostly grown in the highlands (altitude = 1,700–2,400 masl.) of Ethiopia are local cultivars. They are low yielding, vulnerable to biotic and abiotic constraints and also exhibit undesirable agronomic performances such as late maturity and susceptibility to root and stalk lodging (EARO 2000). Enhancement of maize production and productivity can be achieved through identification of potentially superior inbred line combinations in the form of hybrids (Bernardo 1999; Saleh et al. 2002). In maize, hybrid breeding remains the method of choice for attaining maximum genetic gain from the effects of heterosis. Nevertheless, identification of parental inbred lines leading to superior hybrid combinations is a crucial factor (Hallauer et al. 1988). Such activities using conventional breeding methods are expensive and time consuming. Furthermore, the large number of possible hybrid combinations to be produced from a relatively small number of inbred lines, render the evaluation of all possible combinations unfeasible (Bernardo 1992; Betran et al. 2003). In addition, morphological markers have shortcomings to detect differences among closely related genotypes and are influenced by prevailing environmental conditions. The efficiency of hybrid breeding program could be increased if the inbred lines per se could be screened for genetic diversity using molecular markers and superior crosses are accurately predicted prior to field evaluation (Melchinger et al. 1991). Molecular markers are not influenced by environmental factors and are also fast, efficient and more sensitive than field testing to detect large numbers of distinct differences between genotypes at the DNA level (Melchinger 1999). However, one should not overlook the importance of field testing across years and locations to identify phynotypically desirable hybrid combinations. Molecular markers use to meet a number of objectives including genetic diversity analysis and prediction of hybrid performances in different crop species (Melchinger 1999). Currently several molecular marker techniques are available serving various purposes in crops. Amplified fragment length polymorphism (AFLP) is one of the wellknown molecular marker systems relying on polymerase chain reaction (PCR) technique (Mullis et al. 1986) for DNA amplification. It requires no prior sequence knowledge and can detect large number of genetic loci than restrict fragment length polymorphism (RFLP), random amplified polymorphic DNA (RAPD) and simple sequence repeats (SSR) markers (Pejic et al. 1998). On the other hand, single nucleotide polymorphism (SNP) markers have highly automated DNA scoring potential than AFLPs (SulimanPollatschek et al. 2002); however, they are expensive and demand high technology input and special instruments are required for many SNP genotyping technologies (Ching and Rafalski 2002). It is also known that the AFLP technique had lower cost and is more transferable across species than SSR markers (Garecia et al. 2004). In maize, AFLP
techniques have been applied to genome mapping (Ajmone-Marsan et al. 2001), DNA fingerprinting (Oliveira et al. 2004), genetic diversity studies (Garecia et al. 2004) and hybrid performance prediction (Sheng and Rui 2000; Barbosa et al. 2003). Previous studies conducted to assess genetic diversity and to predict hybrid performance in maize were mostly focused on temperate germplasm (Melchinger 1999). Using AFLP markers, some information on tropical maize germplasm is present but the genotypes studied were of lowland tropical origin (Sheng and Rui 2000; Barbosa et al. 2003; Garecia et al. 2004). No such information is available on tropical highland maize gerplasm serving breeding programs. The objectives of this study were to (1) estimate genetic distance (GD) values for AFLPs among highland maize inbred lines and in association with their tester parents, (2) determine the crossing performances of the inbred lines for grain yield, days to silk and plant height, and (3) investigate the relationship of GD with hybrid performance and heterosis for grain yield, days to silk and plant height.
Materials and methods Field evaluation The study materials involved 26 maize inbred lines derived from three different populations, 1) Kitale Synthetic II × N3-type inbred lines, 2) Ecuador-573 × SC-type inbred lines, and 3) Pool9A × IITA’s mid-altitude streak resistant population by the CIMMYT regional program in Zimbabwe. They were introduced to Ethiopia and selected for tolerance to common foliar diseases [northern leaf blight (NLB, caused by Exserohilum turcicum); common rust (Puccinia sorghi); and gray leaf spot (GLS, Cercospora zeae-maydis Tehon)], vigour and general adaptation to the highland regions (Twumasi-Afriyie 2001). The pedigree and genetic background of the study materials is given in Table 1. Table 1 Identification and pedigree of highland maize inbred lines and testers assayed for genetic distance using AFLP markers and evaluated for hybrid performances No Genotypes
Pegigree
Source
1
AMBOON6-1
KIT/SNSYN ((N3) TUXC1F1 # ## (GLS = 1) 6-1
CIMMYT
2
AMBOON6-4
KIT/SNSYN ((N3) TUXC1F1 # ## (GLS = 1) 14-1
CIMMYT
3
AMBOON6-8
KIT/SNSYN ((N3) TUXC1F1 # ## (GLS = 1) 7-3
CIMMYT
4
AMBOON6-9
KIT/SNSYN ((N3) TUXC1F1 # ## (GLS = 1) 11-1
CIMMYT
5
AMBOON6-14
KT/SNSYN ((N3) TUXC1F1 # ## (GLS = 1) CIMMYT 11-2
6
AMBOON6-15
KIT/SNSYN ((N3) TUXC1F1 # ##
CIMMYT
No Genotypes
Pegigree
Source
(GLS = 1) 14–2 7
AMBOON6-20
SRSYN95 ((KIT/N3) TUXF1 # ## (GLS = 1) CIMMYT 6–1
8
AMBOON6-21
ECU/SNSYN (SC/ETO) C1 F1 ### (GLS = 1.5) 16-1
CIMMYT
9
AMBOON6-22
ECU/SNSYN (SC/ETO) C1 F1 ### (GLS = 2.0)-3-1
CIMMYT
10 AMBOON6-23
ECU/SNSYN (SC/ETO) C1 F1 ### (GLS = 2.0)-8-2
CIMMYT
11 AMBOON6-25
ECU/SNSYN (SC/ETO) C1 F1 ## # (GLS = 2.5)-24-2
CIMMYT
12 AMBOON6-26
ECU/SNSYN (SC/ETO) C1 F1 ## # (GLS = 2.5)-42-3
CIMMYT
13 AMBOON6-27
ECU/SNSYN (SC/ETO) C1 F1 ## # (GLS = 3.0)-23-1
CIMMYT
14 AMBOON6-29
ECU/SNSYN (SC/ETO) C1 F1 ### (GLS = 3.5)-41-1
CIMMYT
15 AMBOON6-37
SRSYN95 ((ECU/SC/ETO) F1# # # (GLS = 3)-21-1
CIMMYT
16 AMBOON6-38
SRSYN95 ((ECU/SC/ETO) F1# # # (GLS = 3.5)-40-1
CIMMYT
17 AMBOON6-39
SRSYN95 ((ECU/SC/ETO) F1# ## (GLS = 3.5)-4-2
CIMMYT
18 AMBOON6-40
SRSYN95 ((ECU/SC/ETO) F1# # # (GLS = 3.5)-39.1
CIMMYT
19 AMBOON6-41
POOL9AC-7-SR (BC2) FS-1-1-3-1
CIMMYT
20 AMBOON6-42
POOL9AC-7-SR (BC2) FS-1-4-2-3
CIMMYT
21 AMBOON6-44
POOL9AC-7-SR (BC2) FS-4-3-SR-1-1
CIMMYT
22 AMBOON6-47
POOL9AC-7-SR (BC2) FS-50-1-2-3
CIMMYT
23 AMBOON6-49
POOL9AC-7-SR (BC2) FS-89-2SR-1-1
CIMMYT
24 AMBOON6-54
POOL9AC-7-SR (BC2) FS-170-2-1-3
CIMMYT
25 AMBOON6-59
POOL9AC-7-SR (BC2) FS-232-4-1-3
CIMMYT
26 AMBOON6-60
POOL9AC-7-SR (BC2) FS-48-1-1-3
CIMMYT
27
KITALE Syn II (Pop. tester)
Tuxpeò o derived germplasm
Kenya
28
ECUADOR 573(Pop. tester)
Montana race
Kenya
No Genotypes
Pegigree
Source
29 KULENI (Pop. tester)
Pool 9A
Ethiopia
142 B1-e (Inbred line tester)
Derived from Ecuador 573
Ethiopia
31 F7215 (Inbred line tester
Derived from Kitale Syn II)
Ethiopia
Derived from Poo9A
Ethiopia
30
32
POOL9A-MHM (Inbred tester)
The inbred lines were crossed with six local testers, three populations [Kitale Syn. II, Ecuador 573, and Kuleni (Pool9A)] and three inbred testers (142-1-e, F7215, Pool9AMHM); in a factorial mating design (Design II) that resulted in 156 F1 progenies. The 156 F1 crosses, plus two hybrid checks (BH540, BH660) and their 32 parents were evaluated in separate trials across wide range of environments representing mid-altitude and highland of Ethiopia namely: Ambo, Awassa, Bako, Holeta and Kulumsa in 2002. Awassa and Bako lie in the mid-altitudes, between 1,650 m and 1,700 m. above sea level and receive 1,250 and 1,110 mm annual rainfall, respectively. Ambo, Kulumsa and Holeta are found in the highland ranging from 2,200 m to 2,400 m above sea level. The average annual rainfall at Ambo, Holeta and Kulumsa are 1,115, 1,250 and 830 mm, respectively. The soil at Awassa and Kulumsa is andosol and at Bako it is characterized as nitosol, and at Ambo and Holeta the dominant soil type is vertisol. The experimental design was an alpha (0, 1) lattice (Patterson and Williams 1976) with two replications at each location. The trials of parental inbred lines were grown directly adjacent to the F1 progenies. The experimental unit consisted of a single five-metre long row with 75 cm spacing between rows. Planting was done using two seeds per hill and 25 cm apart between hills. Thinning was performed at the three to five leaf stages to attain a final plant density of 53,000 plants ha−1. All other management practices including planting, fertilization, weeding and harvestings were performed as per the recommendations for each location. Grain yield (Mg ha−1) adjusted to 12.5% moisture, numbers of days to silking (days) and plant height (cm) were recorded on a per plot basis. DNA extraction and AFLP analysis For AFLP analysis, leaf tissue from each genotype was harvested from 3 to 4-week-old seedlings grown in the greenhouse at the University of Pretoria, South Africa. Genomic DNA for each inbred line was isolated from the leaf tissue following Hexadecyltrimethyl-ammonium bromide (CTAB) DNA extraction procedure (Doyle and Doyle 1987). AFLP reactions were performed according to the protocol of Vos et al. (1995) except that in selective amplification, EcoRI primers were 5′ labelled with infrared dye (IRDye 700 or IRDye 800, LI-COR, Lincoln, NE, USA). The reactions were performed in 11 μl volumes containing 5 μl diluted pre-selective amplification reaction product, 10 × PCR buffer (1.5 mM Mg Cl2), 2.5 mM of each dNTP, 0.5 mM MgCl2, 1 μM IRDye 700/800-labelled EcoRI primers, 10 μM MseI primer, and 5 U Ampli-Taq DNA polymerase (Promega).
Electrophoresis and image analysis AFLP fragments were resolved in polyacrylamide gels containing 8% Long Ranger gel solution (BMA, Rockland, ME, USA), 7.0 M urea and 0.8 × TBE (71.2 mM Tris, 71.2 mM boric acid, and 1.6 mM EDTA) using LI-COR IR2 automated DNA analysers (LI-COR, Lincoln, NE USA). The gel images were scored in a binary system that recorded the presence of band as plus (+) and absence of band as minus (−). Semiautomated scoring was performed with the SAGAMX software (Version 3.2, LI-COR). Scores were manually edited to make corrections to the automated score where necessary. Data analysis The data matrix was used to perform cluster analysis on the basis of average linkage method, known as the Unweighted Pair Group Method using Arithmetic averages (UPGMA) as applied in NCSS software package (Hintze 1998). The average polymorphic information content (PIC) was calculated across each primer combination according to Riek et al. (2001). Estimates of genetic similarity between pairs of inbred lines and in association with each tester genotype were calculated in the form of dissimilarity and expressed as Euclidean GD. The “goodness of fit” of the clustering algorithm to the data matrix was determined by calculating the cophenetic correlation coefficient between the dissimilarity matrix and the cophenetic matrix derived from the dendrogram (Sneath and Sokal 1973). Analyses of variances (ANOVA) were performed for grain yield, days to sliking and plant height on data collected from the F1s and the parental trials at each location and across locations. (Agrobase 2001). Midparent heterosis (MPH) manifested in the hybrids for all the traits were computed (Betran et al. 2003). Simple correlation coefficients were calculated for AFLP GD of various groupings, all testers, population testers and inbred testers with their respective F1s and MPH values determined for each trait.
Results Hybrid performance and heterosis In maize, promising hybrid varieties express desirable mean performances for yield and other agronomic attributes. The magnitude of heterosis manifested by such hybrids is also of interest in a breeding program. The means and ranges of hybrid performances and MPH determined for all traits are presented in Tables 2 and 3. Grain yield of all F1s ranged from 5.2 (AMBOON6-22 × Kuleni) to 11.6 Mg ha−1 (AMBOON6-20 × 142-1-e) with an overall mean of 7.6 Mg ha−1. Mean yield of F1s resulted from crosses of population testers and inbred line testers, varied between 7.4 Mg ha−1 and 7.9 Mg ha−1, respectively. Mean yield of F1s resulted from inbred line tester combinations differed significantly ranging from 7.1 Mg ha−1 to 9.1 Mg ha−1, and among population testers the value ranged between 7.3 Mg ha−1 and 7.8 Mg ha−1 (Table 2).
Table 2 Mean and ranges of hybrid performances for grain yield (Mg ha− 1), days to silking (days) and plant height (cm) for all testers, population testers, line testers and individual tester crosses Days to silking
Plant height
Range
Mean (SE)
Range
Mean (SE)
Range
All male × Femalea 156 7.6 (0.1)
5.2– 11.6
85.6 (0.2)
81.1– 91.5
245.0 (1.2)
213.2– 294.6
Pop. Tester crossesb 78 7.4 (0.1)
5.2–9.4 84.6 (02)
81.1– 89.5
241.4 (1.3)
218.5– 274.2
Line Tester crossesc 78 7.9 (0.1)
5.3– 11.6
86.7 (0.2)
82.7– 91.5
248.7 (2.0)
213.2– 294.6
Kit. Syn.II × Femaled
26 7.3 (0.1)
5.5–8.3 84.3 (0.3)
81.1– 87.2
239.1 (2.2)
220.2– 257.9
Ecud. 573 × Femaled
26 7.8 (0.2)
6.4–9.4 84.7 (0.3)
82.0– 88.0
242.2 (2.3)
223.0– 274.2
Kuleni × Femaled
26 7.3 (0.2)
5.2–8.8 84.6 (0.4)
81.9– 89.5
242.9 (2.3)
218.5– 270.1
I42-1-e × Femalee
26 9.1 (0.2)
7.2– 11.6
87.9 (0.3)
85.4– 91.5
266.6 (2.6)
246.5– 294.6
F7215 × Femalee
26 7.4 (0.1)
5.3–8.6 86.4 (0.4)
82.7– 89.5
246.4 (2.1)
226.7– 269.4
232.7 (2.0)
213.2– 257.0
Cross combinations
Grain yield No. Mean (SE)
82.5– 89.6 a all inbred lines (female) × all line and population testers (male) b all inbred lines (female) × all population testers c all inbred lines (female) × all line testers d all inbred lines (female) × a population tester e all inbred lines (female) × a line tester P9a-mhm × Femalee 26 7.1 (0.1)
5.7–8.4 85.9 (0.4
Table 3 Mean and range of midparent heterosis (MPH) for grain yield, days to silking and plant height for all testers, population testers, line testers and individual tester crosses Grain yield (MPH Days to silking %) (MPH %)
Plant height (MPH%)
Mean (SE)
Range
Mean (SE) Range
Mean (SE)
Range
28.3 (2.6)
−24.2– 121.7
−3.1(0.2)
−9.8–4.2
27.7 (0.7)
10.6– 55.0
−24.2– 44.2
−0.7 (0.3)
−5.7–4.2
24.0 (0.8)
10.6– 43.0
51.0 (3.2)
10.9– 121.7
−5.5 (0.2)
−9.8–0.3
31.4 (0.9)
16.2– 55.0
Kit. Syn.II × Femalea
26 0.9 (2.0)
−16.1– 23.3
0.8 (0.4)
−5.3–2.4
26.4 (1.3)
14.1– 36.3
Ecud. 573 × Femaleb
26 6.4 (2.4)
−24.2– 33.2
−8.0 (0.6)
−5.7–4.2
21.2 (1.1)
10.6– 33.7
Kuleni × Female
26 9.8 (3.1)
−17.1– 44.2
−0.4 (0.4)
−3.7–3.1
24.4 (1.5)
10.6– 43.0
I42-1-e × Female
26
77.2 (5.2)
21.5– 121.7
-6.1 (0.4)
−8.8–1.6
31.1 (1.3)
17.8– 43.7
F7215 × Female
26
33.7 (2.9)
10.9–59.0 −5.2 (0.3)
−7.6–1.0
25.1 (1.0)
16.2– 35.2
Cross combinations
No
All male × Female 156
Pop. Tester crosses 78 5.7 (1.5) Line Tester crosses 78
P9a41.9 37.8 25.2– 26 11.3–82.7 −5.3 (0.4) −9.8–0.3 mhm × Femalec (4.7) (1.5) 54.9 a Kitale Synthetic II b Ecuador 573 c Pool9a-HMH Midparent heterosis determined for grain yield across all F1 hybrid crosses ranged from 24.2% to 121.7%. Significantly different average F1 yield heterosis between crosses of population testers (5.7%) and line testers (51.0%) were determined. Such differences were profoundly greater when considering values determined for crosses of each individual tester; MPH varied between 0.9% (Kitale Syn. II) and 77.2% (142-1-e) (Table 3). Mean performance of days to silking for all F1s differed from 81.1 to 91.5 days across locations (Table 2). Plant height ranged from 213.2 cm to 294.6 cm between the shortest and the tallest hybrids. Non-significant mean F1 values for days to silking and plant height across all tester parents were recorded. Midparent heterosis averaged for days to silkings were low and mostly negative for all F1s (Table 3). Estimates of MPH for plant height was moderate and ranged from 10.6% (AMBOON6-38 × Ecuador 573) to 55.0% (AMBOON6-22 × Pool9A-MHM) across F1s and locations.
The performances of six highest yielding crosses relative to the two hybrid checks (BH660 and BH540), three-way and single cross commercial maize hybrids widely produced in the mid-altitude and highland-transition zones in Ethiopia, are summarized in Table 4. Yield superiority of the inbred line crosses (single crosses) ranged from 14.0% to 36.5% over the two hybrid checks (Table 4). The checks, in spite of their differences in genetic compositions, did not differ for grain yield, however, BH660 is relatively taller and later maturing compared to the best crosses. Table 4 Grain yield, yield heterosis (MPH), days to silking (days) and plant height of best line × tester crosses evaluated across four locations in Ethiopia in 2002 Grain yield Crosses
Difference % Checka
Days to silking
Plant height (cm)
Mg ha−1
MPH %
10.4
94.9**b 122.3
120.9
88.0
261.4
AMBOON6-8 x14210.0 1-e
104.8** 117.6
116.3
85.6
273.1
AMBOON6-15 × 142-1-e
10.4
97.3**
122.3
120.9
85.6
284.4
AMBOON6-20 × 142-1-e
11.6
83.3**
136.4
136.5
88.0
267.4
AMBOON6-39 × 142-1-e
9.8
121.7** 115.3
114.0
89.3
268.0
AMBOON6-41 × 142-1-e
10.2
95.0**
120.0
118.6
86.0
294.6
BH660 (Check1)
8.5
_
100
90.5
293.0
BH540 (Check2)
8.6
_
_
85.2
259.0
AMBOON6-4 × 142-1-e
Check1
Check2
100
S.Ec 1.0 _ _ 2.3 a percentage differences of the crosses over two hybrid checks b highly significant difference at ≤0.01 probability levels c standard error
15.3
Molecular polymorphism and Genetic distance AFLP analysis of 32 parental genotypes produced a total of 601 bands, of which 80.5% were polymorphic. Polymorphism ranging from 42 (AGG/CGA) to 66 (ACA/CCC) bands with mean of 50 was detected across nine primer combinations. Polymorphic information content values ranged from 0.25 to 0.40 (Table 5). Genetic distance calculated in terms of dissimilarity for all possible combinations among 32 genotypes ranged from 0.40 to 0.72 with an average of 0.59 units. Genetic distance estimates for the
26 female and six male parent combinations varied from 0.63 to 0.72 with a mean of 0.67. With further sub-groupings of the pairwise combinations into population testers and line testers, mean GD values for population tester and line tester combinations were 0.68 and 0.66, respectively (Table 6). Cluster analysis provided a fairly good resolution of the inbred lines from the tester parents. The inbred lines clustered into three groups, reflecting available pedigree records. The testers were distinctly separated among each other in the dendrogram as it is expected based on their genetic backgrounds (Fig. 1). The dendrogram constructed based on the AFLP data matrix demonstrated a high cophenetic correlation coefficient (0.88), and therefore, showed an excellent fit with the GD values. Table 5 Number of scored bands, degree of polymorphism and Polymorphic Information Content (PIC) for nine AFLP primer combinations applied to 26 female lines, six male lines and population parents Primer pairsa
No. of bands Polymorphic bands Polymorphism % PIC
AAC/CGG (800) 63
51
80.9
0.30
ACA/CAC (700) 74
59
79.7
0.35
ACA/CCC (700) 81
66
81.5
0.34
ACA/CTG (700) 73
60
82.2
0.40
ACG/CCG (700) 62
48
77.4
0.32
AGG/CAG (800) 57
45
78.9
0.31
AGG/CGA (800) 53
42
79.2
0.34
AGG/CAC (800) 78
64
84.6
0.37
AGG/CCC (800) 60
48
80.0
0.25
Total
483
601
Mean 66.8 53.8 80.5 0.33 a Selective nucleotides of EcoRI/MseI adapter primers and IRD 700 or IRD 800 labelled primers
Table 6 Mean minimum, maximum and standard deviation (SD) of Euclidean based genetic distance coefficients between male parents and female lines calculated from AFLP data of nine primer combinations Cross combinations Type
Number of pairs
All genotypes
Genetic distance Mean (SE)
Minimum Maximum SD
496
0.594 (0.003)
0.410
0.722
0.061
All male × Female
156
0.671 (0.001)
0.625
0.723
0.020
Pop. Tester crosses
78
0.680 (0.002)
0.631
0.723
0.018
Line Tester crosses
78
0.661 (0.001)
0.625
0.697
0.016
Kit. Syn.II × Female
26
0.676 (0.003)
0.645
0.708
0.016
Ecud. 573 × Female
26
0.693 (0.003)
0.667
0.723
0.018
Kuleni × Female
26
0.672 (0.003)
0.631
0.706
0.016
I42-1-e × Female
26
0.671 (0.003)
0.647
0.698
0.014
F7215 × Female
26
0.651 (0.002)
0.625
0.673
0.013
P9a-mhm × Female
26
0.660 (0.002)
0.631
0.679
0.023
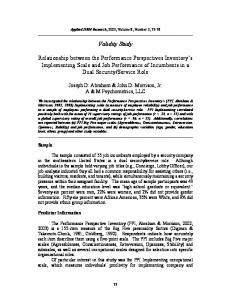
Fig. 1 Dendrogram derived using UPGMA cluster analysis based on genetic distance data of 32 maize inbred lines and populations. I, II, III, IV & V indicate major cluster groups Relationship of hybrid performance and heterosis with genetic distance Associations between GDs of the inbred lines × all tester parents with the F1s and MPH for grain yield and plant height were significantly negative in most cases. Significantly positive association between GDs and F1 performances for days to silking was determined. Associations between GDs of population testers sub-group and the respective F1 performances and MPH for grain yield and plant height were mostly negative. In contrast, correlations between GDs of inbred line tester sub-group with F1 performances and MPH were mostly significant for each trait (Table 7).
Table 7 Simple correlation of genetic distance with grain yields, days to flowering and plant height
Crosses
Grain yield No Performanc MPH+ e
Days to silking
Plant height
Performanc MPH e
Performanc MPH e
All 15 0.031 male × Femal 6 e
−0.225* −0.037 *
0.340* −0.290** *
−0.239* *
Pop. Tester crosses
−0.650
−0.028 −0.031
−0.270*
78 0.045
0.210*
Line Tester 78 0.276** 0.363** 0.343** −0.064 0.229* 0.199* crosses *, ** Significantly different from zero at the 0.05 and 0.01 level of probability, respectively + Midparent heterosis
Discussion In maize, breeding for hybrid varieties is a well-recognized approach for yield increment through the exploitation of heterosis. The role of genetically divergent germplasm is of primary importance for these phenomena to occur. The wide range of average grain yield performance between the lowest and the highest yielding hybrids in this study could be explored based on the genetic divergence of the parental genotypes and the role of dominant favourable gene effects that may be cumulated in the hybrids. (Hallauer et al. 1988). The parents of the lowest yielding hybrid (topcross) were known to have some degree of genetic relatedness, since both have Ecuador 573 background in their pedigree. In turn, the parents of the highest yielding hybrid (single cross) also differ to each other in their genetic background, hence indicating occurrence of heterotic pattern between the two genotypes. Such phenomena have been reported repeatedly in maize that the more parents are genetically unrelated the better will be their crossing performance (Hallauer et al. 1988; Ordas 1991; Saleh et al. 2002), however, there will be exceptions due to mutually exclusive adaptation problems (Moll et al. 1965). In addition, performance of grain yield in maize hybrids is the cumulative contribution of favourable dominant gene effects; nonetheless, the role of additive and epistasis gene action is not ruled-out (Arunachalam et al. 1984). Consequently, single crosses, unlike topcross hybrids, commonly give higher yields due to homozygousity advantages of their parents and the interaction of the gene in favour of cumulative dominant alleles useful for the expression of heterosis (Hallauer et al. 1988; Falconer and Mackay 1996). The level of heterosis in the study showed variation from trait to trait and from population crosses to inbred line crosses. On the average, grain yield manifested the
highest MPH, which is consistent with other reports in maize (Legesse 1994; Saleh et al. 2002). Higher level of mean yield heterosis was shown for crosses with line testers than with population testers, indicating preponderance of dominance gene dispersion in the genomes of the parental inbred lines (Falconer and Mackay 1996). The negative heterosis revealed by days to flowering suggests the effects of dominance gene action for earliness in a desirable direction. The range of pairwise GDs determined for the inbred lines by all testers (26 × 6) were found narrow relative to the values determined for all possible combinations among the 32 parental genotypes (Table 6). However, higher mean GD value was determined for the inbred line × tester combinations (0.671) relative to the value (0.594) determined for all pairs of parents inclusive. On the other hand, mean GDs of population tester combinations (0.680) were slightly larger than the values of inbred line tester sub-group (0.661). This was consistently observed while considering the pairwise GD values determined for each tester combinations (Table 6). Such difference is to be expected between crosses of population testers and inbred line testers. Because populations commonly possess broader genetic bases than inbred lines, and hence exhibit larger genetic differences (Dubreuil and Charcosset 1999). However, the female inbred lines were not completely homozygous, but in the S4 inbreeding stages, which eventually influenced the mean GD values of the two groups to become very close to each other due to residual heterozygosity effects. The negative associations of GDs with hybrid performance, and MPH for grain yield and plant height in reference to all the tester combinations and with a sub-group of population testers, imply little importance for prediction of hybrid performance. In contrast, the significantly positive correlations manifested between GDs and hybrid performance, GDs and MPH for most of the traits in reference to line tester combinations (Table 7) is good evidence to the hypothesis suggested by Bernardo (1992) who indicated the importance of strong dominance effects for effective prediction of hybrid performance using molecular markers. However, the magnitude of correlation coefficients determined between GDs of line tester combinations with F1 yield and yield MPH in this study was not large enough; therefore, it is of less utility for the perdition of hybrid performance. Similar results were reported by a number of investigators with different types of crops including maize (Boppenmaier et al. 1992; Martin et al. 1995; Xu et al. 2002; Barbosa et al. 2003; Oliveira et al. 2004). A number of possible reasons could be enumerated for weak correlations of GD predicted by molecular markers versus hybrid performance and heterosis. These include lack of linkage between genes controlling the traits measured, unequal genome coverage, random marker distribution and diversified effect of dominance (Charcosset et al. 1991; Bernardo 1992). Effective prediction of hybrid performance using molecular marker as suggested by Bernardo (1992) would be only feasible when a significant portion (50%) of the selected markers are linked with quantitative trait loci (QTL). Other more recent strategies for predicting hybrid performances, based on best linear unbiased prediction (BLUP) (Bernardo 1994), and based on the principle that two hybrids with parents similar at the marker level, should display similar specific combining ability (SCA)
values (Charcosset et al. 1998) especially for unrelated inbred lines, were suggested. Moreover, Vuylsteke et al. (2000) proposed a novel approach relying on AFLP markers, hybrid performance and SCA across a set of hybrids. The efficiency of this method may be enhanced by detection of more marker alleles tightly linked to specific QTL and yield data of hybrids, available from multiple trials carried out across different locations and years (Vuylsteke et al. 2000). Molecular markers generally are claimed to be more efficient and accurate than morphological markers to identify and to generate variability. However, the final and more applied aspect of genetic variation is to maximize the efficiency of using genetic variation to develop improved composites and hybrids. Efficiently capitalizing on the use of genetic variation continues to be an enormous challenge. Genetic variability is created and/or identified, but that is not an end by itself in the course of cultivar development. The remaining challenge lies on plant breeders to separate the desirable variability from undesirable. Such activities involve testing of new combinations across years and locations to rigorously select and identify high yielding and stable cultivars (Lee 1995; Gepts 2002). The process all together indicates coherency between molecular markers and classical plant breeding in accelerating crop improvement activities. Overall, the inbred line crosses (single crosses) showed yield performance as high as 11.5. Mg ha−1. Yield superiority of top single crosses (15–36%) over the best commercial hybrid check is a promising indication deserving close attention in the breeding program. Value of mean grain yield MPH determined for the single cross hybrids was relatively larger than the value determined for the topcross hybrids. Negative heterosis manifested for days to silking implies favourable dominant gene effects to breed for earliness. AFLP clustering of the inbred lines into different groups are in agreement with their pedigree records indicating the effectiveness of AFLP marker for diversity analysis and heterotic groupings. The relationships between GDs of population tester combinations with their corresponding F1 grain yield; plant height and MPH were negatively correlated. On the contrary, GDs of inbred line tester combinations showed positive and significant correlation coefficients with F1 performances and MPH for most traits but with low magnitude to warrant prediction of hybrid performance.
References Agrobase (2001) Agrobase generation II. User’s manual. Agronomix Softare, Inc, 171 Waterloo St. Canada Ajmone-Marsan P, Gorni C, Chitto A, Redaelli R, van Vijk R, Stam P, Motto M (2001) Identification of QTL for grain yield and grain related trait of maize (Zea mays L.) using an AFLP map, different testers and cofactor analysis. Theor Appl Genet 102:230–243
Arunachalam V, Bandyopadhyay A, Nigma SN, Gibbons RW (1984) Heterosis in relation to genetic divergence and specific combining ability in groundnut (Arachis hypogaea L). Euphytica 33:33–39 Barbosa AMM, Geraldi IO, Benchimol LL, Garcia AAF, de Souza AP (2003) Relationship of intera and inter-population tropical maize single cross hybrid performance and genetic distances computed from AFLP and SSR. Euphytica 130:87–99 Bernardo R (1992) Relationships between single-cross performance and molecular markers heterozygosity. Theor Appl Genet 83:6286–6234 Bernardo R (1994) Prediction of maize single-cross performance using RFLPs and information from related hybrids. Crop Sci 34:20–25 Bernardo R (1999) Best linear unbiased predictor Analysis. In: Coors JG, Pandey S (eds) Genetic and exploitation of heterosis in crops. ASA, CSSA, SSSA, Madison, Wisconsin, USA, pp 269–276 Betran FJ, Ribaut JM, Beck D, de Leon DG (2003) Genetic diversity, specific combining ability, and heterosis in tropical maize under stress and nonstress environment. Crop Sci 43:797–806 Boppenmaier J, Melchinger AE, Brunklaus-Jung E, Geiger HH, Herrmann RG (1992) Genetic diversity for RFLP in European Maize inbreds: I. Relation to performance of Flint × Dent crosses for forage traits. Crop Sci 32:895–902 Charcosset A, Lefort-buson MM, Gallais A (1991) Relationship between heterosis and heterozygosity at marker loci: a theoretical computation. Theor Appl Genet 81:571–575 Charcosset A, Bonnisseau B, Touchebeuf O, Burstin J, Dubreuil P, Dubreuil Y, Barrière Y, Gallais A, Denis J-B (1998) Prediction of maize hybrid silage performance using marker data: comparison of several models for specific combining ability. Crop Sci 38:38–44 Ching ADA, Rafalski A (2002) Rapid genetic mapping of ESTs using SNP pyrosequence and indle analysis. Cell Mol Biol Lett 7:803–810 Doyle JJ, Doyle JL (1987) Genomic plant DNA preparation from fresh tissue—the CTAB method. Pytochem Bull 19:11
Dubreuil P, Charcosset A (1999) Relationships among maize inbred lines and populations from European and North American as estimated using RFLP markers. Theor Appl Genet 99:473–480 EARO (2000) Research strategy for maize. Ethiopian Agricultural Research organization (EARO), Addis Ababa, Ethiopia Falconer DS, Mackay LFC (1996) Introduction to quantitative genetics, 4th edn. Longman, Essex, England Garecia AAF, Benchimol LL, Barbosa AAM, Geraldi IO, Souza CL Jr, de Souza AP (2004) Comparison of RAPD, RFLP, AFLP and SSR markers for diversity studies in tropical maize inbred lines. Genet Mol Biol 27:579–588 Gepts P (2002) A comparison between crop domestication, classical plant breeding and genetic engineering. Crop Sci 42:1780–1790 Hallauer AR, Russell WA, Lamkey KR (1988) Corn breeding. In: Sprague GF, Dudley JW (eds) Corn and corn improvement. Am Soc Agron, Madison, USA, pp 463–564 Hintze JL (1998) NCSS (2000) Statistical system for windows. Number Cruncher Statistical Systems, Kaysville, Utah Lee M (1995) DNA marker and plant breeding programs. Adv Agron 35:265–344 Legesse WB (1994) Genetic component of yield and other desirable traits in Kitale maize composite-C. Master of Agriculture Science thesis. Alemaya University of Agriculture, Alemaya, Ethiopia Martin JM, Talbert LE, Lanning SP, Blanke NK (1995) Hybrid performance in wheat as related to parental diversity. Crop Sci 35:104–108 Melchinger AE, Messer MM, Lee M, Woodman WL, Lamkey KR (1991) Diversity and relationships among U.S. maize inbreds revealed by restriction fragment length polymorphisms. Crop Sci 31:669–678 Melchinger AE (1999) Genetic diversity and heterosis. In: Coors JG, Pandey S (eds) Genetic and exploitation of heterosis in crops. ASA, CSSA, SSSA, Madison, Wisconsin, USA, pp 269–276
Moll RH, Lonnquist JH, Furtuna JV, Johnson EC (1965) The relationship of heterosis and genetic divergence in maize. Genetics 52:139–144
Mullis K, Faloona F, Saike R, Horn G, Erlich H (1986) Enzymatic amplification of DNA in vitro: the polymerase enzyme chain reaction. Cold Spring Harbor Symp Quant Biol 51(Pt 1):263–273 Oliveira KM, Laborda RP, Garcia AAF, Paterniani MEAGZ, de Souza AP (2004) Evaluating genetic relationships between tropical maize inbred lines by means of AFLP profiling. Hereditas 140:24–33 Ordas A (1991) Heterosis in crosses between American and Spanish population of maize. Crop Sci 31:931–935 Patterson HD, Williams ER (1976) A new class resolvable incomplete block designs. Biometrika 63:83–92 Pejic I, Ajmon-Marson P, Morgante M, Kozumplick P, Castiglioni G, Tarmino G, Motto M (1998) Comparative analysis of genetic similarity among maize inbred line detected by RFLPs, RAPDs, and AFLPs. Theor Appl Genet 97:1248–1255 Riek JD, Calsyn E, Everaet I, van Bockstaele E, Loose MD (2001) AFLP based alternative for the assessment of distinctness, uniformity and stability of beet varieties. Theor Appl Genet 103:1254–1265 Saleh G, Abdullah D, Anuar AR (2002) Performance, heterosis and habitability in selected tropical maize single, double and three-way cross hybrids. J Agri Sci 2002:21– 28 Sheng WM, Rui DJ (2000) Use of AFLP markers to predict hybrid yield and yield heterosis in maize. Acta Bio Sci 42:600–604 Sneath PHA, Sokal RR (1973) Numerical taxonomy. WH Freeman, San Francisco Suliman-Pollatschek S, Kashkush K, Shats H, Hillel J, Lavi U (2002) Generation and mapping of AFLP, SSRs and SNPs in Lycopersicon esculentum. Cell Mol Biol Lett 7:583–579 Twumasi-Afriyie, S, Habtamu Z, Kassa Y, Bayisa A, Sewagegne T (2001) Development and improvement of highland maize in Ethiopia. Enhancing the Contribution of maize to
food security in Ethiopia. Proceedings of the Second National maize Workshop of Ethiopia. 12–16 November 2001, Addis Ababa, Ethiopia, pp 31–38 Vos P, Hogers R, Bleeker M, Reijans M, Lee TVD, Hornes M, Frijters A, Pot J, Peleman J, Kulper M, Zabeau M (1995) AFLP: a new technique for DNA finger printing. Nucleic Acids Res 23:4007–4414 Vuylsteke M, Kuiper M, Stam P (2000) Chromosomal regions involved in hybrid performance and heterosis: their AFLP®-based identification and practical use in prediction model. Heredity 85:208–218 Xu W, Virmani SS, Hernandez JE, Sebastian LS, Redoòa ED, Li Z (2002) Genetic diversity in the tropical lines and heterosis of the tropical rice hybrids. Euphytica 127:139–48