Journal of Operations Management 19 (2001) 675–694
Relationships between implementation of TQM, JIT, and TPM and manufacturing performance Kristy O. Cua a,1 , Kathleen E. McKone a,∗ , Roger G. Schroeder b b
a Babson College, Babson Park, MA 02457, USA Operations and Management Science Department, Donaldson Chair in Operations Management, Carlson School of Management, University of Minnesota, 321, 19th Avenue South, Minneapolis, MN 55455, USA
Received 26 January 2001; accepted 20 June 2001
Abstract Research on Total Quality Management (TQM), Just-in-Time (JIT) and Total Productive Maintenance (TPM) generally investigates the implementation and impact of these manufacturing programs in isolation. However, many researchers believe and argue conceptually the value of understanding the joint implementation and effect of manufacturing programs. This study investigates the practices of the three programs simultaneously. We find that there is evidence supporting the compatibility of the practices in these programs and that manufacturing performance is associated with the level of implementation of both socially- and technically-oriented practices of the three programs. © 2001 Elsevier Science B.V. All rights reserved. Keywords: Empirical research; Just-in-Time; Maintenance; Quality
1. Introduction Since the 1980s there has been an increasing awareness and implementation of practices associated with Total Quality Management (TQM), Just-in-Time (JIT), and Total Productive Maintenance (TPM). Nevertheless, there has not been a careful examination of the common and unique practices associated with these programs. We develop a framework for TQM, JIT and TPM and examine the relationships between the use of these practices and manufacturing performance. TQM, JIT and TPM have similar fundamental goals of continuous improvement and waste reduction (Schonberger, 1986; Nakajima, 1988; Ohno, 1988; ∗ Corresponding author. Tel.: +1-781-239-4245; fax: +1-781-239-5272. E-mail address:
[email protected] (K.E. McKone). 1 Deceased.
Powell, 1995). Together the practices of TQM, JIT, and TPM form a comprehensive and consistent set of manufacturing practices directed towards improved performance. Therefore, manufacturing plants are likely to combine the implementation of TQM, JIT, and TPM practices. However, most of the studies on TQM, JIT, and TPM investigate these programs separately. Only a few studies have tried to explore the relationship between TQM and JIT empirically (e.g. Flynn et al., 1995; Sriparavastu and Gupta, 1997). Also, some studies indirectly consider all three programs while focusing on only one of them. For example, McKone et al. (2001) indirectly examines the relationship of TPM with JIT and TQM when investigating the implementation and impact of TPM. They find that TPM has a positive and significant direct relationship as well as an indirect relationship through JIT with low cost, high levels of quality and strong delivery performance.
0272-6963/01/$ – see front matter © 2001 Elsevier Science B.V. All rights reserved. PII: S 0 2 7 2 - 6 9 6 3 ( 0 1 ) 0 0 0 6 6 - 3
676
K.O. Cua et al. / Journal of Operations Management 19 (2001) 675–694
On the other hand, many researchers believe and argue conceptually the value of understanding the simultaneous use of different manufacturing programs. For instance, Roth and Miller (1992) contend that maintenance management may well be the biggest challenge facing companies that implement TQM, JIT, and computer-aided manufacturing. Similarly, Huang (1991) discusses the importance of considering the integration of JIT, TPM, quality control, and factory automation with worker participation. Furthermore, Imai (1998) believes that TQM and TPM are the two pillars supporting the JIT production system. The conceptual research cited above provides evidence of a renewed interest in the study of manufacturing programs with an emphasis on their simultaneous investigation. While researchers recognize the value of investigating interrelated entities simultaneously, there is no study that provides empirical examination of the joint implementation of TQM, JIT, and TPM practices. Therefore, in this research we seek to examine these manufacturing practices within a single theoretical framework. Our goal is to identify the differences between high and low performing manufacturing plants with respect to their implementation of TQM, JIT, and TPM practices. In the next section of this paper, we review the literature and present our integrating framework. Then in Section 3 we discuss our hypotheses. In Section 4, we describe the data used for the analysis. Subsequently, we describe our method of analysis in Section 5. Finally, we discuss the results and present the conclusions in Sections 6 and 7, respectively.
2. Review of literature We considered the entire literature on TQM, JIT and TPM but, for brevity of discussion, we focus only on empirical work in this paper. The empirical studies that we draw upon are studies in the last 10 years that have sufficient grounding in the literature and assessment of measurement used in empirical analysis. We consider the research on TQM, JIT, and TPM and develop a single framework for the practices. See Cua (2000) for additional details on this framework and a thorough analysis of the practices associated with TQM, JIT and TPM discussed below.
TQM is a manufacturing program aimed at continuously improving and sustaining quality products and processes by capitalizing on the involvement of management, workforce, suppliers, and customers, in order to meet or exceed customer expectations (Dean and Bowen, 1994; Hackman and Wageman, 1995; Powell, 1995). A comparison of the practices of TQM discussed in six empirical studies (Saraph et al., 1989; Flynn et al., 1994; Powell, 1995; Ahire et al., 1996; Black and Porter, 1996; Samson and Terziovski, 1999) leads to the identification of nine practices that are commonly cited as part of a TQM program. These practices are cross-functional product design, process management, supplier quality management, customer involvement, information and feedback, committed leadership, strategic planning, cross-functional training, and employee involvement. In the literature, quality management frameworks typically stress the importance of cross-functional product design and systematic process management. Furthermore, they emphasize the involvement of customers, suppliers and employees to insure quality products and processes. Finally, quality management programs all emphasize the importance of management commitment and a well-established strategy. JIT is a manufacturing program with the primary goal of continuously reducing and ultimately eliminating all forms of waste (Sugimori et al., 1977; Ohno, 1988; Brown and Mitchell, 1991) through JIT production and involvement of the work force (Schonberger, 1986, 1996; Ohno, 1988). A comparison of six recent empirical studies on JIT (Davy et al., 1992; Mehra and Inman, 1992; Sakakibara et al., 1993; McLachlin, 1997; Sakakibara et al., 1997; Ahmad, 1998) leads to the identification of nine practices that are frequently cited as JIT practices. These are set-up time reduction, pull system production, JIT delivery by supplier, functional equipment layout, daily schedule adherence, committed leadership, strategic planning, cross-functional training, and employee involvement. Two major forms of waste — work-in-process inventory and unnecessary delays in flow time (Brown and Mitchell, 1991) — can be addressed through the implementation of JIT practices, such as set-up time reduction and pull system production. These JIT practices, however, require employees to be trained to perform multiple tasks and to be involved in the improvement efforts. To further support JIT, leadership
K.O. Cua et al. / Journal of Operations Management 19 (2001) 675–694
must be committed to the programs and employee development. TPM is a manufacturing program designed primarily to maximize equipment effectiveness throughout its entire life through the participation and motivation of the entire work force (Nakajima, 1988). Since there are only two empirical studies that address the elements of TPM implementation, we also include conceptual work in the identification of TPM practices and interviews from three site visits. We compare the TPM practices discussed in seven books and articles (Nakajima, 1988; Takahashi and Osada, 1990; Tsuchiya, 1992; Steinbacher and Steinbacher, 1993; Maier et al., 1998; McKone et al., 1999; McKone and Weiss, 1999). The comparison leads to the identification of autonomous maintenance and planned maintenance, equipment technology emphasis, committed leadership, strategic planning, cross-functional training, and employee involvement as the most commonly cited practices of TPM. Based on our site visits, we also consider the use of proprietary equipment as a component of TPM since several plants emphasized its importance in gaining competitive advantage. This is consistent with Hayes and Wheelwright’s (1984) characterization of firms that pursue a manufacturing-based competitive advantage which include among others the anticipation of the potential of advanced technologies and the development of proprietary equipment. To maintain equipment effectiveness, daily maintenance by operators is crucial. Unexpected breakdowns can be prevented through carefully-planned maintenance and the improvement or development of equipment. To conduct this maintenance, cross-functional training is necessary to improve operator skills. It is also important that all employees from management to the shop floor are committed to the maintenance process, providing the time and resources to improve equipment performance. More generally, emphasis on maintenance may also be reflected by the emphasis given to technological acquisition and improvement and the development of proprietary equipment. The above literature review of TQM, JIT, and TPM is summarized in Table 1 and shows that the three programs include some common practices that are shared by all programs and other practices that are unique to each program. The idea of common practices has not been addressed in the literature. Nevertheless, it is
677
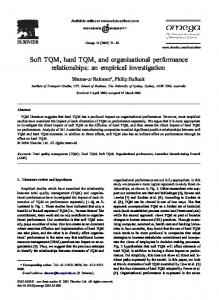
clear that TQM, JIT and TPM all lay claim to some of the same practices. The similar practices include committed leadership, strategic planning, cross-functional training, and employee involvement. We, therefore, consider these human and strategic-oriented practices as part of a group of common practices that support all three programs. Cua (2000) contains a detailed analysis and review of the practices that are common to the TQM, JIT and TPM literature. The use of information and feedback is explicitly cited in our literature analysis as part of a TQM program but not in JIT and TPM. However, the availability of information and feedback is certainly important in a JIT production environment when each station in a chain of manufacturing processes is tightly linked with its previous and subsequent stations to determine production lot sizes and schedule. The use of information and feedback is also considered as part of TPM in the work of McKone et al. (1999). Therefore, we consider the use of information and feedback a fifth practice that is common to TQM, JIT, and TPM. Apart from the practices that are common to all of the three programs, each of the programs also has unique practices that are more technically- or process-oriented. We refer to these program specific practices as the basic techniques. TQM basic techniques include cross-functional product design, process management, supplier quality management, and customer involvement; JIT basic techniques include set-up time reduction, pull systems production, JIT delivery by suppliers, equipment layout, and daily schedule adherence; and TPM basic practices are autonomous and planned maintenance, technology emphasis and proprietary equipment development. Now that the common practices and basic techniques have been specifically identified, an integrating framework can be developed and empirically tested. The framework, resulting from JIT, TQM and TPM being divided into a group of practices common to all three programs and basic techniques unique to each program, is shown in Fig. 1.
3. Hypotheses As shown in Fig. 1, our framework considers the relationship among the basic TQM, JIT and TPM techniques and the human and strategic-oriented practices
678
K.O. Cua et al. / Journal of Operations Management 19 (2001) 675–694
K.O. Cua et al. / Journal of Operations Management 19 (2001) 675–694
679
Fig. 1. An integrating framework.
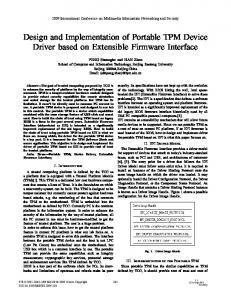
that are common to all programs. We hypothesize that there are significant differences in manufacturing performance determined by the level of implementation of these practices, techniques and other contextual factors. Fig. 2 illustrates our proposed model and relationships. Three main streams of research, socio-technical theory, concept of fit, and contextual theory, provide support for our theoretical framework. Next, we discuss our hypothesized relationships by drawing upon these theories. 3.1. Socio-technical systems theory The commonly cited problems in the implementation of manufacturing programs are those related
to cultural resistance to change, lack of training and education (Crawford et al., 1988), lack of coordination of the different departments, and confusion on the relationship between manufacturing subsystems (Safayeni et al., 1991). These studies provide evidence of the importance of the institution of common practices that will facilitate the successful implementation of all three programs. Moreover, according to the socio-technical systems theory the joint optimization of practices that are socially- and technically-oriented should lead to good performance (Emery, 1990). For example, Rehder (1989) argues for the importance of building manufacturing competitiveness upon the integration and coordination of strategy, structure, culture, and
Fig. 2. A theoretical framework.
680
K.O. Cua et al. / Journal of Operations Management 19 (2001) 675–694
human resource subsystems within a complex, changing environment. He shows that the concept of a balanced socio-technical system is reflected in all subsystems of successful Japanese transplants. We have already identified the practices of TQM, JIT, and TPM as forming two components, the common practices that are human- and strategic-oriented and the basic techniques that are unique to each of the three programs in Fig. 1. The common practices provide a supporting mechanism for the implementation of TQM, JIT, and TPM basic techniques. It is our contention that the implementation of basic techniques will not provide as strong an impact on manufacturing performance as the combined institution of the common practices and implementation of the basic techniques. Both the social and technical subsystems should be jointly optimized to achieve the best possible performance. We, therefore, expect that high performing manufacturing plants will have a high level of implementation of both the common human- and strategic-oriented practices and the basic techniques, both the social and technical systems. This is reflected in the following hypothesis. H1. Manufacturing plants that are identified as high performers have higher levels of implementation of both socially-oriented practices and technicallyoriented techniques of TQM, JIT, and TPM. 3.2. Concept of fit In addition to socio-technical systems theory, the concept of fit also supports our proposition that together the common human- and strategic-oriented practices and the basic techniques have a positive impact on manufacturing performance. Research involving the concept of fit investigates consistency among the groups or subsystems within an organization (internal fit) and/or fit among the organization structure, strategy, and context (external fit). In general, fit means consistency of two or more factors and it is believed that a good fit among relevant factors will lead to better performance (e.g. Venkatraman and Prescott, 1990; Milgrom and Roberts, 1995). We hypothesize that a higher level of manufacturing performance can be expected when the different common
practices and basic techniques of TQM, JIT and TPM are jointly implemented. The manufacturing programs TQM, JIT, and TPM have the common objective of making a production system more efficient and effective through continuous improvement and elimination of waste. TQM is focused on the elimination of defects and rework, helping to improve quality and delivery of products. JIT primarily emphasizes reduction of waste in inventory and flow time (Brown and Mitchell, 1991). TPM targets waste caused by equipment problems such as failure, unnecessary set-up and adjustment time, idling and minor stoppages, reduced speed, process defects, and reduced yield (Nakajima, 1988). The different emphases of TQM, JIT and TPM on waste reduction and elimination are complementary, yet may affect specific performance measures in different ways. The concept of fit explains why different practices may affect specific performance measures. For example, if the plant has a goal of cost reduction, a certain set of TQM, JIT, and TPM practices and techniques might be the best ones. On the other hand, if the plant desires high quality, a different set of practices, most likely including TQM techniques as well as other techniques and practices, might be the best. Typically, the complexity of co-alignment among factors makes it difficult to hypothesize the nature of the specific linkages between the factors (Venkatraman and Prescott, 1990). Furthermore, the concept of fit is not well enough developed in operations management to prescribe exactly what set of practice/techniques will lead to low cost or for that matter what set will lead to any other measure of performance. Nevertheless, fit theory leads us to believe that different sets of practices and techniques are needed to improve different performance measures. Research (see Flynn et al., 1995; Sriparavastu and Gupta, 1997; McKone et al., 1999, 2001) has found the implementation of TQM, JIT, and TPM to be interrelated. Therefore, when a manufacturing plant seeks to capitalize on the implementation of one of the three programs, we believe that the benefits will be maximized when the plant also implements basic techniques of the other two programs. In addition, since the common practices of TQM, JIT, and TPM will help in establishing a structure whereby the human resources of a plant can acquire information and learn, be empowered, and be involved in operations; these practices
K.O. Cua et al. / Journal of Operations Management 19 (2001) 675–694
will contribute towards manufacturing’s success. Therefore, in accordance with the concept of fit (Van de Ven and Drazin, 1985; Venkatraman, 1989), TQM, JIT, and TPM should be examined within a single theoretical framework so that the effects of their joint implementation can be investigated, while also considering their possible differential effects on performance. This is reflected in the following hypotheses. H2. Manufacturing plants that are identified as high performers have implemented practices from all three programs of TQM, JIT and TPM rather than from only one program. H3. Different configurations of basic techniques and common practices affect specific measures of performance. Hypothesis H2 states that simultaneous implementation of TQM, JIT, and TPM will result in higher performance than implementation of practices from only one of TQM, JIT and TPM. Rather, practices from each of the three programs that are implemented in an integrated manner should result in higher performance. 3.3. Contextual theory The context of the manufacturing plant may also affect its performance (Lawrence and Lorsch, 1967). Hayes and Wheelwright (1984) identify the root cause of “manufacturing crisis” to be the incompatibility of manufacturing policies and people with its facilities and technology choices. Furthermore, we find that practitioners often suggest that TQM, JIT or TPM cannot be implemented in the context of their plant. We want to explore whether contextual factors help differentiate between high and low performers. Thus, apart from the manufacturing practices or policies being implemented, we also consider contextual variables such as the number of employees, capacity utilization, and process-type. The number of employees is a measure of the size of the manufacturing plant. In general, organizational size has been one of the best predictors of organizational structure and managerial behavior in the history of organizational design and behavioral research (Drazin, 1995). More often than not, large
681
organizations are more centralized and formalized than small organizations and have more resources to deploy for the implementation of manufacturing programs. Therefore, we expect that larger plants will have better performance than smaller plants. Manufacturing resources such as plant capacity can also affect plant performance. Lack of capacity may result in a plant’s inability to meet orders on time and can limit the plant’s flexibility in production scheduling. A high level of plant capacity utilization may reduce per unit fixed costs but when high capacity is sustained through overtime, variable cost may increase (Krajewski and Ritzman, 1996). Plants operating at peak capacity may potentially encounter more equipment and process problems that can affect product quality. Schmenner and Swink (1998) also suggest that when the limits of the asset frontier or the structural resources have been reached, the law of trade-offs of manufacturing performance may set-in and inhibit further improvement in multiple dimensions of performance. The type of production process technology has been considered a contextual variable in research studies since the publication of Woodward’s (1965) typology of production technologies. Technologies typically associated with low volume and high variety may result in relatively low conformance quality due to conditions that inhibit quality-related learning (Garvin, 1988). On the other hand, production technologies associated with high volume and low variety production requirements generally provide substantial opportunity for standardization of products and production processes enabling quality-related learning. The degree of product customization that can affect per unit production cost and flexibility is also very closely related to the type of production process that is utilized. In summary, we propose that a higher level of manufacturing performance can be expected from manufacturing plants that are larger, have lower plant utilization and are more process-oriented. However, we also expect that the internal practices of the plant — common practices and basic techniques of TQM, JIT and TPM — provide more explanation of the manufacturing performance than the context of the plant. We believe that the practices and techniques adopted by a plant can reduce the effect of contextual factors on performance. We, therefore, have included
682
K.O. Cua et al. / Journal of Operations Management 19 (2001) 675–694
contextual variables in our study and their influence will be examined in the analysis section.
Table 3 Stages of data development
4. Description of the data The data used for empirical examination of the hypotheses were collected as part of an ongoing world class manufacturing (WCM) study (Flynn et al., 1994; Schroeder and Flynn, 2001) being conducted by a team of researchers at several universities throughout the world. The WCM database contains data from manufacturing plants located in the United States, Japan, Italy, Germany, and the United Kingdom. In each country, plants were randomly selected from three industries: electronics, machinery and transportation parts supplier industries. Table 2 provides the distribution of the 163 plants used in this study according to country and industry. The items used to measure the different practices of TQM, JIT and TPM, the contextual factors and manufacturing performance can be found in Appendices A–E. For the items measuring practices, the informants were asked to indicate their agreement or disagreement with the statements provided using five point Likert scales where a value of 5 indicates strong agreement and 1 indicates strong disagreement. For the performance measures, the plant manager was asked to evaluate plant performance relative to its competitors. Now we will discuss the data collection and preparation. The steps of the data development are shown in Table 3. The measurement instrument of the WCM study was developed from an extensive review of relevant
Analysis steps
Review of steps
Development of instrument
Literature review Five experts develop Pretest instrument at plants Translations verification
Data collection
Twenty six informants in each plant Two-third response rate
Test of validity, reliability
Confirmatory factor analysis (unidimensionality, convergent and discriminant validity) Pairwise correlations Construct reliabilities test
Scale development
Average measures from each plant Transformed to ensure normality Standardized by country and industry Super scales also created
literature on manufacturing practices. The content validity was strengthened by a panel of five experts who reviewed each of the scales that were developed. The instrument was then pretested at several manufacturing plants, revised as needed, and translated into Japanese, Italian, and German by teams of operations management experts from those countries. The translations were then translated back to English by a different person to check for accuracy. Necessary modifications to the instrument were made for clarity and consistency across translations. Care in the development and pretest of the questions assures that the constructs can be measured to an acceptable degree of content validity. The instrument was divided into 15 questionnaires that were administered to 26 informants in a
Table 2 Number of plants in the database classified by country and industry Country
Industry
Total
Electronics
Machinery
Transportation parts
Number of plants Germany Italy Japan United Kingdom United States
9 11 17 7 10
11 13 14 6 10
13 10 15 7 10
33 34 46 20 30
Total
54
54
55
163
K.O. Cua et al. / Journal of Operations Management 19 (2001) 675–694
manufacturing plant. There were 12 direct laborers who received the same questionnaire and 14 managers who each received a different questionnaire. Items on the questionnaires were assigned to multiple informants on the basis of their job title and expertise in order to increase the probability of getting accurate information while allowing data to be collected from multiple sources thereby providing greater reliability of the data. The selected manufacturing plants were contacted by a member of the WCM research team to participate in the study. Initially, 243 plants (each with more than 100 employees) were asked to participate in the study. Two-thirds of the plants contacted ultimately provided data for the study. This relatively high response rate was assured by contacting the plants personally and by promising that they would receive a plant profile for comparison with other plants. The psychometric properties of the different manufacturing practice measures were examined by a confirmatory factor analysis approach (Cua, 2000). Unidimensionality, convergent and discriminant validity were assessed by evaluating the factor loadings, overall model fit and correlation between factors. All models examined have satisfactory fit; factor loadings are all significant and greater than 0.45, and there is no evidence of cross-loading of an item on factors that it is not intended to measure. All pairwise correlations between common practices, TQM techniques, JIT techniques, and TPM techniques are significantly different from 1 satisfying tests of discriminant validity. Construct reliabilities, as assessed using Fornell and Larcker’s (1981) measure for reliability, are greater than 0.7. The constructs can therefore be measured with an acceptable degree of reliability and validity. Multiple measures of a practice construct were averaged to form a scale score for the construct. Some measures were transformed to ensure normality of their distribution. In order to control for possible differences due to country and industry all scale scores, contextual factors and performance measures were standardized by country and industry. The scale scores for practices were also aggregated to form four superscales — common practices, TQM techniques, JIT techniques, and TPM techniques for use in part of the analysis.
683
5. Method of analysis The major goal of this research is to determine whether or not implementation of manufacturing practices and techniques associated with TQM, JIT, and TPM explain differences in performance among manufacturing plants. We also consider contextual factors that may affect manufacturing performance though we expect the implementation of manufacturing practices to provide more explanation of performance variation. We use multiple discriminant analysis as the method of analysis to determine practices and contextual factors that best explain differences in performance. Multiple discriminant analysis allows understanding of group membership and investigation of group differences with respect to several factors simultaneously (Hair et al., 1998). This study uses descriptive discriminant analysis to reveal major differences among the groups of high and low performers and not to predict group membership of manufacturing plants. In discriminant analysis, the independent variables are weighted and combined linearly to form a discriminant function that will classify the manufacturing plants into high or low performers with as much separation between the groups as possible. To determine the importance of each independent variable in discriminating between the groups, researchers have increasingly used discriminant loadings (also referred to as structure correlations or coefficients) as a basis of interpretation (Pedhazur, 1982; Hair et al., 1998). The discriminant loadings reflect the explanatory ability of the independent variables and can be interpreted like factor loadings in assessing the relative contribution of each independent variable to the discriminant function. Discriminant loadings of at least 0.3 in absolute value are considered substantive discriminators worthy of note (Hair et al., 1998), however, a more stringent cut-off of 0.4 is usually used in determining significance of factor loadings (Carmines and Zeller, 1979). In this study, we adopt the higher cut-off in considering the contribution of the independent variables in differentiating performance. While we are interested in differences in plant performance, there are many ways of measuring manufacturing performance. The most predominant approach in the literature is to use cost, quality, delivery, and flexibility as the four basic dimensions of manufacturing performance. Use of these four basic dimensions
684
K.O. Cua et al. / Journal of Operations Management 19 (2001) 675–694
Table 4 Discriminant analysis and hypothesis testing Stage
Hypotheses
Supporting theory
Independent variables
1
H1: Manufacturing plants that are identified as high performers have higher levels of implementation of both socially-oriented practices and technically-oriented techniques of TQM, JIT, and TPM
Social-technical
One TQM superscale One JIT superscale One TPM superscale Three contextual measures
2
H2: Manufacturing plants that are identified as high performers have implemented practices from all three programs of TQM, JIT and TPM rather than from only one program H3: Different configurations of basic techniques and common practices affect specific measures of performance
Concept of fit
Four TQM techniques
Examination of the impact of contextual factors
Contextual theory
3
to measure manufacturing performance can be traced back to Skinner (1969) who launched the current interest in manufacturing strategy and manufacturing performance measurement with his now classic article. Skinner has been followed by many others who have also advocated the four basic dimensions including Schroeder (1993), and Ward et al. (1995). In addition to the four measures of conformance quality, cost efficiency, on-time delivery, and flexibility, we also considered a weighted performance measure. The weighted performance measure is obtained by taking the weighted sum of the four performance dimensions of quality, cost, delivery and flexibility, with weights determined by the strategic importance that a manufacturing plant associates with the performance dimension. Details of the weighted performance measure calculations are provided in Appendix E. The values for the performance measures were determined by the plant managers’ responses to the questions in Appendix E. For each of the five performance measures, we determine the high and low performing plants. Since the performance measures are standardized by country and industry, a manufacturing plant is classified as either a high or low performer depending on whether its value for a performance measure is positive or negative respectively. High and low performers are coded as belonging to group 1 and 0, respectively, in the discriminant analysis.
Five JIT techniques Three TPM techniques Five common practices Four TQM techniques Five JIT techniques Three TPM techniques Five common practices Three contextual measures
We consider three sets of discriminant models in the analysis. See Table 4 for the stages of our analysis. The first set uses the three contextual factors and four superscales of common practices, TQM techniques, JIT techniques and TPM techniques. The second set uses 17 specific common practices and basic techniques of TQM, JIT, and TPM in the analysis. The third set uses seventeen specific common practices and basic techniques as well as three contextual factors. We run five models for each of the sets of discriminant analysis, one each for the five performance measures. The analyses with the specific practices and techniques allow us to determine which practices provide a positive contribution to specific high performance dimensions and whether manufacturing practices or contextual factors provide more explanation of differences in performance. All of the 15 models analyzed have significant Wilk’s lambda and chi-square values indicating that their discriminant functions provide significant explanations of variation in performance. Another way of measuring a model’s discriminating power is by assessing the percentage of manufacturing plants that are correctly classified into the high or low performance group. The hit ratio or percentage of correct classification must be greater than the chance-based proportion of correct classification Cpro . The hit ratios are all at least 25% greater than Cpro indicating an acceptable level of classification accuracy. Moreover,
K.O. Cua et al. / Journal of Operations Management 19 (2001) 675–694
percentages of correct classification using a jack knife approach to the discriminant analyses are also greater than Cpro . While we are not interested in making predictions, the good classification results provide greater confidence in the results of the discriminant analyses.
6. Results and discussion In this section, we will discuss our results. As shown in Table 4, we will review our analysis in the order that we developed our hypotheses. First, we review the results from the analysis of the superscales and contextual factors (Table 5). This allows us to evaluate the importance of both socially- and technically-oriented practices to performance. Then, we consider the results of the analysis of the practices and techniques (Table 6). We are able to consider the fit of various practices and techniques and their impact on performance. Finally, we discuss the analysis with the TQM, JIT, and TPM practices and techniques and contextual factors (Table 7).
685
6.1. Socio-technical The discriminant analysis results using the practice superscales are shown in Table 5. The analyses show that the implementation of both the socially-oriented common practices and the technically-oriented basic TQM, JIT, and TPM techniques provides significant explanation of differences in the five performance measures. All the discriminant loadings for the superscales are greater than 0.45 in absolute value (Table 5). This result is consistent with the socio-technical systems theory, which holds that joint optimization of both socially- and technically-oriented policies or practices is necessary for achieving good results, and supports hypothesis H1. 6.2. Fit of practices The second stage of discriminant analyses, using the specific TQM, JIT, and TPM techniques and common practices, allows us to determine which manufacturing practices improve particular performance dimensions and help differentiate between high and
Table 5 Stage 1 — analysis of superscales and contextual factors Cost efficiency
Conform quality
On-time delivery
Volume flexibility
Weighted performance
Discriminant loadings and statistics Common practices 0.778 TQM techniques 0.698 JIT techniques 0.778 TPM techniques 0.643
0.853 0.867 0.586 0.499
0.779 0.874 0.668 0.687
0.605 0.629 0.588 0.529
0.788 0.706 0.661 0.680
Process type Number of employees Capacity utilization
−0.162 0.207 0.456
−0.522 0.427 0.234
−0.472 0.220 0.139
−0.772 0.352 −0.105
−0.612 0.360 0.127
Statistics Sample size Group 0 size Group 1 size Cpro (%) Hit ratio (%) Jackknife hit ratio (%) Canonical corr (Canonical corr)2 Wilk’s lambda Chi-square Degrees of freedom Significance
163 92 71 50.83 66.90 60.70 0.338 0.114 0.886 19.073 7 0.008
163 71 92 50.83 66.30 62.60 0.361 0.130 0.869 22.052 7 0.002
163 70 93 51.00 65.00 62.00 0.341 0.116 0.884 19.508 7 0.007
163 69 94 51.18 66.30 63.20 0.378 0.143 0.857 24.334 7 0.001
163 80 83 50.02 70.60 68.10 0.475 0.226 0.775 40.193 7 0.000
686
K.O. Cua et al. / Journal of Operations Management 19 (2001) 675–694
Table 6 Stage 2 — analysis of practices/techniques Cost efficiency Structure loadings × significant loading ≥ 0.40 Comm Lead 0.425 0.360 Strat Pln X Train 0.555 0.411 Emp Invol Info Feed 0.577
Conform quality
On-time delivery
Volume flexibility
Weighted perform
0.668 0.510 0.352 0.534 0.238
0.597 0.482 0.405 0.472 0.413
0.636 0.245 0.212 0.195 0.217
0.650 0.459 0.296 0.279 0.350
Proc Mgmt X Design Supp Mgmt Cust Inv
0.311 0.356 0.559 0.418
0.496 0.484 0.609 0.369
0.529 0.746 0.552 0.434
0.314 0.334 0.244 0.526
0.422 0.444 0.428 0.321
Set-up Red Pull Prod JIT Delv Equip Lay Sked Adh
0.491 0.441 0.616 0.373 0.314
0.243 0.162 0.571 0.251 0.398
0.271 0.326 0.468 0.262 0.593
0.142 0.313 0.404 0.171 0.329
0.169 0.356 0.504 0.357 0.415
Maintain Tech Emp Prop Eqp
0.538 0.514 0.181
0.302 0.502 0.141
0.477 0.650 0.244
0.283 0.544 0.196
0.359 0.603 0.283
163 92 71 50.83 68.70 60.10 0.450 0.203 0.798 34.47 17 0.007
163 71 92 50.83 72.40 64.40 0.473 0.224 0.776 38.64 17 0.002
163 70 93 51.00 69.30 60.70 0.414 0.171 0.829 28.67 17 0.038
163 69 94 51.18 77.90 71.20 0.510 0.260 0.740 45.92 17 0.000
163 80 83 50.02 79.10 74.20 0.593 0.352 0.649 65.97 17 0.000
Statistics Sample size Group 0 size Group 1 size Cpro (%) Hit ratio (%) Jackknife hit ratio (%) Canonical corr (Canonical corr)2 Wilk’s lambda Chi-square Degrees of freedom Significance
low performance. The results of the analysis are provided in Table 6. For each of the performance dimensions there are different manufacturing practices that have significant positive loadings and these practices belong to the different components of our framework — common practices, TQM techniques, JIT techniques, and TPM techniques. Moreover, the consistent positive discriminant loadings of the practices signify their compatibility and suggest that improvement should be directed towards multiple aspects — process and product quality, streamlining of the production process, and equipment maintenance and improvement. These results support hypothesis H2, which proposes that a higher level of manufacturing performance can
be expected when the different common practices and basic techniques of TQM, JIT and TPM are jointly implemented. It is interesting to look at the loadings of the individual practices and techniques. Committed leadership and emphasis in technology have significant positive loadings on all five discriminant functions. The support and commitment of management in the institution of new programs has often been heralded as the single most important factor in determining program success. Emphasis in technology acquisition and development reflects the importance given to the manufacturing function. Manufacturing plants that invest in process technology are more likely to use manufacturing as a source of
K.O. Cua et al. / Journal of Operations Management 19 (2001) 675–694
687
Table 7 Stage 3 — analysis of practices/techniques and contextual factors Cost efficiency Structure loadings × significant loading ≥ 0.40 Comm Lead 0.407 0.345 Strat Pln 0.531 X Train Emp Invol 0.393 Info Feed 0.552
Conform quality
On-time delivery
Volume flexibility
Weighted performance
0.655 0.501 0.346 0.524 0.233
0.569 0.460 0.387 0.450 0.394
0.584 0.225 0.194 0.179 0.199
0.621 0.439 0.283 0.267 0.334
Proc Mgmt X Design Supp Mgmt Cust Inv
0.298 0.340 0.535 0.400
0.487 0.475 0.597 0.362
0.504 0.712 0.527 0.414
0.288 0.307 0.223 0.483
0.403 0.424 0.409 0.307
Set-up Red Pull Prod JIT Delv Equip Lay Sked Adh
0.470 0.422 0.589 0.357 0.300
0.238 0.159 0.561 0.246 0.391
0.259 0.311 0.447 0.250 0.566
0.130 0.287 0.371 0.157 0.302
0.162 0.340 0.482 0.342 0.397
Maintain Tech Emp Prop Eqp
0.515 0.492 0.173
0.297 0.493 0.138
0.455 0.620 0.233
0.260 0.499 0.180
0.343 0.577 0.270
0.141 −0.110 0.311
0.303 −0.370 0.166
0.167 −0.360 0.106
0.223 −0.489 −0.067
0.252 −0.429 0.089
163 92 71 50.83 68.10 58.90 0.466 0.217 0.783 36.889 20 0.012 0.188 0.014
163 71 92 50.83 74.20 60.10 0.480 0.230 0.770 39.536 20 0.006 0.177 0.021
163 70 93 51.00 69.90 57.70 0.430 0.185 0.815 30.931 20 0.056 0.154 0.074
163 69 94 51.18 77.30 70.60 0.543 0.295 0.706 52.643 20 0.000 0.197 0.004
163 80 83 50.02 77.30 71.80 0.610 0.372 0.628 70.223 20 0.000 0.275 0.000
Plant size Process type Cap utilization Statistics Sample size Group 0 size Group 1 size Cpro (%) Hit ratio (%) Jackknife hit ratio (%) Canonical corr (Canonical corr)2 Wilk’s lambda Chi-square Degrees of freedom Significance Chg in (can corr)2 Significant chi-square change
competitive advantage and excel on all performance dimensions. In addition, all of the practice variables have significant structure loading on at least one dimension of performance except for equipment layout and proprietary equipment development. While general emphasis on improvement and investment in new and advanced process technology is important across all performance dimensions, the manufacturing plants included in this study may not have emphasized im-
plementation of more specific practices related to equipment design and layout. Reviewing the analysis relative to performance dimensions provides interesting results that support hypothesis H3. There are different configurations of practices and techniques that support high performance on particular performance dimensions. For example, cost efficiency and on-time delivery are positively associated with a greater number of practices spanning the three programs of TQM, JIT, and TPM. It
688
K.O. Cua et al. / Journal of Operations Management 19 (2001) 675–694
is not surprising that the implementation of manufacturing practices that are meant to reduce variability and increase productivity will minimize cost and improve delivery. As one might expect, conformance quality is more strongly associated with the implementation of common practices and TQM techniques than JIT and TPM practices. Volume flexibility has a significant positive relation with committed leadership, customer involvement, and technology emphasis only. The fewer number of variables discriminating between high and low performers in the measure of volume flexibility may be due to the complexity involved in improving volume flexibility as compared to the other performance measures. The number and mix of products being produced can largely affect volume flexibility. The results of the second stage of our analysis suggest that simultaneous implementation of TQM, JIT, and TPM will result in higher performance than implementation of practices and techniques from only one of TQM, JIT and TPM. This supports hypothesis H2. In addition, while it is not conclusive which particular manufacturing practices have stronger effects on specific performance dimensions, this study shows that there are different configurations of specific practices that should be implemented depending on the strategic importance attributed to a performance dimension, providing support for hypotheses H3. 6.3. Effect of context While the implementation of manufacturing practices provides significant differentiation of performance, we have discussed that contextual factors may also contribute to the explanation of performance variation. Contextual factors such as plant size, process type, and capacity utilization are believed to affect performance. All practice variables that have significant loadings in the discriminant analyses discussed in the last section (Table 6) remain significant even with the inclusion of the contextual variables (Table 7). While the loading of JIT delivery by suppliers variable decreases from 0.404 to 0.371, this variable can still be considered significant by the less stringent 0.30 standard for significant loading. Furthermore, chi-square difference tests for the addition of practice variables to models accounting for contextual differences are significant. These results maintain that the internal
practices of the plant — common practices and basic techniques of TQM, JIT and TPM — provide significant differentiation of high performers from low performers after accounting for contextual factors. Capacity utilization and organizational size did not provide a significant explanation of plant performance. Only process type is a significant differentiator between high and low performers for the measures of volume flexibility and weighted performance, when the higher cut-off of 0.40 is used to determine significance of structure loadings. However, when using the lower cut-off of 0.30, process type is also a significant variable in the discriminant functions of conformance quality and on-time delivery. It is not unexpected that process type plays a significant role in differentiating performance. When production involves low volume and high variety it may be more difficult to manage on-time delivery and flexibility because of the complexity involved in customizing the products. Conformance quality may also be adversely affected by the lack of opportunity for quality-related learning especially when the products being manufactured have unique features. Our analysis indicated that plants with low volumes and high customization have lower performance than more process-oriented plants. This stage of the analysis indicates that internal practices and techniques of a plant provide a better explanation of plant performance than the context in which a plant operates. It also further supports the theory that well-integrated manufacturing programs can lead to significant improvements in performance.
7. Conclusions This paper presents an integrating framework and helps to untangle the overlapping manufacturing practices of TQM, JIT and TPM. This is done by specifying a common set of human and strategic practices that are shared by all three programs. This leaves a set of basic techniques that are unique to each of the three programs. This study is one of the few to empirically demonstrate the importance of joint implementation of manufacturing programs. The findings from these empirical analyses demonstrate the importance of implementing the practices and techniques belonging to all three
K.O. Cua et al. / Journal of Operations Management 19 (2001) 675–694
programs. Each component of our integrating framework represents a different aspect of improvement initiatives aimed towards product, process, and equipment development. There exist different configurations of practices that are best suited for improving specific performance dimensions, however, each of these configurations consists of practices belonging to all three programs and includes both socially- and technically-oriented practices. This demonstrates that the components of our framework are mutually supporting in achieving high levels of manufacturing performance. Plant management should take into account the possible effects of contextual factors on performance. In particular, the type of production process being used can differentiate between high and low performance. Production involving one-of-a-kind products may be more difficult to manage but the implementation of compatible practices can help improve performance regardless of the process type being used. While our results suggest that implementation of manufacturing practices can mask the effect of contextual factors on performance, future studies should investigate the possible interaction
689
effects of contextual factors and manufacturing practices on performance. A variety of future research studies are possible including longitudinal studies and more detailed examination of the relationships among the three programs. Longitudinal studies could help examine the causal linkages among practices. More detailed studies could pinpoint the exact nature of the interaction among practices. While this study provides a foundation for examining TQM, JIT, and TPM within a single framework, it is only through further research that a full understanding of the relationship among TQM, JIT and TPM will be obtained.
Acknowledgements This paper is published in memory of K.O. Cua, a dedicated colleague and good friend. This research was partially supported by the Juran Center for Leadership in Quality, University of Minnesota and The National Science Foundation, NSF grant no. 9422348.
Appendix A. Measurement of common practices Committed leadership
All major department heads within our plant accept their responsibility for quality Plant management provides personal leadership for quality products and quality improvement All major department heads within our plant work towards encouraging JIT production Our top management strongly encourages employee involvement in the production process Plant management creates and communicates a vision focused on quality improvements Plant management is personally involved in quality improvement projects
Strategic planning
Our plant has a formal strategic planning process which results in a written mission, long-range goals and strategies for implementation Plant management is not included in the formal strategic planning process. It is conducted at higher levels in the corporation The plant has a strategic plan which is put in writing Plant management routinely reviews and updates a long-range strategic plan The plant has an informal strategy which is not very well defined
690
K.O. Cua et al. / Journal of Operations Management 19 (2001) 675–694
Appendix A. (Continued) Cross-functional training
Employees receive training to perform multiple tasks Employees at this plant learn how to perform a variety of tasks/jobs Employees are cross-trained at this plant so that they can fill in for others if necessary At this plant, employees only learn how to do one job/task
Employee involvement
During problem solving sessions, we make an effort to get all team members’ opinions and ideas before making a decision Our plant forms teams to solve problems In the past 3 years, many problems have been solved through small group sessions Problem solving teams have helped improve manufacturing processes at this plant Employee teams are encouraged to try to solve their problems as much as possible
Information and feedback
Charts showing defect rates are posted on the shop floor Charts showing schedule compliance are posted on the shop floor Charts plotting the frequency of machine breakdowns are posted on the shop floor Information on quality performance is readily available to employees Information on productivity is readily available to employees
Appendix B. Measurement of TQM basic techniques Process management
A large percent of the equipment or processes on the shop floor are currently under statistical quality control We make extensive use of statistical techniques to reduce variance in processes We use charts to determine whether our manufacturing processes are in control We monitor our processes using statistical process control
Cross-functional product design
Direct labor employees are involved to a great extent (on teams or consulted) before introducing new products or making product changes Manufacturing engineers are involved to a great extent before the introduction of new products There is little involvement of manufacturing and quality people in the early design of products, before they reach the plant We work in teams, with members from a variety of areas (marketing, manufacturing, etc.) to introduce new products
Supplier quality management
Quality is our number one criterion in selecting suppliers We use mostly suppliers which we have certified Our suppliers are certified, or qualified, for quality
Customer involvement
We frequently are in close contact with our customers Our customers give us feedback on quality and delivery performance We strive to be highly responsive to our customers’ needs We regularly survey our customers’ requirements
K.O. Cua et al. / Journal of Operations Management 19 (2001) 675–694
691
Appendix C. Measurement of JIT basic techniques Set-up time reduction
We are aggressively working to lower set-up times in our plant We have low set-up times of equipment in our plant Our crews practice set-ups to reduce the time required Our workers are trained to reduce set-up time
Pull system production
Suppliers fill our kanban containers, rather than filling purchase orders Our suppliers deliver to us in kanban containers, without the use of separate packaging We use a kanban pull system for production control We use kanban squares, containers or signals for production control
JIT delivery by suppliers
Our suppliers deliver to us on a JIT basis Our suppliers deliver to us on short notice We can depend upon on-time delivery from our suppliers
Equipment layout
We have laid out the shop floor so that processes and machines are in close proximity to each other Our machines are grouped according to the product family to which they are dedicated The layout of the shop floor facilitates low inventories and fast throughput Our processes are located close together so that material handling and part storage are minimized
Schedule adherence
We usually meet the production schedule each day Our daily schedule is reasonable to complete on time We usually complete our daily schedule as planned
Appendix D. Measurement of TPM basic techniques Autonomous and planned maintenance
We dedicate a portion of every day solely to maintenance We emphasize good maintenance as a strategy for achieving quality and schedule compliance We have a separate shift, or part of a shift, reserved each day for maintenance activities Our maintenance department focuses on assisting machine operators perform their own preventive maintenance
Technology emphasis
Our plant stays on the leading edge of new technology in our industry We are constantly thinking of the next generation of technology We are a leader in the effective use of new process technology We search for continuing learning and improvement after installation of the equipment
Proprietary equipment development
We actively develop proprietary equipment We rely on vendors for most of our equipment We have equipment which is protected by the firm’s patents Proprietary equipment helps us gain a competitive advantage
692
K.O. Cua et al. / Journal of Operations Management 19 (2001) 675–694
Appendix E. Measurement of contextual factors and manufacturing performance dimensions Contextual factors Process-orientation
The production process in this plant is best characterized as follows (what percent of product volume fall into each category?) One of a kind (C5) (—%) Small batch (C4) (—%) Large batch (C3) (—%) Repetitive/line flow (C2) (—%) Continuous (C1) (—%) Product customization = 5 × C5 + 4 × C4 + 3 × C3 + 2 × C2 + 1 × C1
Capacity utilization
During the past year, what was the average percentage of plant capacity utilization (—%)
Number of employees
Number of personnel employed (hourly personnel) in the current year (—) Number of personnel employed (salaried personnel) in the current year (—) Number of employees = number of hourly personnel + number of salaried personnel
Manufacturing performance measures Manufacturing performance Please circle the number which indicates your opinion about how dimensions your plant compares to its competition in your industry, on a global basis; 5: superior or better than average, 4: better than average, 3: average or equal to the competition, 2: below average, 1: poor or low end of the industry Conformance quality (P1) Quality of product conformance 5 Cost efficiency (P2) Unit cost of manufacturing 5 On-time delivery (P3) Delivery performance (on-time delivery) 5 Volume flexibility (P4) Flexibility to change volume 5 Weighted manufacturing performance
Please rank the importance of the following objectives or goals for manufacturing at your plant over the next 5 years. Rank #1 for the most important objective, #2 for the next most important and so on. You may rank several objectives the same if they are of equal importance Consistent quality (W1) (rank = ) Low unit cost (W2) (rank = ) Dependable delivery (W3) (rank = ) Ability to make rapid volume changes (rank = ) Weighted performance = W1 × P1 + W2 × P2 + W3 × P3 + W4 × P4 The rankings are converted into weights of 2.5, 2, 1.5 and 1; and when two rankings are equal, the weights are adjusted so that the sum of the weights always equal 7
4 4 4 4
3 3 3 3
2 2 2 2
1 1 1 1
K.O. Cua et al. / Journal of Operations Management 19 (2001) 675–694
References Ahire, S.L., Golhar, D.Y., Waller, M.A., 1996. Development and validation of TQM implementation constructs. Decision Sciences 27 (1), 23–56. Ahmad, S., 1998. The relationship between JIT managerial practice and JIT infrastructure: implications for plant performance. Unpublished Doctoral Dissertation. Carlson School of Management, University of Minnesota, Minneapolis, MN. Benson, P.G., Saraph, J.V., Schroeder, R.G., 1991. The effects of organizational context on quality management. Management Science 37 (9), 1107–1125. Black, S.A., Porter, L.J., 1996. Identification of the critical factors of TQM. Decision Sciences 27 (1), 1–21. Brown, K.A., Mitchell, T.R., 1991. A comparison of Just-in-Time and batch manufacturing: the role of performance obstacles. Academy of Management Journal 34 (4), 906–917. Carmines, E.G., Zeller, R.A., 1979. Reliability and Validity Assessment. Sage, Beverly Hills, CA. Crawford, K.M., Blackstone Jr., J.H., Cox, J.F., 1988. A study of JIT implementation and operating problems. International Journal of Production Research 26 (9), 1561–1568. Cua, K.O., 2000. A Theory of Integrated Manufacturing Practices Relating Total Quality Management, Just-in-Time, and Total Productive Maintenance. A Dissertation Thesis from University of Minnesota. Ann Arbor, MI, UMI, Publication no. AAT 9975753. Davy, J.A., White, R.E., Merritt, N.J., Gritzmacher, K., 1992. A derivation of the underlying constructs of Just-in-Time management systems. Academy of Management Journal 35 (3), 653–670. Dean Jr., J.W., Bowen, D.E., 1994. Management theory and total quality: improving research and practice through theory development. Academy of Management Review 19 (3), 392–418. Drazin, R., 1995. Organizational size. In: Nicholson, N. (Ed.), The Blackwell Encyclopedic Dictionary of Organizational Behavior. Blackwell, Cambridge, MA, pp. 399–400. Emery, F., 1990. The nine-step model. In: Trist, E.L., Murray, H. (Eds.), The Social Engagement of Social Science, A Tavistock Anthology: The Socio-Technical Perspective, Vol. 2. University of Pennsylvania Press, Philadelphia, PA, pp. 569–579. Flynn, B.B., Schroeder, R.G., Sakakibara, S., 1994. A framework for quality management research and an associated measurement instrument. Journal of Operations Management 11 (4), 339–366. Flynn, B.B., Sakakibara, S., Schroeder, R.G., 1995. Relationship between JIT and TQM: practices and performance. Academy of Management Journal 38 (5), 1325–1360. Fornell, C., Larcker, D.F., 1981. Evaluating structural equation models with unobservable variables and measurement error. Journal of Marketing Research 18 (1), 39–50. Garvin, D.A., 1988. Managing Quality: The Strategic and Competitive Edge. Free Press, New York. Hackman, J.R., Wageman, R., 1995. Total Quality Management: empirical, conceptual, and practical issues. Administrative Science Quarterly 40 (2), 309–342. Hair, J.F., Anderson, R.E., Tatham, R.L., Black, W.C., 1998. Multivariate Data Analysis. Prentice Hall, Upper Saddle River, NJ.
693
Hayes, R.H., Wheelwright, S.C., 1984. Restoring Our Competitive Edge: Competing Through Manufacturing. Wiley, New York. Huang, P., 1991. World class manufacturing in the 1990s: integrating JIT, TQC, FA, and TPM with worker participation. In: Fandel, G., Zapfel, G. (Eds.), Modern Production Concepts: Theory and Applications. Springer, New York, pp. 491–507. Imai, M., 1998. Will America’s corporate theme song be just in time? Journal of Quality Participation 21 (2), 26–28. Krajewski, L.J., Ritzman, L.P., 1996. Operations Management: Strategy and Analysis. Addison-Wesley, Reading, MA. Lawrence, P.R., Lorsch, P.R., 1967. Organization and Environment. Harvard University Press, Boston, MA. Maier, F.H., Milling, P.M., Hasenpusch, J., 1998. Implementation and outcomes of Total Productive Maintenance. In: Coughlan, P., Dromgoole, T., Peppard, J. (Eds.), Operations Management: Future Issues and Competitive Responses, Papers from the 5th International Conferences of the European Operations Management Association. Trinity College, University of Dublin, Dublin, Ireland, pp. 304–309. McKone, K.E., Weiss, E.N., 1999. Total Productive Maintenance: bridging the gap between practice and research. Production and Operations Management 7 (4), 335–351. McKone, K.E., Schroeder, R.G., Cua, K.O., 1999. Total Productive Maintenance: a contextual view. Journal of Operations Management 17 (2), 123–144. McKone, K.E., Schroeder, R.G., Cua, K.O., 2001. The impact of Total Productive Maintenance practices on manufacturing performance. Journal of Operations Management 19 (1), 39–58. McLachlin, R., 1997. Management initiatives and Just-in-Time manufacturing. Journal of Operations Management 15 (4), 271– 292. Mehra, S., Inman, R.A., 1992. Determining the critical elements of Just-in-Time implementation. Decision Sciences 23 (1), 160– 174. Milgrom, P., Roberts, J., 1995. Complementarities and fit: strategy, structure, and organizational change in manufacturing. Journal of Accounting and Economics 19 (2/3), 179–208. Nakajima, S., 1988. Introduction to TPM. Productivity Press, Cambridge, MA. Ohno, T., 1988. Toyota Production System: Beyond Large-Scale Production. Productivity Press, Cambridge, MA. Pedhazur, E.J., 1982. Multiple Regression in Behavioral Research. Holt, Rinehart & Winston, New York. Powell, T.C., 1995. Total Quality Management as competitive advantage: a review and empirical study. Strategic Management Journal 16 (1), 15–27. Rehder, R.R., 1989. Japanese transplants: in search of a balanced and broader perspective. Columbia Journal of World Business 24 (4), 17–28. Roth, A.V., Miller, J.G., 1992. Success factors in manufacturing. Business Horizons 35 (4), 73–81. Safayeni, F., Purdy, L., van Engelen, R., Pal, S., 1991. Difficulties of Just-in-Time implementation: a classification scheme. International Journal of Operations and Production Management 11 (7), 27–36. Sakakibara, S., Flynn, B.B., Schroeder, R.G., 1993. A framework and measurement instrument for Just-in-Time manufacturing. Production and Operations Management 2 (3), 177–194.
694
K.O. Cua et al. / Journal of Operations Management 19 (2001) 675–694
Sakakibara, S., Flynn, B.B., Schroeder, R.G., Morris, W.T., 1997. The impact of Just-in-Time manufacturing and its infrastructure on manufacturing performance. Management Science 43 (9), 1246–1257. Samson, D., Terziovski, M., 1999. The relationship between Total Quality Management practices and operational performance. Journal of Operations Management 17 (4), 393–409. Saraph, J.V., Benson, P.G., Schroeder, R.G., 1989. An instrument for measuring the critical factors of quality management. Decision Sciences 20, 810–829. Schmenner, R.W., Swink, M.L.L., 1998. On theory in operations management. Journal of Operations Management 17 (1), 97– 113. Schonberger, R.J., 1986. World Class Manufacturing: The Lessons of Simplicity Applied. Free Press, New York. Schonberger, R.J., 1996. World Class Manufacturing: The Next Decade: Building Power, Strength, and Value. Free Press, New York. Schroeder, R.G., 1993. Operations Management, Decision Making in the Operations Function, 4th Edition. McGraw-Hill, New York. Schroeder, R.G., Flynn, B.B. (Eds.), 2001. High Performance Manufacturing: Global Perspectives. Wiley, New York. Skinner, W., 1969. Manufacturing — missing link in corporate strategy. Harvard Business Review 50, 136–145. Sriparavastu, L., Gupta, T., 1997. An empirical study of Just-inTime and Total Quality Management principles implementation in manufacturing firms in the USA. International Journal of Operations and Production Management 17 (2), 1215–1232.
Steinbacher, H.R., Steinbacher, N.L., 1993. TPM for America: What It Is and Why You Need It. Productivity Press, Cambridge, MA. Sugimori, Y., Kusunoki, K., Cho, F., Uchikawa, S., 1977. Toyota production system and kanban system: materialization of Just-in-Time and respect for human systems. International Journal of Production Research 15 (6), 553–564. Takahashi, Y., Osada, T., 1990. TPM: Total Productive Maintenance. Asian Productivity Organization, Tokyo, Japan. Tsuchiya, S., 1992. Quality Maintenance: Zero Defects Through Equipment Management. Productivity Press, Cambridge, MA. Van de Ven, A.H., Drazin, R., 1985. The concept of fit in contingency theory. In: Cummings, L.L., Staw, B.M. (Eds.), Research in Organizational Behavior, Vol. 7. JAI Press Inc., Greenwich, CT, pp. 333–365. Venkatraman, N., 1989. The concept of fit in strategy research: toward verbal and statistical correspondence. Academy of Management Review 14 (3), 423–444. Venkatraman, N., Prescott, J.E., 1990. Environment-strategy coalignment: an empirical test of its performance implications. Strategic Management Journal 11 (1), 1–23. Ward, P.T., Duray, R., Leong, G.K., Sum, C.C., 1995. Business environment, operations strategy and performance: an empirical study of Singapore manufacturers. Journal of Operations Management 13, 99–115. Woodward, J., 1965. Industrial Organization. Oxford University Press, Oxford.