Feb 15, 2011 - of muscle excitability, including neuromuscular trans- ... mercialâShare AlikeâNo Mirror Sites license for the first six months after the ..... state behavior that is constrained to what is physically .... sharp electrodes ( 20 MΩ) were inserted into the same muscle ...... excitability in K+-depressed rat soleus muscle.
Article
Relationships between resting conductances, excitability, and t-system ionic homeostasis in skeletal muscle James A. Fraser,1 Christopher L.-H. Huang,1 and Thomas H. Pedersen1,2 1
Physiological Laboratory, University of Cambridge, Cambridge CB2 3EG, England, UK Department of Physiology and Biophysics, Aarhus University, 8000 Aarhus, Denmark
The Journal of General Physiology
2
Activation of skeletal muscle fibers requires rapid sarcolemmal action potential (AP) conduction to ensure uniform excitation along the fiber length, as well as successful tubular excitation to initiate excitation–contraction coupling. In our companion paper in this issue, Pedersen et al. (2011. J. Gen. Physiol. doi:10.1085/jgp.201010510) quantify, for subthreshold stimuli, the influence upon both surface conduction velocity and tubular (t)-system excitation of the large changes in resting membrane conductance (GM) that occur during repetitive AP firing. The present work extends the analysis by developing a multi-compartment modification of the charge–difference model of Fraser and Huang to provide a quantitative description of the conduction velocity of actively propagated APs; the influence of voltage-gated ion channels within the t-system; the influence of t-system APs on ionic homeostasis within the t-system; the influence of t-system ion concentration changes on membrane potentials; and the influence of Phase I and Phase II GM changes on these relationships. Passive conduction properties of the novel model agreed with established linear circuit analysis and previous experimental results, while key simulations of AP firing were tested against focused experimental microelectrode measurements of membrane potential. This study thereby first quantified the effects of the t-system luminal resistance and voltage-gated Na+ channel density on surface AP propagation and the resultant electrical response of the t-system. Second, it demonstrated the influence of GM changes during repetitive AP firing upon surface and t-system excitability. Third, it showed that significant K+ accumulation occurs within the t-system during repetitive AP firing and produces a baseline depolarization of the surface membrane potential. Finally, it indicated that GM changes during repetitive AP firing significantly influence both t-system K+ accumulation and its influence on the resting membrane potential. Thus, the present study emerges with a quantitative description of the changes in membrane potential, excitability, and t-system ionic homeostasis that occur during repetitive AP firing in skeletal muscle. INTRODUCTION
Recent studies have demonstrated that the resting membrane conductance (GM) of skeletal muscle is highly regulated during repetitive firing of short trains of action potentials (APs) that replicate excitation patterns occurring during activity in skeletal muscle (Pedersen et al., 2009a,b). In fast-twitch rat muscle, this regulation of GM has two distinct phases. At the onset of AP firing, Phase I involves the inhibition of ClC-1 channels through a PKC-mediated mechanism causing a decline in GM to 40% of its resting value. Then, during prolonged activity, Phase II changes involve the opening of ClC-1 and KATP channels, increasing GM to four to five times its value in quiescent fibers. Upon cessation of AP firing, GM recovers to its level before AP firing in 1–5 min. In our companion paper (see Pedersen et al. in this issue), we demonstrated the significance of this GM regulation for subthreshold electrical properties in muscle fibers, and from this predicted the effects of such GM changes upon their excitability. In particular, our study
described the relative sensitivity of the different aspects of muscle excitability, including neuromuscular transmission, sarcolemmal AP propagation, and tubular (t)-system excitation, to such regulation. The study used a linear circuit analysis appropriate for subthreshold electrical membrane phenomena. This approach first allowed for the development of analytical solutions for three cable models of muscle fibers. To determine which of these models gave the best representation of the electrical properties of rat extensor digitorum longus (EDL) muscle fibers in which the GM regulation has been observed, experimental measurements of membrane impedance properties were compared with the electrical characteristics of the cable models. This demonstrated that circuit models of rat EDL muscle fibers require a substantial luminal t-system resistance to account for experimental observations of their impedance properties and the velocity with which APs propagate in these fibers.
Correspondence to James A. Fraser: jaf21@cam.ac.uk Abbreviations used in this paper: AP, action potential; CD, charge– difference; ECF, extracellular fluid; EDL, extensor digitorum longus; GM, resting membrane conductance.
© 2011 Fraser et al. This article is distributed under the terms of an Attribution–Noncommercial–Share Alike–No Mirror Sites license for the first six months after the publication date (see http://www.rupress.org/terms). After six months it is available under a Creative Commons License (Attribution–Noncommercial–Share Alike 3.0 Unported license, as described at http://creativecommons.org/licenses/by-nc-sa/3.0/).
The Rockefeller University Press $30.00 J. Gen. Physiol. Vol. 138 No. 1 95–116 www.jgp.org/cgi/doi/10.1085/jgp.201110617
95
The study went on to predict that such a luminal resistance enhances the propagation velocity of sarcolemmal APs. It also showed that a luminal resistance in series with the t-system membrane divides the voltage gradient between the intracellular and interstitial spaces into voltage drops across the t-system membrane and the luminal resistance. Because this voltage division is highly frequency dependent, the luminal resistance has important consequences for t-system excitation. Thus, highfrequency current will predominantly generate voltage gradients across the luminal resistance, whereas lower frequency components will be important for t-system excitation. The analytic approach of the previous study therefore demonstrated that GM changes predominantly affect the low-frequency membrane impedance. It was further demonstrated, by convolving experimental APs with the circuit models, that t-system excitation is a lowfrequency phenomenon that is highly dependent on GM. Collectively, our companion study thus demonstrates that models of rat EDL muscle fibers must include a luminal resistance and suggests that neuromuscular transmission and t-system excitation are more sensitive to GM regulation than is sarcolemmal AP propagation. The linear circuit analysis used in our companion study was also useful in providing analytic expressions that could distinguish the appropriate equivalent cir cuit model for rat EDL muscle fibers and quantify the t-system luminal resistance. However, such a linear analy sis is necessarily incomplete when exploring the possible physiological roles of the t-system luminal resistance and GM regulation for the nonlinear membrane phenomena involved in AP propagation. Such nonlinear properties, explored in the present study, include voltage-dependent, time-dependent, and rectifying and Na+/K+-ATPase-mediated currents, as well as alterations in intracellular and t-system ionic concentrations during repetitive activity. The aim of the present study was therefore to quantify the influence of t-system luminal resistances and GM regulation in skeletal muscle excitability and t-system ionic homeostasis. It uses a nonlinear, iterative approach based upon the charge–difference (CD) model of Fraser and Huang (2004) and Fraser et al. (2005a,b). The development of a new model was necessary because no existing model simulates the full range of physical and electrophysiological properties that underlie t-system ionic homeostasis and its relationship with the membrane potential. Thus, early models applying circuit theory with voltage- and time-dependent conductances allow for the simulation of individual APs in the absence of ionic concentration or osmotic changes and are therefore unsuitable for simulating trains of APs where ionic concentrations shift substantially (Adrian and Peachey, 1973; Adrian and Marshall, 1976). Subsequent, more realistic models permitting the simulation of APs within the restricted extracellular space of a whole muscle 96
Membrane conductivity and muscle excitability
(Henneberg and Roberge, 1997), and of t-system K+ handling during AP firing (Wallinga et al., 1999), do not incorporate osmotic water movements. Therefore, they do not reach unique steady-state solutions that are independent of the initial values of key modeled variables, such as intracellular and intra–t-system ion concentrations (Fraser and Huang, 2007). The modeling approach adopted here encompasses the known determinants of AP propagation and reaches a true history-independent steady state, thereby remaining applicable despite large perturbations in ionic concentration. It incorporates terms describing voltage- and time-dependent ion conductances and Na+/K+ pump activity; represents muscle fiber surface geometry using 99 linearly connected fiber segments permitting simulation of surface conduction; represents tubular geometry in terms of 20 concentric shells per fiber segment, each separated by a small luminal series resistance as was experimentally verified in our companion study (Pedersen et al., 2011); and simulates osmotic water fluxes, thereby permitting it to reach a unique historyindependent steady state (Fraser and Huang, 2007). History independence of the modeled variables was demonstrated by initiating the new model from several sets of widely divergent unphysiological values for all ion concentration variables. In each case, the model relaxed to an identical and physiologically reasonable steady state, thereby demonstrating that it was capable of investigating the determinants of intracellular and intra–t-system ionic homeostasis, and additionally allowing for the use of model-derived initial values for variables such as intra–t-system ion concentrations for which there is little available experimental data. The initial application of this model confirmed the prediction from the preceding analytical study that the t-system luminal resistance enhances the sarcolemmal AP propagation velocity and reduces t-system excitation. It further demonstrated the influence of active AP generation within the t-system on t-system excitation and t-system ionic homeostasis, and the effect of these upon the surface membrane potential. It was then used to explore the role of GM regulation in determining the threshold stimulus for AP firing, for t-system excitability, and for the homeostasis of K+ ions within the t-system during repetitive AP firing. The outputs of simulated trains of APs were shown to be in close quantitative agreement with experimental intracellular recordings of AP trains obtained from rat EDL muscle fibers. Theory Development of a CD model of rat skeletal muscle
The electrical properties of rat EDL skeletal muscle fibers were modeled on CD principles (Fraser and Huang, 2007), adapting and extending the model of Fraser and Huang (2004) and Fraser et al. (2005a,b) to include key
nonlinear membrane phenomena of AP excitation and conduction and t-system excitation, as depicted in Fig. 1. The new model thus simulated the following features: longitudinal subdivision of the model fibers into multiple subsections connected to form a cable model; subdivision of the t-system into a series of concentric shells separated by series resistances representing the t-system luminal resistance; voltage- and time-dependent ion channels within the surface and t-tubular membranes; and ion and osmotic water fluxes across the surface and t-system membranes and the t-system luminal resistances. The model parameters were calibrated to the passive electrical properties of rat fast-twitch EDL muscle fibers that were obtained using the analytic model in our companion study (Pedersen et al., 2011). This allowed its subsequent use in evaluating the physiological significance of the t-system luminal resistance and GM regulation in active muscle fibers that has been observed previously in AP-firing EDL fibers (Pedersen et al., 2009a). The model was developed to adhere strictly to four key
principles: (a) current continuity; (b) conservation of charge and mass; (c) electrodiffusion of ions; and (d) osmotic equilibrium at steady state. (a) The principle of current continuity across the resistances and capacitances of the CD model. The simulation of mul-
tiple apposing finite compartments within strict conservation principles requires that any flow of current completes a circuit to ground, and also that such currents, whether capacitative or resistive, correlate precisely with the correct changes in compartmental ion contents. Both current continuity and conservation principles can be achieved straightforwardly for ionic fluxes through ion channels and across resistances by the following equations:
∆ [S ]a = J S Am(a )∆t , (mol l−1s −1),
∆ [S ]b = − J S Am(b )∆t , mol l−1s −1 ,
(
)
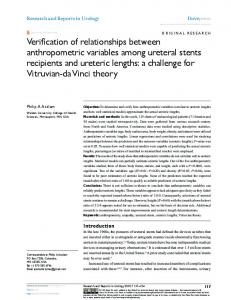
Figure 1. The ionic fluxes and capacitances simulated in the CD model of skeletal muscle cable properties. A multi-compartment
model was developed to model the cable properties of skeletal muscle. The muscle fiber was divided into 99 longitudinal segments, the length of which could be varied. Each cable segment contained a t-system compartment that could be simulated as a single compartment or further subdivided into several concentric shells. In each cable segment, ionic fluxes through background and voltage-gated ion channels, calculated using the Goldman equation, and Na+/K+-ATPase (pump) fluxes were simulated across the sarcolemma membrane (Js), and across the membrane of each t-system shell (Jn). Ionic fluxes across the t-system access resistance (Jt(e→0)), between t-system shells (J(n→n+1)), and between adjacent cable segments of the muscle fiber (J(l)) were calculated using an electrodiffusion equation according to the prevailing concentration and electrical gradients. In addition to the depicted ionic currents, water fluxes were also modeled, allowing the model to reach a steady state that is independent of the initial concentration of any ion. Potential differences were calculated, as described in the Theory section, across the surface membrane capacitance (Cm), across the membrane capacitance of each t-system shell (Cn), between each cable segment, between the extracellular space and the outer shell of the t-system, and between each t-system shell. �
Fraser et al.
97
where [S] represents the concentration of any solute (mol l1), the subscripts a and b denote the compartments between which the ionic flux, J (mol cm2), is flowing, and Am is the membrane area per unit volume (cm2 l1) for each compartment. Conservation of charge and ion concentration is clear from the relationship [S]a/Am(a) = [S]b/Am(b). The CD modeling approach additionally permitted calculation of the less straightforward requirement to characterize the precise ionic concentration changes resulting from capacitive currents, in which association of one ion species with one “plate” of a capacitor might displace or attract different ion species from or to the other plate, such that [S]a/Am(a) ≠ [S]b/Am(b), in marked contrast to the situation with currents through ion channels. For example, hyperpolarization of the t-tubular membrane could result in the association of Na+ and/or Cl dissociation with the outer membrane surface, but the dissociation of K+ from the inner membrane surface. This possibility is made explicit by the following relationships for the surface and t-tubular membrane capacitance (Cm, F cm2) in a muscle fiber with a homogenous t-tubular compartment separated from the bulk extracellular fluid (ECF) by an access resistance, RA:
E m = Q sm / (C m Am ) , ( V )
and:
E t = Q tm / (C m At ) , ( V )
while:
E A = Em − Et , ( V )
where Qsm is the net charge associated with the surface membrane capacitance, Qtm is the net charge associated with the t-system membrane capacitance, with each expressed per liter of cell volume (C l1), and Am and At represent the membrane areas of the sarcolemma and t-system, respectively, referred to total cell volume (cm2 l1). Em represents the trans-sarcolemmal membrane potential, Et is the trans-tubular membrane potential, and EA is the potential across the tubular access resistance. Ionic fluxes then directly influence the ion concentrations and hence the net charges within the intracellular (i) and t-tubular (t) compartments. These relate to the charges associated with membrane capacitances by:
(
)
(b) Strict conservation principles in CD modeling of multiple interconnected finite compartments. By tracking concen-
tration changes and then calculating electrical potentials directly from the concentrations of charge carriers and the associated capacitance terms, the CD approach results in a model that obeys fundamental charge and mass conservation principles. This allows the model to reach true steady states that are independent of the initial values of any modeled variable (Fraser and Huang, 2007). Thus, for a single membrane-bound compartment, the electrical potential with respect to the bulk ECF is given at any time by:
Em = Q i / Cm , ( V )
where Em is the membrane potential, and Cm is the membrane capacitance. Q denotes net charge, and the subscript “i” denotes the intracellular space, such that:
Q i = F ([Na + ]i + [K + ]i − [Cl− ]i + z X [X ]i ), (C l−1)
where zX is the mean charge valency of the various membrane-impermeant solutes, denoted X, and F is Faraday’s constant. The influence of zX and [X]i on the steady state of the model has been described previously (Fraser and Huang 2004, 2007; Fraser et al., 2005a). With the current–continuity assumptions explored above, relationships may be given for Em and Et in terms of the CDs within each compartment. First, if the t-system is considered as a single homogenous compartment, partially bounded by a membrane with capacitance per unit area that is identical to that of the surface membrane, then:
Em =
([Q ]i + [Q ]tVt ) , ( V ) (C m Am )
Q i = Q sm + Q tm , C l−1
(
)
Et =
−[Q ]tV t , (V) C m At
Q t = − Q tm . C l−1
These relationships encapsulate the principles that (a) intracellular charge may be associated with either 98
Cm or Ct; and (b) any deposition of charge on one plate of Ct must be matched by an equal charge flowing from its opposing plate. These relationships incorporate the assumptions that (a) the outer surface of Cm is grounded via a pathway of insignificant resistance; and (b) the outer surface of Ct is grounded via a nonzero access resistance, RA, thereby allowing Em and Et to differ. Collectively, these assumptions imply that any alterations in Qt, for example because of currents across RA, are matched by equal alterations in charge on Cm, thereby completing a circuit to ground.
Membrane conductivity and muscle excitability
[Q ]i = F ([Na]i + [K ]i − [Cl ]i + z X[X ]i ) [Q ]t = F ([Na]t + [K ]t − [Cl ]t + [Z ]t ) ,
C l−1
where Vt is the volume of the t-system relative to the cell volume, Vc; and Z(t) denotes the fixed charge density within the t-tubules (C l1). It is implicit in these equations that the ionic activities of the mobile ions are 1. Sign conventions are as follows: the surface membrane potential (Em) is expressed as the potential of the intracellular space with respect to the ECF; and the t-system membrane potential (Et(n)) is expressed as the potential of the intracellular space with respect to the potential of the t-system lumen in each shell, n. To calculate transmembrane potentials when the t-system is modeled as multiple concentric shells, the excess charge within the t-system is simply summed, thus:
Em =
[Q ]i +
N
∑ [Q ]t(n )Vn
n =0
(C m Am )
E t(n ) =
−[Q ]t(n )V t C m At
, (V)
, (V)
where Vn (dimensionless) is the volume of each t-system shell, n, relative to the cell volume, and Vt is the volume of the t-system relative to cell volume. (c) Electrodiffusion of ions. In all cases, ionic movements
were calculated according to both the concentration gradient and the local electrical gradient. This contrasts with previous models of skeletal muscle fibers that consider either diffusional fluxes or electrical currents across t-system luminal resistances, but not both (Falk and Fatt, 1964; Freygang et al., 1964; Adrian and Peachey, 1973; Adrian and Marshall, 1976; Henneberg and Roberge, 1997). However, preliminary simulations demonstrated that AP activity resulted in alterations in both t-system ion concentrations and t-system electrical potential, thereby necessitating the simulation of both diffusional and electrically driven ion movements. Transmembrane ionic fluxes were calculated using the Goldman flux equation (Goldman, 1943). Fluxes across RA and between t-system shells were calculated as the sum of electrical drift and diffusional fluxes: J S((n -1)→n ) =
n
S
(
) , (mol s ) −1
where t is the t-system tortuosity factor (Wallinga et al., 1999) (dimensionless); An is the area of shell n (dm2); is the distance between successive t-system shells (dm); gt is the inter-shell conductance (S dm1) for shell n; [S]n/[C]n is the concentration of S relative to the total mobile ion concentration within shell n (dimensionless), such that each ionic species, S, contributes an appropriate �
D [S ] − E J S(e→ 0) = Am ([S ]e − [S ]0 ) + 0 0 , mol l−1s −1 R g [ C ]0 R A zS F A t
(
)
where the D/RAgt term ensures that the ratio between the diffusive and electrical components of the flux across RA is equal to that between t-system shells. (d) Osmotic equilibrium at steady state. Fraser and Huang
V t σt An [S ]n Et(n −1) − Et(n ) + D [S ](n −1) − [S ](n ) ∆ g t(n ) [C ] z F
proportion of the total conductance; and D is the diffusion coefficient (dm2 s1), assumed to be equal for all modeled ions. Fluxes across RA were calculated as follows:
(2004, 2007) showed that when the steady state of a CD model cell is constrained by the requirement for osmotic equilibrium at steady state, then the steadystate values of these variables were uniquely defined by the permeabilities and extracellular concentrations of each ion and by the Na+/K+ pump density. Furthermore, certain concentrations are tightly constrained at osmotic equilibrium. For example, when Cl is the only extracellular anion and therefore contributes half of the extracellular osmolality, [Cl]t must be equal to [Cl]e for t-system osmolality to be equal to extracellular osmolality. Thus, osmotic water movements are fundamental to ensure accurate steadystate behavior that is constrained to what is physically possible. This allows CD modeling to be used to simulate manipulations expected to have a large influence on ion concentrations, in contrast to models that do not reach true steady states (Fraser and Huang, 2007). Thus, transmembrane water fluxes were calculated as:
J H2O(a → b) = AmPH2O( b − a ),
where is the osmolality of each compartment and PH2O is the hydraulic permeability of the membrane, taken as 156 µm s1 (Frigeri et al., 2004). Water fluxes across RA and between t-system shells were assumed to be instantaneous to maintain osmotic equality in all extracellular compartments. It is clear from the profound changes in t-system volume with manipulations of extracellular ion concentrations or osmolality (Rapoport et al., 1969; Dulhunty, 1982; Chawla et al., 2002) that the t-system cannot be treated as a rigid structure. The model therefore allowed the t-system volume to be determined by the balance of osmotic fluxes across the t-system membrane and RA. This gave stable steady-state values when a small fixed negative charge term was included in the t-system and responded appropriately to changes in extracellular osmolality in preliminary experiments (unpublished data). Fraser et al.
99
Simulation of cable properties and AP firing
A length of muscle fiber was simulated as 99 identical segments. Ion concentrations and membrane potentials were calculated for each segment as described above. Inter-compartment ion fluxes were calculated for each intracellular ionic species according to the prevailing electrical gradient between segments:
J S(x →(x +1)) =
Ax R LzS FV x
E m(x ) − E m(x +1) −3 −1 , (mol dm s ) ∆L
where Ax is the membrane area of compartment x (dm2), Vx is its volume (dm3), RL is the longitudinal resistance, and L is the distance between the centers of adjacent compartments. As each segment was identical, ion concentrations did not differ significantly between adjacent segments; therefore, it was not necessary to include a diffusional flux term. The simulations were performed using a 100-µm segment length. Initial simulations to determine the optimal segment length compared the behavior of model fibers with 100-µm segment lengths to those with 10-µm segment lengths. Over a range of frequencies from 25 to 3,000 Hz, frequency–velocity relationships for passive sinusoidal currents were not influenced by this change in segment length (difference in velocity 100% for 50 mM (GK/GCl = 0.66) when compared with that in solutions of 127 mM (GK/GCl = 0.11). Both experimental and model muscle fibers showed myotonic behavior in zero[Cl] solutions; therefore, a small dose of TTX (108 M) was added in the experiments, and a 50% reduction in PNa(max) was applied to the model. Despite this manipulation, Cl-free solutions increased the depolarization by 410% in the model and 540% in the experimental studies. This close agreement between the membrane potential 114
Membrane conductivity and muscle excitability
records of the model and the experiments prompted detailed analysis of the influence of Cl reduction upon t-system K+ homeostasis using the model. Reduced [Cl] was associated with only minor increases in the concentration of t-system K+ during the AP trains. Thus, under normal conditions, Cl influences the resting membrane potential during AP trains by maintaining a high GCl/GK, such that the influence of t-system K+ accumulation on the surface membrane potential is small. Finally, modeling and experimental membrane potential measurements were used to demonstrate and quantify the influence of the physiological Phase I and Phase II changes in GCl and GK upon membrane depolarization and t-system K+ accumulation that occur during repetitive AP firing. The Phase I reduction in GCl was shown to approximately double the magnitude of the resting potential depolarization during 15-Hz stimulation in both model and experiment, similar to the influence of reduced extracellular [Cl]. The model also indicated an increase in t-system K+ accumulation from 10 to 11.5 mM. The Phase II increase in GK and GCl produced a smaller increase in baseline depolarization during 15-Hz AP trains, although the model slightly underestimated the magnitude of the experimentally observed increase. The model showed a large reduction in t-system K+ accumulation during Phase II, to a peak of 7.5 mM compared with 10 mM under control conditions. Thus, during Phase II, depolarization is increased despite a smaller rise in K+. Indeed, a biphasic relationship was found for the influence of GCl values on the membrane potential during AP firing, such that both decreases and increases in GCl in the physiological range increase the resting potential depolarization during AP trains. The effect of a reduction in GCl was shown to result from a shift of the membrane potential closer to EK, which is depolarized during activity because of increased [K+]t. In contrast, an increase in GCl was shown to produce a large contribution of Cl currents to AP repolarization, thereby causing intracellular Cl accumulation and hence a depolarization of ECl. Phase II also increased the rate of recovery to normal values of [K+]t after activity. However, the presence of high background ion conductances during AP firing in Phase II produced increases in both inward and outward K+ movements. Thus, although Phase II GM changes appear to accelerate reuptake of K+ from the t-system into the cell and thereby enhance recovery of normal ionic concentrations, they also appear to reduce the energy efficiency of APs by increasing the total ionic fluxes required for each AP. This study therefore provides a quantitative analysis, supported by experimental results, of the relationships between resting conductances, excitability, and t-system ionic homeostasis in skeletal muscle. It demonstrates that active signal regeneration within the t-system produces K+ accumulation and quantifies the relationship
between this and the depolarization of the resting membrane potential that is observed during trains of APs. It shows that the Phase I 60% decrease in GM during repetitive AP firing enhances endplate and t-system excitability, while also increasing the magnitude of t-system K+ accumulation and approximately doubling the membrane potential depolarization during AP trains. In contrast, the Phase II increase in GM decreases endplate and t-system excitability and also enhances K+ reuptake from the t-system, thereby reducing K+ accumulation during AP trains. Yet, Phase II also increases the resting potential depolarization during AP trains because of intracellular Cl accumulation. The model that is described here therefore reproduces predictions of electrophysiological behavior and ion concentrations, at rest and during activity, within both the sarcoplasm and the t-system, that are in full agreement with experimental and prior theoretical results. In so doing, it reveals the mechanisms of observed changes including baseline resting potential depolarization during AP trains. Furthermore, it provides a platform for further exploration of electrophysiological activity in skeletal muscle that is applicable where steady-state ion concentrations are not known or expected to undergo significant change. This, in contrast to existing models, permits analysis of the influence of activity-related, genetic, and pharmacological manipulations to the normal physiological state. J.A. Fraser is supported by a David Phillips Fellowship from the Biotechnology and Biological Sciences Research Council (UK). C.L.-H. Huang acknowledges the support of the British Medical Research Council, the Wellcome Trust, and the British Heart Foundation. T.H. Pedersen acknowledges the support of the Danish Medical Research Council. Christopher Miller served as editor. Submitted: 15 February 2011 Accepted: 29 May 2011
REFERENCES Adrian, R.H., and M.W. Marshall. 1976. Action potentials reconstructed in normal and myotonic muscle fibres. J. Physiol. 258:125–143. Adrian, R.H., and L.D. Peachey. 1973. Reconstruction of the action potential of frog sartorius muscle. J. Physiol. 235:103–131. Almers, W. 1980. Potassium concentration changes in the transverse tubules of vertebrate skeletal muscle. Fed. Proc. 39:1527–1532. Bezanilla, F., C. Caputo, H. Gonzalez-Serratos, and R.A. Venosa. 1972. Sodium dependence of the inward spread of activation in isolated twitch muscle fibres of the frog. J. Physiol. 223:507–523. Cannon, S.C., R.H. Brown Jr., and D.P. Corey. 1993. Theoretical reconstruction of myotonia and paralysis caused by incomplete inactivation of sodium channels. Biophys. J. 65:270–288. doi:10.1016/ S0006-3495(93)81045-2 Chawla, S., J.N. Skepper, J.A. Fraser, and C.L. Huang. 2002. Osmotic processes in vacuolation and detubulation of skeletal muscle. Cell Biol. Int. 26:905–910. doi:10.1006/cbir.2002.0944 �
Dulhunty, A.F. 1979. Distribution of potassium and chloride permeability over the surface and T-tubule membranes of mammalian skeletal muscle. J. Membr. Biol. 45:293–310. doi:10.1007/ BF01869290 Dulhunty, A. 1982. Effect of chloride withdrawal on the geometry of the T-tubules in amphibian and mammalian muscle. J. Membr. Biol. 67:81–90. doi:10.1007/BF01868650 Falk, G., and P. Fatt. 1964. Linear electrical properties of striated muscle fibres observed with intracellular electrodes. Proc. R. Soc. Lond. B Biol. Sci. 160:69–123. doi:10.1098/rspb.1964.0030 Fraser, J.A., and C.L. Huang. 2004. A quantitative analysis of cell volume and resting potential determination and regulation in excitable cells. J. Physiol. 559:459–478. doi:10.1113/jphysiol.2004 .065706 Fraser, J.A., and C.L. Huang. 2007. Quantitative techniques for steady-state calculation and dynamic integrated modelling of membrane potential and intracellular ion concentrations. Prog. Biophys. Mol. Biol. 94:336–372. doi:10.1016/j.pbiomolbio.2006 .10.001 Fraser, J.A., C.E. Middlebrook, J.A. Usher-Smith, C.J. Schwiening, and C.L. Huang. 2005a. The effect of intracellular acidification on the relationship between cell volume and membrane potential in amphibian skeletal muscle. J. Physiol. 563:745–764. doi:10.1113/ jphysiol.2004.079657 Fraser, J.A., C.E. Rang, J.A. Usher-Smith, and C.L. Huang. 2005b. Slow volume transients in amphibian skeletal muscle fibres studied in hypotonic solutions. J. Physiol. 564:51–63. doi:10.1113/ jphysiol.2004.080911 Freygang, W.H., Jr., D.A. Goldstein, D.C. Hellam, and L.D. Peachey. 1964. The relation between the late after-potential and the size of the transverse tubular system of frog muscle. J. Gen. Physiol. 48:235–263. doi:10.1085/jgp.48.2.235 Frigeri, A., G.P. Nicchia, R. Balena, B. Nico, and M. Svelto. 2004. Aquaporins in skeletal muscle: reassessment of the functional role of aquaporin-4. FASEB J. 18:905–907. Gage, P.W., and R.S. Eisenberg. 1967. Action potentials without contraction in frog skeletal muscle fibers with disrupted transverse tubules. Science. 158:1702–1703. doi:10.1126/science.158 .3809.1702 Gage, P.W., and R.S. Eisenberg. 1969. Capacitance of the surface and transverse tubular membrane of frog sartorius muscle fibers. J. Gen. Physiol. 53:265–278. doi:10.1085/jgp.53.3.265 Gallant, E.M., and R.C. Jordan. 1996. Porcine malignant hyperthermia: genotype and contractile threshold of immature muscles. Muscle Nerve. 19:68–73. doi:10.1002/(SICI)1097-4598(199601)19:13.0.CO;2-6 Goldman, D.E. 1943. Potential, impedance and rectification in membranes. J. Gen. Physiol. 27:37–60. doi:10.1085/jgp.27.1.37 Henneberg, K.A., and F.A. Roberge. 1997. Simulation of propagation along an isolated skeletal muscle fiber in an isotropic volume conductor. Ann. Biomed. Eng. 25:15–28. doi:10.1007/BF02738535 Hernandez, J., J. Fischbarg, and L.S. Liebovitch. 1989. Kinetic model of the effects of electrogenic enzymes on the membrane potential. J. Theor. Biol. 137:113–125. doi:10.1016/S0022-5193(89)80153-5 Hodgkin, A.L., and A.F. Huxley. 1952. A quantitative description of membrane current and its application to conduction and excitation in nerve. J. Physiol. 117:500–544. Huang, C.L., and L.D. Peachey. 1989. Anatomical distribution of voltage-dependent membrane capacitance in frog skeletal muscle fibers. J. Gen. Physiol. 93:565–584. doi:10.1085/jgp.93.3.565 Macdonald, W.A., T.H. Pedersen, T. Clausen, and O.B. Nielsen. 2005. N-Benzyl-p-toluene sulphonamide allows the recording of trains of intracellular action potentials from nerve-stimulated intact fast-twitch skeletal muscle of the rat. Exp. Physiol. 90:815–825. doi:10.1113/expphysiol.2005.031435 Fraser et al.
115
Mohr, M., N. Nordsborg, J.J. Nielsen, L.D. Pedersen, C. Fischer, P. Krustrup, and J. Bangsbo. 2004. Potassium kinetics in human muscle interstitium during repeated intense exercise in relation to fatigue. Pflugers Arch. 448:452–456. doi:10.1007/s00424004-1257-6 Nordsborg, N., J. Ovesen, M. Thomassen, M. Zangenberg, C. Jøns, F.M. Iaia, J.J. Nielsen, and J. Bangsbo. 2008. Effect of dexamethasone on skeletal muscle Na+,K+ pump subunit specific expression and K+ homeostasis during exercise in humans. J. Physiol. 586:1447–1459. doi:10.1113/jphysiol.2007.143073 Overgaard, K., and O.B. Nielsen. 2001. Activity-induced recovery of excitability in K+-depressed rat soleus muscle. Am. J. Physiol. Regul. Integr. Comp. Physiol. 280:R48–R55. Pedersen, T.H., O.B. Nielsen, G.D. Lamb, and D.G. Stephenson. 2004. Intracellular acidosis enhances the excitability of working muscle. Science. 305:1144–1147. doi:10.1126/science.1101141 Pedersen, T.H., F. de Paoli, and O.B. Nielsen. 2005. Increased excitability of acidified skeletal muscle: role of chloride conductance. J. Gen. Physiol. 125:237–246. doi:10.1085/jgp.200409173 Pedersen, T.H., F.V. de Paoli, J.A. Flatman, and O.B. Nielsen. 2009a. Regulation of ClC-1 and KATP channels in action potential–firing fast-twitch muscle fibers. J. Gen. Physiol. 134:309–322. doi:10.1085/jgp.200910290 Pedersen, T.H., W.A. Macdonald, F.V. de Paoli, I.S. Gurung, and O.B. Nielsen. 2009b. Comparison of regulated passive membrane
116
Membrane conductivity and muscle excitability
conductance in action potential–firing fast- and slow-twitch muscle. J. Gen. Physiol. 134:323–337. doi:10.1085/jgp.200910291 Pedersen, T.H., C.L.-H. Huang, and J.A. Fraser. 2011. An analysis of the relationships between subthreshold electrical properties and excitability in skeletal muscle. J. Gen. Physiol. 138:73–93. Posterino, G.S., G.D. Lamb, and D.G. Stephenson. 2000. Twitch and tetanic force responses and longitudinal propagation of action potentials in skinned skeletal muscle fibres of the rat. J. Physiol. 527:131–137. doi:10.1111/j.1469-7793.2000.t01-2-00131.x Rapoport, S.I., L.D. Peachey, and D.A. Goldstein. 1969. Swelling of the transverse tubular system in frog sartorius. J. Gen. Physiol. 54:166–177. doi:10.1085/jgp.54.2.166 Sejersted, O.M., and G. Sjøgaard. 2000. Dynamics and consequences of potassium shifts in skeletal muscle and heart during exercise. Physiol. Rev. 80:1411–1481. Shorten, P.R., and T.K. Soboleva. 2007. Anomalous ion diffusion within skeletal muscle transverse tubule networks. Theor. Biol. Med. Model. 4:18. doi:10.1186/1742-4682-4-18 Sjøgaard, G. 1990. Exercise-induced muscle fatigue: the significance of potassium. Acta Physiol. Scand. Suppl. 593:1–63. Wallinga, W., S.L. Meijer, M.J. Alberink, M. Vliek, E.D. Wienk, and D.L. Ypey. 1999. Modelling action potentials and membrane currents of mammalian skeletal muscle fibres in coherence with potassium concentration changes in the T-tubular system. Eur. Biophys. J. 28:317–329. doi:10.1007/s002490050214