RELIABILITY AND LONG TERM PERFORMANCE OF THE FIRST GRID-CONNECTED, BUILDING-INTEGRATED AMORPHOUS SILICON PV INSTALLATION IN BRAZIL 1,2
1
2
2
R. Rüther , T. S. Viana , I. T. Salamoni 2 LABSOLAR – Laboratório de Energia Solar & LabEEE – Laboratório de Eficiência Energética em Edificações, Universidade Federal de Santa Catarina/UFSC, Caixa Postal 476, Florianópolis – SC, 88040-900 BRAZIL Tel.: +55 48 3721 5174 FAX: +55 48 3721 7615 Email:
[email protected]
ABSTRACT In this paper we present the performance assessment of the first building-integrated, grid-connected PV installation in Brazil. The 2kWp, thin-film a-Si system is fully monitored, and has been operating continuously since 1997. We show performance results over the 10years period, and discuss reliability issues related to the continuous operation of this distributed energy source in the urban environment of a metropolitan state capital in Brazil. With these performance results, we also perform an economic analysis and a grid-parity study to make the case for grid-connected PV in a developing country. We present scenarios where conventional residential electricity tariffs and PV-generated power reach parity within the next 10 years in most regions in Brazil.
INTRODUCTION This paper follows up on reporting and demonstrating the reliable operation, and the continuous performance monitoring, of the first grid-connected, building-integrated, thin-film PV system installed in Brazil in 1997 [1, 2]. The 2kWp BIPV installation was retrofitted to the Solar Energy Research Laboratory (LABSOLAR) building, and includes a mix of 54 opaque and 14 semitransparent, doublejunction, same bandgap, unframed a-Si PV glass-glass laminates, irradiation and temperature instrumentation and data acquisition system. Since system start up, electrical parameters (DC and AC), horizontal and planeof-array irradiation and ambient and back-of-module 2 temperatures are logged at 4-minute intervals. The 40m o BIPV installation faces true north at latitude tilt (27 ), and is located next to the Baseline Surface Radiation Network (BSRN) solar radiation measurement facilities that LABSOLAR hosts for the World Meteorological Organization (WMO).
EXPERIMENTAL The PV system design and configuration, as well as the reliable and consistent performance of the a-Si thinfilm installation in the warm Brazilian climate, has been presented in detail elsewhere [1-4]. In this paper we present the performance assessment of the installation over the 10-years period, and discuss reliability issues related to the continuous operation of this distributed
978-1-4244-1641-7/08/$25.00 ©2008 IEEE
energy source in the urban environment of a metropolitan state capital in Brazil. We also make the case for gridconnected PV in a developing country. Grid-connected PV is usually perceived as an energy technology for developed countries, whereas isolated, stand-alone PV is seen as more suited for applications in developing nations, where so many individuals still lack access to the public grid. However, the traditional utility concept relies on a relatively small number of considerably large power plants, which are not necessarily close to the urban centers where energy is consumed. In a large country like 2 Brazil (8.5 million km ), transmission and distribution (T&D) infrastructure and associated losses are not negligible, and utilities could benefit from PV distributed generation [5-7]. Despite positive aspects political barriers and costs still restrain diffusion of grid-connected PV systems in developing countries. Especially in Brazil, even with lack of legislation and technical standards for PV grid- connected systems, costs are the main aspect though price reductions are expected and forecasted [8, 9]. Along with PV expected costs reduction, conventional electricity prices are increasing. We present a study showing that residential tariffs and PV electricity costs should reach grid-parity sometime in the next 10 years in Brazil.
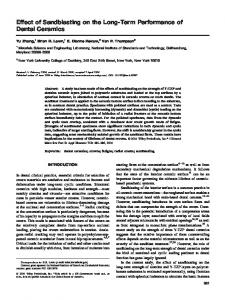
RESULTS AND DISCUSSION After the initial and strong degradation experienced in the first months of outdoor exposure, which is typical of thin-film a-Si PV, performance levels have reached stabilized values. After this initial decay in output power, and over the 10-years period, total system performance has decreased around 1%/year. In the 10-years period since start up, the BIPV installation operated continuously, with minimum downtime, and system reliability was higher than expected. During the year 1999, one of the four linecommutated, 650W sine wave inverters presented problems and had its power PCB exchanged by the manufacturer. This resulted in a limited downtime of ¼ of the total system output, and a question on system design and configuration: the four sub-system design strategy was originally adopted in order to minimize total system downtime and output losses in case of inverter failure and because the PV system uses inverters made overseas. The choice was made of using four separate 650W linecommutated sinewave inverters, as shown in figure 1, instead of one inverter with the total PV system power
rating. Furthermore, in case one inverter fails, the PV modules connected to that inverter could be reassigned and distributed among the remaining three, since each inverter (650W continuous maximum power rating) is fed by ~500Wp maximum in the present configuration. With the high uptime and system reliability observed over the last 10 years, it can be argued that this might be an unnecessary system design strategy, and that one single, 2000W inverter, could be used instead. The four inverters operated at a consistently high (90% on average) DC-AC efficiency, demonstrating a high level of reliability and robustness.
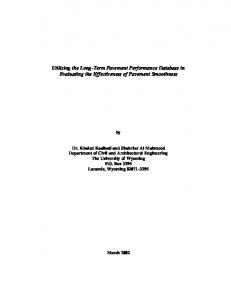
the higher operating temperatures (partial thermal annealing of the light-induced degradation) and spectral effects (lower Air Mass values in summer, leading to “bluer” spectra which are beneficial to a-Si). Over the 10 years of continuous operation the PV system, output performance presented an AC performance ratio (PR = ratio of the actual AC performance over the nameplate-rated, DC performance at standard test conditions) ranging from 85% in the first year, to 76% in 2007, as shown in figure 3.
Performance Ratio (PR) 100% 90% 80% 70% 60% 50% 40% 30% 20%
2007
2006
2005
2004
2003
2002
2001
2000
1999
1998
10% 0%
Year
Fig. 3. AC performance ratio of the BIPV installation over 10years of continuous operation. Fig. 1. Schematic diagram for the 2kWp, grid-connected, building-integrated thin film a-Si system. The continuous 40m2 surface can be seen here as four independent 500Wp parallelconnected sub-systems, each feeding a separate 650W inverter. The whole system is continuously monitored, with data logged at 4 minutes intervals.
Figure 2 shows energy generation, radiation at the site and system yield over the 10-years period. During the 10-years period, system performance over the first months was strongly marked by the light-induced degradation effect (Staebler-Wronski effect [10]). Generation (kWh) Radiation (kWh/m 2) Yield (kWh/kWp)
TOWARDS GRID PARITY IN BRAZIL
2500 2000 1500 1000 500
2007
2006
2005
2004
2003
2002
2001
2000
1999
0 1998
Over the years it has been our experience that manual washing of PV modules on an annual basis leads to only small energy gains in comparison with natural o washing by rainfall at the site in Florianopolis (27 S). On a weekly basis, however, dry periods led to considerable soiling of the PV modules surfaces, with a corresponding drop in output performance that was recovered after modules were naturally washed by the next rain. Since PV modules were only washed by rainfall, the effect of dust and dirt on module surfaces, as well as of slight variations in module and ambient temperatures, are all contributing to the results presented.
Year
Fig. 2. Energy generation, radiation at the site and system yield over a 10-years period.
After the light-induced degradation period the system performance shows a seasonal variation typical of a-Si [11], with higher relative output in summer months, due to
978-1-4244-1641-7/08/$25.00 ©2008 IEEE
In figures 4 to 8 we show the result of an economic analysis for the assessment of grid-parity between gridconnected PV and residential tariffs in Brazil for the next 10 years. We assume the performance of the PV installation described in this paper, the local solar radiation resource based on the Brazilian Atlas of Solar Energy [12], a PV cost reduction of 5%/year based on the learning curve of the PV technology, a conservative estimate of 2%/year and 4%/year increase in conventional electricity tariffs, current residential tariffs at each state, and discount rates of 9% and 7%. Our estimates point to grid-parity in most of the national territory towards the end of the next decade. Figure 4 takes into account a 2% annual conventional tariff increase and a discount rate of 9%, which is higher than the interest rate of a typical savings account in Brazil,
and could be considered to be an attractive rate. Under these conditions, grid-parity would be reached in 2017 in only four states, including Minas Gerais (MG), the state with the highest residential tariffs in the country.
If we consider the same conditions as in figure 4, but a 4% annual increase in residential tariffs, figure 5 shows that a larger number of states reach grid-parity in 2017, including most of the sunny state-capitals of the Brazilian northeast. A 10 years, 1GWp PV roofs incentive program (installing 100MWp/year) for Brazil, to assist transitioning to grid-parity, while gaining experience in a more widespread application of distributed PV, would cost, over 25 years in premium tariffs payments, some 7.6 billion Euros. Figure 6 shows the considerable impact of the cost of money on financing the capital-intensive PV technology. Increasing the discount rate to 12% will lead to grid-parity being reached in 2017 only in the three states (TO, MG and MS) where conventional residential tariffs are highest. Under these conditions, the same 1GWp incentive rooftop PV program would require, over 25 years in premium tariffs payments, nearly 10 billion Euros.
Fig. 4. Brazilian states with grid parity (hatched areas) for a 2% annual conventional tariff increase, and a discount rate of 9%. Under these conditions, grid-parity would be reached in 2017 in only four states.
Fig. 6. Brazilian states with grid-parity being reached in 2017 with 12% discount rate and 4% annual increase in residential tariffs.
If the discount rate is set to a more reasonable 7% and conventional tariffs increase at an annual rate of 4%, figures 7 and 8 show that already in 2015 a considerable portion of the sunniest areas in the country can reach grid parity, and that in 2017 most Brazilians could be able to install PV at the same cost as conventional electricity.
Fig. 5. States that reach grid-parity in 2017 (hatched areas), including most of the sunny state-capitals of the Brazilian northeast, for the same conditions as in figure 4, but with a 4% annual increase in residential tariffs.
978-1-4244-1641-7/08/$25.00 ©2008 IEEE
CONCLUSIONS We have reported on the continuous operation of the first grid-connected, thin-film PV installation in Brazil. The consistent and reliable performance of the a-Si PV system reported in this paper demonstrates that this technology is well suited for BIPV installations in the urban environment in Brazil. For more information on aspects regarding the superior performance of a-Si in warm climates, see also [13] in this Conference. We have also presented an economic analysis showing that in the next 10 years, PV is expected to become cost competitive with conventional electricity prices in many areas in Brazil. The performance parameters of the 2kWp PV system can be checked in real time over the internet at .
ACKNOWLEDGMENTS Fig. 7. Areas in the country (hatched) that can reach grid parity, already in 2015, with 7% discount rate and conventional tariffs increase at an annual rate of 4%.
R. Rüther wishes to acknowledge with thanks the Alexander von Humboldt Foundation for sponsoring this project.
REFERENCES [1] R. Rüther, “Experiences and operational results of the first grid-connected, building-integrated, thin-film nd photovoltaic installation in Brazil”, 2 World Conference on Photovoltaic Solar Energy Conversion, WCPEC2, Vienna, Austria, 1998. [2] R. Rüther and M. Dacoregio, “Performance assessment of a 2kWp grid-connected, buildingintegrated, amorphous silicon solar photovoltaic installation in Brazil”, Progress in Photovoltaics: Research and Applications, 8, 2000. [3] R. Rüther, “Demonstrating the Superior Performance of Thin-Film, Amorphous Silicon for Building-Integrated PV Systems in Warm Climates”, International Solar Energy Society’s 1999 Solar World Congress, ISES, Jerusalem, 1999.
Fig. 8. States with grid parity in 2017 (hatched), with 7% discount rate and conventional tariffs increase at an annual rate of 4%. Under these conditions, only one state (AP) would not reach grid parity by 2017.
[4] R. Rüther, P. Knob, H.G. Beyer, M.M. Dacoregio and A. Montenegro, “High Performance Ratios of a DoubleJunction a-Si BIPV Grid-Connected Installation After Five rd Years of Continuous Operation in Brazil”, 3 World Conference on PV Energy Conversion, WCPEC3, Osaka, Japan, 2003. [5] R. Perez, S. Letendre and C. Herig, “PV and Grid Reliability: Availability of PV Power during Capacity Shortfalls”, ASES Annual Conference, Washington, USA, 2001.
978-1-4244-1641-7/08/$25.00 ©2008 IEEE
[6] C.d.S. Jardim et al., “The strategic siting and the roofing area requirements of building-integrated photovoltaic solar energy generators in urban areas in Brazil”, Energy and Buildings, 40, 2008, pp. 365-370. [7] R. Rüther et al., “Potential of building integrated photovoltaic solar energy generators in assisting daytime peaking feeders in urban areas in Brazil”, Energy Conversion and Management, 49, 2008, pp. 1074-1079. [8] B.v.d. Zwaan, and A. Rabl, “The learning potential of photovoltaics: implications for energy policy”, Energy Policy, 32, 2004, pp. 1545-1554. [9] M.S. Keshner and R. Arya, “Study of Potential Cost Reductions Resulting from Super-Large-Scale Manufacturing of PV Modules”, National Renewable Energy Laboratory (NREL), Colorado, USA, 2004. [10] D.Staebler and C. Wronski, “Reversible Conductivity Changes in Discharge-Produced Amorphous Si”, Appl. Phys. Lett. 31, 292, 1977. [11] R. Rüther and J. Livingstone, “Seasonal variations in amorphous silicon solar module outputs and thin film characteristics”, Solar Energy Materials and Solar Cells, 36, 1994. [12] E.B. Pereira et al., “Atlas Brasileiro de Energia Solar (Brazilian Atlas of Solar Energy)”, Instituto Nacional de Pesquisas Espaciais, INPE, São José dos Campos, Brasil, 2006. [13] R. Rüther et al., “Performance Test of Amorphous Silicon Modules in Different Climates – Year Four: Progress in Understanding Exposure History Stabilization Effects”, this Conference.
978-1-4244-1641-7/08/$25.00 ©2008 IEEE