Future design rules for ship structures will be developed using reliability methods, and can be expressed in a special format such as the Load and Resistance ...
Reliability-Based Structural Design of Ships Using Load and Resistance Factor Design Approach Bilal M. Ayyub1 and Ibrahim A. Assakkaf2 ABSTRACT Future design rules for ship structures will be developed using reliability methods, and can be expressed in a special format such as the Load and Resistance Factor Design (LRFD) format. The main objective of this paper is to summarize the development methodology and results of reliability-based rules (i.e., LRFD rules) for ship structures that were performed for the U. S. Navy. The methodology for developing LRFD format for ship hull structural elements that was utilized in this paper consists of the following steps: (1) probabilistic characteristics of basic strength and load random variables that are used in structural design were analyzed. Values for these characteristics were recommended for reliability-based design purposes. They were determined based on the statistical analysis of data collected of these design parameters, on values recommended in other studies, or sometimes based on personal judgment. (2) Different load combinations were established and presented with combination and correlation factors, these combinations included the stillwater bending, wave-induced, and wave dynamic bending moments. The correlation between these different load components was accounted for and expressed in the form of correlation factors. (3) Limit states for these load combinations were established based on structural modes of failures. (4) A comparison among different design practices were conducted based on the determination of the nominal values of strength and load values for ship structures to recommend the format required for each design variable. Methods for determining the design (nominal) values of both strength and load variables were presented as detailed calculation procedures. (5) Target reliability levels as used in other studies were summarized and ranges of target reliability levels were selected for the limit states. (6) Partial safety factors for the ranges of target reliability levels were calculated based on level 2 reliability methods. The paper includes a detailed description of the methodology, and sample rules for ship structures with computational examples. Presentation 1. INTRODUCTION The U.S. marine transportation industry can improve its process for designing systems, subsystems, and components on which its operations depend by utilizing risk-based methods and tools. In an environment of increasingly complex engineering systems, the concern about the operational safety of these systems continues to play a major role in both their design and operation. A systematic, quantitative approach for assessing the failure probabilities and consequences of engineering systems is needed. Such an approach allows an engineer to
expediently and easily evaluate complex engineering systems for safety and risk under different operational conditions with relative ease. The ability to quantitatively evaluate these systems helps reduce the cost of unnecessary and often expensive re-engineering, repair or replacement of the system. The results of risk analysis can also be utilized in decision analysis problems that are based on cost-benefit tradeoffs. For marine systems, there are many influences that affect their safety. Numerous sources of risk include
1
Professor and Director, Center for Technology and Systems Management, Department of Civil and Environmental Engineering, University of Maryland, College Park, Maryland.
Director of Reliability Research, Instructor, Center for Technology and Systems Management, Department of Civil and Environmental Engineering, University of Maryland, College Park, Maryland 2
1
equipment failure, external events, human errors, and institutional errors. Equipment failure is the most recognized hazard on ships and can be divided into several sub-categories including independent failures and common cause failures. An example of independent equipment failure is the loss of steering due to failure of a power steering pump. An example of a common cause failure includes the loss of propulsion and steering that would result from a total loss of electrical power to the ship. Risk from external events are caused by the hazards such as collision by other ships, sea state, wind, ice, or weather factors. Humans provide another source of risk to ships due to lack of skill, mistakes, fatigue, or sabotage. Institutional failure represents risks from poor management including training, management attitude, poor communications, and poor morale. Risk studies can be classified into risk assessment, risk management, and risk communication. These aspects of risk studies are described under subsequent sections. The objective of introducing these concepts is to prepare users and readers of these guidelines for performing riskbased analysis of marine systems. These guidelines can also be used for developing risk-based standards for system safety. The relationship between risk and standards is not new and its definition is dependent on the point of view of an observer. To better appreciate this dilemma we must take a look at the risk and standards from a historical perspective. People have always sought to eliminate unwanted risk to health and safety, or at least control it. Great successes have been achieved in controlling risk, as evidenced by advances made in the development of building methods of skyscrapers and long span bridges or super tankers capable of withstanding powerful storms. Yet some of the familiar risks persist while others less familiar are found to escape our attention and new ones have appeared. Ironically, some of the risks that are most difficult to manage provide us with increased standards of living. The invention of automobile, the advent of air travel and space exploration, the development of synthetic chemicals, and introduction of nuclear power all are examples.
In this equation px is the occurrence probability of event x, and cx is the occurrence consequences or outcomes of the event. Risk is commonly evaluated as the product of likelihood of occurrence and the impact of an accident: Consequenc e RISK = Time Event Consequenc e LIKELIHOOD × IMPACT Event Time
(2)
In the above equation, the likelihood can also be expressed as a probability. A plot of occurrence probabilities that can be annual and consequences is called the Farmer curve [1]. The risk for a system results from the interaction of natural hazards with a system, aging and degradation of the systems, and human and organizational factors. Consequently, risk can be classified into voluntary and involuntary depending whether the events leading to the risk are under the control of the persons at risk or not, respectively. Society, in general, accepts a higher level of voluntary risk than involuntary risk. The losses associated with events can be classified into reversible and irreversible such as property and human losses, respectively. The population-size effect should be considered in risk studies since society responds differently for risks associate with a large population in comparison to a small population. For example, a fatality rate of 1 in 100,000 per event for an affected population of 10 results in an expected fatality of 10-4 per event whereas the same fatality rate per event for an affected population of 10,000,000 results in an expected fatality of 100 per event. The impact of the two scenarios is the same on the society. The size of the population at risk should be considered as a factor is setting the acceptable risk level. Risk methods can be classified into risk management that includes risk assessment and risk control, and risk communication as shown in Figure 1. The risk assessment includes risk analysis and risk evaluation. The risk analysis consists of hazard Risk Methods
1.1 Risk Methods The concept of risk is used to assess and evaluate uncertainties associated with an event. Risk can be defined as the potential of losses as a result of a system failure, and can be measured as a pair of the probability of occurrence of an event, and the outcomes or consequences associated with the event’s occurrence. This pairing can be represented by the following equation: Risk ≡ [( p1 ,C1 )(, p 2 ,C 2 ),..., ( p x ,C x )]
(1)
Risk Management
Risk Assessment
Risk Analysis: Hazard Identification Risk Estimation
Risk Communication
Risk Control:
Engineering Community
Decision Making Monitoring
Risk Evaluation:
Media and Public
Risk Acceptance Option Analysis
Figure 1. Risk Methods
2
identification, event-probability assessment, and consequence assessment. Risk evaluation requires the definition of acceptable risk, and comparative evaluation of options and/or alternatives. The risk control can be achieved through monitoring and decision analysis. Risk communication depends on the targeted audience, hence, classified into risk communication to the media and the public and to the engineering community. The risk assessment process answers three questions including: (a) What can go wrong? (b)What is the likelihood that it will go wrong? (c) What are the consequences if it does go wrong?. In order to perform risk assessment several methods have been created including: Preliminary Hazard Analysis (PrHA), HAZOP, Failure Modes and Effects Analysis (FMEA), Failure Modes Effects, and Criticality Analysis (FMECA), Fault Tree Analysis (FTA), and Event Tree Analysis (ETA). Each of these methods of risk assessment is suitable in certain stages of the system life-cycle. The characteristics of these methods are shown in Table 1. Other methods for reliability and consequence analysis and assessment are described in [2]. The reliability of a system can be improved or hindered by the combination of individual elements in a system. Therefore, the occurrence probability and consequence are used to determine the risk associated with the system. When applying risk-based technology (RBT) methods to system safety analysis, the following interdependent primary activities are to be considered: (a) risk assessment, (b) risk management, and (c) risk communication. These activities when applied consistently provide a useful means for developing safety guidelines and requirements to the point where hazards are controlled at predetermined levels. Risk assessment is a technical and scientific process by which the risk of given situations for a system are modeled and quantified. Risk assessment provides qualitative and quantitative data to decision makers for later use in risk management. Selected and commonly used risk assessment methods are shown in Table 1. These methods can also be divided into how the risk is determined by quantitative or qualitative analysis. Qualitative risk analysis uses expert opinion to evaluate the probability and consequence of a hazard. Quantitative analysis relies on statistical methods and databases that identify the probability and consequence of a hazard. Safety Review/Audit, Checklist, What-If, Preliminary Hazard Analysis and HAZOP are normally considered qualitative techniques. Failure Modes and Effects Analysis, Fault Tree, and Event Tree are generally considered quantitative risk assessment techniques. The selection of a quantitative or qualitative method depends upon the availability of data for evaluating the hazard and the level of comfort of those performing the risk assessments.
Table 1. Risk Assessment Methods Safety/Review Audit Identify equipment conditions or operating procedures that could lead to a casualty or result in property damage or environmental impacts. Checklist Ensure that organizations are complying with standard practices. What-If Identify hazards, hazardous situations, or specific accident events that could result in undesirable consequences. Hazard and Operability Study (HAZOP) Identify system deviations and their causes that can lead to undesirable consequences. Determine recommended actions to reduce the frequency and/or consequences of the deviations. Failure Modes and Effects Analysis (FMEA) Identifies the components (equipment) failure modes and the impacts on the surrounding components and the system. Failure Modes Effects, and Criticality Analysis (FMECA) Identifies the components (equipment) failure modes and the impacts on the surrounding components and the system, and criticality of failures. Fault Tree Analysis (FTA) Identify combinations of equipment failures and human errors that can result in an accident. Event Tree Analysis (ETA) Identify various sequences of events, both failures and successes, that can lead to an accident. Preliminary Hazard Analysis (PrHA) Identify and prioritize hazards leading to undesirable consequences early in the life of a system. Determine recommended actions to reduce the frequency and/or consequences of prioritized hazards. Consequence Assessment and Cause Consequence Diagrams Assess consequences and scenarios leading to them.
Risk management is the process by which system operators, managers, and owners make safety decisions, regulatory changes, and choose different system configurations based on the data generated in the risk assessment. Risk management involves using information from the previously described risk assessment stage to make educated decisions about different configurations and operational parameters of a system. Therefore, the safety of the system can be maintained, and the involved risks in operating the system can be controlled.
3
Risk management makes decisions based on risk assessment and other considerations including economical, political, environmental, legal, reliability, producibility, safety, and other factors. Despite society attempt at preventing accidents, governmental agencies can be reactive in the development of regulations. The answer to the question "How Safe is safe enough?" is difficult and changing due to different perceptions and understandings of risk. Unfortunately, it often takes a disaster to stimulate action for safety issues. Although communication is necessary, it is important that risk management is separate from risk assessment in order to lend credibility to the assessment of risk without biasing the evaluation in consideration for other factors. Especially in a qualitative assessment of risk where "expert judgment" plays a role in decisions, it is important to allow the risk assessors to be free of the "political' pressures that managers encounter. However, there must be communication linking the risk assessors and risk managers together. The risk assessors need to assist the risk managers in making a decision. While the managers should not be involved in making any risk assessment, they should be involved in presenting to the assessors what needs to be answered. In order to determine "acceptable risk" there are several steps that should be considered [1]: (a) define alternatives, (b) specify the objectives and measures for effectiveness, (c) identify consequences of alternative, (d) quantify values for consequences, and (e) analyze alternatives to select the best choice. Risk managers need to weigh various other factors. For example, a manager might make a decision based on cost and risk using decision trees [3]. Risk communication can be defined as an interactive process of exchange of information and opinion among individuals, groups, and institutions. This definition of risk communication delineates it from risk-message transmittal from experts to non-experts. Risk communication should be an interactive, i.e., two-way, process [4]. However, this definition does not make it easy because technical information about controversial issues needs to be skillfully delivered by risk managers and communicators who might be viewed as adversaries to the public. Risk communication between risk assessors and risk managers is necessary to effectively apply risk assessments in decision-making. Risk managers must participate in determining the criteria for determining what risk is acceptable and unacceptable. This communication between the risk managers and risk assessors is necessary for a better understanding of risk analysis in making decisions. Risk communication provides the vital link between the risk assessors, risk managers, and the public to help understand risk. However, there is a common misconception that risk communication can lead to harmony among the involved parties, which is not
necessarily true all the time. Risk communication is a complex dynamic process that needs to be handled with extreme care by experts especially after disasters. Risk managers need to establish contingency plans for risk communication of disasters. The added pressure by the media and public in a disaster situation can create miscommunication that might be difficult to undo or remedy. Reliability of a system can be defined as its ability to fulfill its design functions for a specified time period. This ability is commonly measured using probabilities. Reliability is, therefore, the occurrence probability of the complementary event to failure resulting into Reliability = 1 – Failure Probability
(3)
Based on this definition, reliability is one of the components of risk. Safety can be defined as the judgment of risk acceptability for the system making it a component of risk management. After performing risk and safety analysis, system improvement in terms of risk can be achieved in one or more ways: (a) consequence reduction in magnitude or uncertainty, (b) failure-probability reduction in magnitude or uncertainty, and (c) reexamination of acceptable risk. It is common in engineering that attention is given to failure-probability reduction in magnitude or uncertainty because it offers more system variables that can be controlled by analysts than the other two cases. As a result, it is common to perform reliability-based design of systems. However, the other two cases should be examined for possible solution since they might offer some innovative system improvement options. 1.2 Structural Design Structural design of ships needs to be performed within the framework of system design of ships that can be based on risk methods. In recent years, ship structural design has been moving toward a more rational and probability-based design procedure referred to as limit states design. Such a design procedure takes into account more information than deterministic methods in the design of structural components. This information includes uncertainties in the strength of various structural elements, in loads and load combinations, and modeling errors in analysis procedures. Probability-based design formats are more flexible and rational than working stress formats because they provide consistent levels of safety over various types of structures. In probability-based limit-state design, probabilistic methods are used to guide the selection of strength (resistance) factors and load factors, which account for the variability in the individual resistance and loads and give the desired overall level of reliability. The load and resistance factors (or called partial safety factors) are different for each type of load and resistance. Generally, the higher the uncertainty
4
associated with a load, the higher the corresponding load factor; and the higher the uncertainty associated with strength, the lower the corresponding strength factor. Ship designers can use the load and resistance factors in limit-state equations to account for uncertainties that might not be considered properly by deterministic methods without explicitly performing probabilistic analysis. For this reason, design criteria can be kept as simple as possible. Moreover, they should be developed in a form that is familiar to the users or designers, and should produce desired levels of uniformity in reliability among different types of structures, without departing drastically from an existing practice. There is no unique format for a design criterion. A criterion can be developed on probability bases in any format. In general, the basic approach to develop a reliability-based design rules is first to determine the relative reliability of designs based on current practice. This relative reliability can be expressed in terms of either a probability of failure or a reliability index. The reliability index for structural components normally varies between 2 and 6 [5]. By performing such reliability analyses for many structures, representative values of target reliability (or safety) index can be selected reflecting the average reliability implicit in current designs. Based on these values and by using reliability analysis again, it is possible to select partial safety factors for the loads and the strength random variables that can be used as a basis for developing the design requirements. For designing code provisions, the most common format is the use of load amplification factors and resistance reduction factors (partial safety factors), as represented by φR≥
n
∑ γ i Li
(4)
i =1
where φ = the resistance R reduction factor; γi = the partial load amplification factor; and Li = the load effect. In fact, the American Institute of Steel Construction (AISC) and other industries in this area have implemented this format. Also, a recommendation for the use of this format is given by the National Institute of Standards and Technology [6]. The First-Order Reliability Method (FORM) is commonly used to estimate the partial safety factors φ and γi for a specified target reliability index β0. This method was used to determine the partial safety factors associated with the recommended strength models for ship hull girders as demonstrated in this chapter. 2. RELIABILITY-BASED DESIGN METHODS The reliability-based design of ship structures requires the consideration of the following three components: (a) loads, (b) structural strength, and (c) methods of reliability analysis. These three components
are shown in Figure 2 in the form of several blocks for each. Also, the figure shows their logical sequence and interaction. There are two primary approaches for reliabilitybased design: (a) direct reliability-based design and (b) load and resistance factor design (LRFD) as shown in Figure 2 [7, 8]. The direct reliability-based design approach can include both Level 2 and/or Level 3 reliability methods. Level 2 reliability methods are based on the moments (mean and variance) of random variables and sometimes with a linear approximation of nonlinear limit states, whereas, Level 3 reliability methods use the complete probabilistic characteristics of the random variables. In some cases, Level 3 reliability analysis is not possible because of lack of complete information on the full probabilistic characteristics of the random variables. Also, computational difficulty in Level 3 methods sometimes discourages their uses. The LRFD approach is called a Level 1 reliability method. Level 1 reliability methods utilize partial safety factors (PSF) that are reliability based; but the methods do not require explicit use of the probabilistic description of the variables. 2.1 Reliability-Based Design Philosophy The design of any ship structural system or element must provide for adequate safety and proper functioning of that system or element regardless of what philosophy of design is used. The structural systems or elements must have adequate strength to permit proper functioning during their intended service life. The performance of a hull girder as presented in the paper is defined by a set of requirements stated in terms of tests and measurements of how well the hull girder serves various or intended functions over its service life. Reliability and risk measures can be considered as performance measures, specified as target reliability levels (or target reliability indices, β0’s). The selected reliability levels of a particular structural element reflect the probability of failure of that element. These levels can be set based on implied levels in the currently used design practice with some calibration, or based on cost benefit analysis. The reliability-based design approaches for a system start with the definition of a mission and an environment for a ship. Then, the general dimensions and arrangements, structural member sizes, scantlings, and details need to be assumed. The weight of the structure can then be estimated to ensure its conformance to a specified limit. Using an assumed operational-sea profile, the analysis of the ship produces a stochastic stillwater and wave-induced responses. The resulting responses can be adjusted using modeling uncertainty estimates that are based on any available results of full-scale or large-scale testing.
5
Operational-Sea Profile
Define Mission and Environment Linear or Nonlinear Structural Analysis
Operational-Sea Profile Define Principal Dimensions and General Arrangement
A
Assume Sizes, Scantlings & Details
Cumulative Damage
Stress Frequency Distribution Strength Reduction Factor
Estimate Weight
Select Fatigue Details
LRFD Load Amplification Factors Analysis of Ship Motion Development of Response (Load) and Strength Factors (Fig. 2) Modeling Uncertainty
Stillwater, and Wave-Induced Response
LRFD Response Combinations
Fatigue Data for Deatils Linear or Nonlinear Structural Analysis Temperature Deformation and Stresses Fracture Data Failure Probability in Fatigue
Failure Definition for Fracture
Failure Definition for Fatigue
Structural Analysis
Material Properties and Imperfections
Stochastic Response Combinations
Failure Definitions in Servicebability & Ultimate Strength for Plates, Panels, Grillages, and Hull Girder
Failure Probability in Fracture
No
Combined Response
Extreme Response Analysis
Stress Frequency Distribution
Fatigue Data for Details
Failure Probability in Serviceability or Ultimate Strength
Stresses or Forces for Plates, Panels, Grillages, and Hull Girder Temperature Strength Reduction Factor
Reduced Strength of Plates, Panels, Grillages, and Hull Girder
System Analysis to Obtain Failure Probability for Ship
Fatigue OK?
Fracture Data
Fracture OK? Yes No
A
A
No
Reliability Levels OK?
Yes
Revised Weight OK?
No
Strength OK?
A
Yes
No Yes
A
End
Direct Reliability-Based Design
Yes
End
Load and Resistance Factor Design (LRFD) Sheets
Figure 2. Reliability-based Design of Ship Structures [7, 8]
6
time frame. Mathematically, it is given by the following expression:
Density Function
Rc = P (g > 0.0 ) = P(R > L ) Strength (R)
Load (L)
Failure Region
Mean of L
Mean of R
Figure 3. Frequency Distribution of Strength R and Load L The reliability-based design procedure also requires defining performance functions that correspond to limit states for significant failure modes. In general, the problem can be considered as one of supply and demand. Failure of a structural element occurs when the supply (i.e., strength of the element) is less than the demand (i.e., loading on the element). On the other hand, the reliability of this element is achieved when the supply is greater than the demand. A generalized form for the performance function for a structural component is given by g = R−L
(5)
where g = performance function, R = strength (resistance), and L = loading on the structural element. The failure in this case is defined in the region where g is less than zero or R is less than L, that is g < 0.0 or R < L
(6)
whereas the reliability is defined in the region where g is greater than zero or R is greater than L, that is g > 0.0 or R > L
(7)
The reliability-based design approach as given assumes the strength R and the load L to be random variables. Typical frequency distributions of such random variables are shown in Figure 3. If R is greater than L, there will be a margin of safety. However, unless R is greater than L by a large amount, there is always a probability that L may exceed R. The shaded area in Figure 3 where the two curves for R and L overlap illustrates this. Due to the variability in both strength and loads, there is always a probability of failure that can be defined as P f = P (g < 0.0 ) = P(R < L )
(8)
The reliability of a system or a component can be defined as the probability that the system or the component meets some specified demands for a specified
(9)
where Pf = probability of the system or component and Rc = reliability of the system or component. The many advantages and benefits of using reliability-based design methods include the following: 1. They provide the means for the management of uncertainty in loading, strength, and degradation mechanisms. 2. They provide consistency in reliability. 3. They result in efficient and possibly economical use of materials. 4. They provide compatibility and reliability consistency across materials, such as, steel grades, aluminum and composites. 5. They allow for future changes as a result of gained information in prediction models, and material and load characterization. 6. They provide directional cosines and sensitivity factors that can be used for defining future research and development needs. 7. They allow for performing time-dependent reliability analysis that can form the basis for life expectancy assessment, life extension, and development of inspection and maintenance strategies. 8. They are consistent with other industries, AISC, ASHTO, ACI, API, ASME, …, etc. 9. They allow for performing system reliability analysis. 2.2 Direct Reliability-Based Design The direct reliability-based design method uses all available information about the basic variables (including correlation) and does not simplify the limit state in any manner. It requires performing spectral analysis and extreme analysis of the loads. In addition, linear or nonlinear structural analysis can be used to develop a stress frequency distribution. Then, stochastic load combinations can be performed. Linear or nonlinear structural analysis can then be used to obtain deformation and stress values. Serviceability and strength failure modes need to be considered at different levels of the ship, i.e., hull girder, grillage, panel, plate and detail. The appropriate loads, strength variables, and failure definitions need to be selected for each failure mode. Using reliability assessment methods such as FORM, reliability indices β’s for all modes at all levels need to be computed and compared with target reliability indices β 0' s. The relationship between the reliability index β and the probability of failure is given by Pf = 1 - Φ(β)
(10)
7
where Φ(.) = cumulative probability distribution function of the standard normal distribution, and β = reliability (safety) index. It is to be noted that Eq. 10 assumes all the random variables in the limit state equation to have normal probability distribution and the performance function is linear. However, in practice, it is common to deal with nonlinear performance functions with a relatively small level of linearity. If this is the case, then the error in estimating the probability of failure Pf is very small, and thus for all practical purposes, Eq. 10 can be used to evaluate Pf with sufficient accuracy [3]. 2.3 Load and Resistance Factor Design The second approach (LRFD) of reliability-based design consists of the requirement that a factored (reduced) strength of a structural component is larger than a linear combination of factored (magnified) load effects as given by the following general format: m
φR n ≥ ∑ γ i Lni
(11)
i =1
where φ = strength factor, Rn = nominal (or design) strength, γi = load factor for the ith load component out of n components, and Lni = nominal (or design) value for the ith load component out of m components. In this approach, load effects are increased, and strength is reduced, by multiplying the corresponding characteristic (nominal) values with factors, which are called strength (resistance) and load factors, respectively, or partial safety factors (PSF’s). The characteristic value of some quantity is the value that is used in current design practice, and it is usually equal to a certain percentile of the probability distribution of that quantity. The load and strength factors are different for each type of load and strength. Generally, the higher the uncertainty associated with a load, the higher the corresponding load factor; and the higher the uncertainty associated with strength, the lower the corresponding strength factor. These factors are determined probabilistically so that they correspond to a prescribed level of reliability or safety. It is also common to consider two classes of performance function that correspond to strength and serviceability requirements. The difference between the allowable stress design (ASD) and the LRFD format is that the latter use different safety factors for each type of load and strength. This allows for taking into consideration uncertainties in load and strength, and to scale their characteristic values accordingly in the design equation. ASD (or called working stress) formats cannot do that because they use only one safety factor as seen by the following general design format:
R ≥ FS
m
∑ Li
(12)
i =1
where R = strength or resistance, Li = load effect, and FS = factor of safety. In this design format, all loads are assumed to have average variability. The entire variability of the strength and the loads is placed on the strength side of the equation. The factor of safety FS accounts for this entire variability. In the LRFD design format, ship designers can use the load and resistance factors in limit-state equations to account for uncertainties that might not be considered properly by deterministic methods (i,e., ADS) without explicitly performing probabilistic analysis. The LRFD format as described herein is concerned mainly with the structural design of ship hull girders under combinations of different load effects. The intention herein is to provide naval architects and ship designers with reliability-based methods for their use in both early and final design stages and for checking the adequacy of the scantlings of all structural members contributing to the longitudinal and transverse strength of ships. The general form of the LRFD format used in this chapter is given by Eq. 11. The probabilistic characteristics and nominal values for the strength and load components were determined based on statistical analysis, recommended values from other specifications, and by professional judgment. The LRFD general design formats for ship hull girders are given by one of the following two main cases, limit sate 1, and limit sate 2, respectively: φR n ≥ γ SW L SW + kWD γ WD LWD
(13)
φR n ≥ γ SW L SW + k W (γ W LW + k D γ D L D )
(14)
where φ = strength factor, Rn = nominal (or design) strength such as the ultimate stress, γSW = load factor for stillwater load effect such as bending moment, LSW = nominal (or design) value for stillwater load effect such as bending moment, kWD = combined wave-induced and dynamic bending moment factor, and γWD = load factor for combined wave-induced and dynamic bending moment, LWD = nominal (or design) value for waveinduced and dynamic bending moments effect, kW = load combination factor, γW = load factor for waves bending moment load effect, LW = nominal (or design) value for waves bending moment load effect, kD = load combination factor, γD = load factor for dynamic load effect such as bending moment, and L D = nominal (or design) value for dynamic load effect such as bending moment. The strength and load factors are called collectively partial safety factors (PSF’s). These factors are determined using structural reliability methods based on
8
the probabilistic characteristics of basic random variables for materials, geometry and loads including statistical and modeling (or prediction) uncertainties. The factors are determined to meet target reliability levels that were selected based on assessing previous designs. This process of developing LRFD rules to meet target reliability levels that are implicit in current practices is called code calibration. 2.4 Reliability Checking The LRFD methods also provide formats for reliability (safety) checking for various types of hull structural elements. In order to perform a reliability checking on these elements, the computed reliability safety index β resulting from reliability assessment using for example FORM should not be less than the target safety index β0 as given by the following expression:
β ≥ β0
(15)
Reliability checking for different classes of ship structural elements can also be performed using the general form of the load and resistance factor design format of Eq. 11. Depending on the limit state, the nominal strength Rn of the structural component shall meet one of following two main requirements for limit states 1 and 2, respectively: γ L + kWDγ WD LWD Rn ≥ s s φ
(16)
γ L + kW (γ W LW + k D γ D L D ) Rn ≥ s s φ
(17)
2.5 First-Order Reliability Method (FORM) The First-Order Reliability Method (FORM) is a convenient tool to assess the reliability of a ship structural element. It also provides a means for calculating the partial safety factors φ and γi that appear in Eq. 11 for a specified target reliability level β0. The simplicity of the first-order reliability method stems from the fact that this method, beside the requirement that the distribution types must be known, requires only the first and second moments; namely the mean values and the standard deviations of the respective random variables. Knowledge of the joint probability density function (PDF) of the design basic variables is not needed as in the case of the direct integration method for calculating the reliability index β. Even if the joint PDF of the basic random variables is known, the computation of β by the direct integration method can be a very difficult task. In design practice, there are usually two types of limit states: the ultimate limit states and the serviceability limit
states. Both types can be represented by the following performance function: g ( X ) = g ( X 1 , X 2 , ..., X n )
(18)
in which X is a vector of basic random variables (X1, X2, ..., Xn) for the strengths and the loads. The performance function g(X) is sometimes called the limit state function. It relates the random variables for the limit-state of interest. The limit state is defined when g(X) = 0, and therefore, failure occurs when g(X) < 0 (see Figure 4). The reliability index β is defined as the shortest distance from the origin to the failure surface in the reduced coordinates at the most probable failure point (MPFP) as shown in Figure 4. As indicated earlier, the basic approach for developing reliability-based design rules requires the determination of the relative reliability of designs based on current practices. Therefore, reliability assessment of existing structural components of ships such as the hull girder is needed to estimate a representative value of the reliability index β. The first-order-reliability method is very well suited to perform such a reliability assessment. The following are computational steps as described in [3] for determining β using the FORM method: ∗ '∗ 1. Assume a design point x i and obtain xi in the reduced coordinate using the following equation: x i'∗ =
x i∗ − µ X i
(19)
σ Xi
where x i'∗ = −α i∗ β , µ X i = mean value of the basic random variable, and σ X i = standard deviation of the basic random variable. The mean values of the basic random variables can be used as initial values for the ∗ '∗ design points. The notation x and x are used respectively for the design point in the regular coordinates and in the reduced coordinates. 2. Evaluate the equivalent normal distributions for the non-normal basic random variables at the design point using the following equations: µ XN = x ∗ − Φ −1 F X ( x ∗ ) σ XN
(
)
(20)
(Φ (F
))
(21)
and σ XN =
where
µ XN =
distribution, σ
N X
mean
−1
X
(x∗ ) ∗
f X (x ) of
the
equivalent
normal
= standard deviation of the equivalent
9
distance to the failure surface from the origin in the reduced coordinates as shown in Figure 4. The important relation between the probability of failure and the reliability (safety) index is given by Eq. 10.
L` = reduced coordinate of L g ( R, L) = 0.0 Most Probable Failure Point
Limit State in Reduced Coordinates *
*
(R , L )
R = resistance or strength L = load
2.5.1 Procedure for Calculating Partial Safety Factors (PSF) Using FORM
β R` = reduced coordinate of R Failure occurs when g < 0.0
The first-order reliability method (FORM) can be used to estimate partial safety factors such those found in the design format of Eq. 11. At the failure point ( R ∗ , L1∗ , ..., L∗n ), the limit state of Eq. 11 is given by
Figure 4. Space of Reduced Random Variables Showing the Reliability Index and the Most Probable Failure Point ∗
normal distribution, FX (x ) = original (non-normal) cumulative distribution function (CDF) of Xi evaluated at the design point, fX(x∗ ) = original probability density function (PDF) of Xi evaluated at the design point, Φ(⋅) = CDF of the standard normal distribution, and φ(⋅) = PDF of the standard normal distribution. 3. Compute the directional cosines at the design point ( α i∗ , i = 1,2, ..., n) using the following equations:
α i∗ =
∂g ∂x ' i
∗
∂g ' i =1 ∂x i n
∑
for i = 1, 2, ..., n
= ∂g ∂x ∗ i
g ( X ) = g ( x1∗ , x 2∗ ,..., x n∗ ) = 0
(27)
For given target reliability index β0, probability distributions and statistics (means and standard deviations) of the load effects, and coefficient of variation of the strength, the mean value of the resistance and the partial safety factors can be determined by the iterative solution of Eqs. 19 through 25. The mean value of the resistance and the design point can be used to compute the required mean partial design safety factors as follows φ=
R∗ µR
(28)
γi =
L∗i µ Li
(29)
The strength factors are generally less than one, whereas the load factors are greater than one. N σ Xi ∗
(23)
4. With α i∗ , µ XN , and σ XN are now known, the i
(26)
or, in a general form
(22)
2
∗
where ∂g ∂x ' i
g = R ∗ − L1∗ − ... − L∗n = 0
i
following equation can be solved for the root β: g ( µ XN − α ∗X 1 σ XN β ), ..., ( µ XN − α ∗X n σ XN β ) = 0 (24) n n 1 1
5. Using the β obtained from step 4, a new design point can be obtained from the following equation: x i∗ = µ XN − α i∗σ XN β i i
(25)
6. Repeat steps 1 to 5 until a convergence of β is achieved. The reliability index is the shortest
2.5.2 Determination of a Strength Factor for a Given Set of Load Factors In developing design code provisions for ship hull girders, it is sometimes necessary to follow the current design practice to insure consistent levels of reliability over various types of ship structures. Calibrations of existing design codes are needed to make the new design formats as simple as possible and to put them in a form that is familiar to the users or designers. Moreover, the partial safety factors for the new codes should provide consistent levels of reliability. For a given reliability index β and probability characteristics for the resistance and the load effects, the partial safety factors determined by the FORM approach might be different for different failure modes for the same structural component. Therefore, the calculated partial safety factors (PSF’s) need to be adjusted in order to maintain the same values for all loads at different failure modes by the strength
10
factor φ for a given set of load factors. The following algorithm can be used to accomplish this objective: 1. For a given value of the reliability index β, probability distributions and statistics of the load variables, and the coefficient of variation for the strength, compute the mean strength needed to achieve the target reliability using the first-order reliability method as outlined in the previous sections. 2. With the mean value for R computed in step 1, the partial safety factor can be revised for a given set of load factors as follows: n
φ `=
∑ γ `i µ Li i =1
µR
(30)
3.1.1 Elastic-Based Strength The section modulus Z amidship is to be determined according to best engineering judgment and practices. The elastic-based bending strength of a hull girder shall be then computed as M u = cF y Z
(31)
where c = buckling knock-down factor which was set to be a random variable with mean (or design) value of 0.36 in hogging and 0.74 in sagging [9], Fy = yield strength of material, Mu = ultimate bending capacity of the hull girder, and Z = section modulus. The buckling knockdown factor is defined as c=
Mu Fy Z
(32)
where φ ` = revised strength factor, µ Li and µR are the
where Mu = ultimate bending capacity of the hull girder.
mean values of the loads and strength variables, respectively; and γ `i , i = 1, 2, ..., n, are the given set of load factors.
3.1.2 Ultimate Strength
3. DESIGN STRENGTH AND LOADS FOR HULL GIRDER In this section, recommended design (or called nominal) models for both the longitudinal strength of hull girders and bending moments as loads are provided based on a literature review. These design values can be viewed as the nominal values required by the LRFD rules for the preliminary design stages to satisfy the desired target reliability levels. The LRFD formats take into considerations the variability associated with the design variables (for both strength and loads prediction). The focus in this section is on hull girder strength, stillwater bending, wave-induced bending, and dynamic bending moments. The hull girder strength can be determined using two approaches: elastic-based strength, and ultimate strength. The wave loads can be determined using extreme and spectral analysis. 3.1 Design Strength for Hull Girder Two methods are provided for determining the design value of the hull: (a) elastic-based strength, and (b) ultimate strength. The ship’s hull girder in both methods is treated as a beam subjected to combined bending moments, and has its own strength. The strength is a function of the section modulus of the hull girder at any section of interest based on mechanical and geometric properties of the hull materials.
The ultimate bending strength capacity for a section at any station can be estimated using the incremental strain approach by calculating the moment-curvature relationship and as the maximum resisting moment for the section. This approach calculates the moment-curvature relationship and the ultimate bending capacity of a ship’s hull girder cross section using strength and geometry information about scantlings of all structural members contributing to the longitudinal strength. Computer programs are available and can be used for this purpose as described in [9]. 3.2 Design Loads for Hull Girder Primary structural loads on a ship are due to its own weight, cargo, buoyancy, and operation in a random environment, i.e., the sea. The loads acting on the ship’s hull girder can be categorized into three main types: (a) stillwater loads, (b) wave loads, and (c) dynamic loads. The load effect of concern herein is bending moment exerted on the ship hull girder. Stillwater loads can be predicted and evaluated with a proper consideration of variability in weight distribution along the ship length, variability in its cargo loading conditions, and buoyancy. Both wave loads and dynamic loads are related and affected by many factors such as ship characteristics, speed, heading of ship at sea, and sea state (waves heights). Waves height is a random variable that requires statistical and extreme analyses of ship response data collected over a period of time in order to estimate maximum wave-induced and dynamic bending moments that the ship might encounter during its life. The statistical representation of sea waves allows the use
11
of statistical models to predict the maximum wave loads in ship’s life. Procedures for computing design wave loads for a ship’s hull girder based on spectral analysis can be found in numerous references pertaining to ship structures such as [10]. 3.2.1 Hull Girder Loading
peak-to-peak whipping bending moments (in ft-ton) for fine bow ships is described by in [9] as MWH = 0.0022 LBP2 B for LBP < 5x10⁶
(34)
and M WH = 5.4 LLBP B for LBP < 5x10⁶
(35)
The loads that are of concern in this study for developing reliability-based design for panels and fatigue details of ship structures are the ones resulting from ship hull girder bending and their combinations. As indicated earlier, the loads acting on the ship’s hull girder can be categorized into three main types: stillwater loads, wave loads, and dynamic loads. Each of these types of loads are presented subsequently under its own heading.
where MWH = mean value of peak-to-peak whipping bending moment, LBP = length between perpendiculars of the ship (in ft), and B = molded breadth of the ship (in ft). For ships with bow flare or with flat bottom (such as auxiliaries and cargo ships), the whipping bending moments can be determined (in ft-ton) using [9]
3.2.1.1 Stillwater Loads
The lifetime extreme value of whipping bending moments for a ship was defined as the whipping bending moment value with a one percent chance of being exceeded in its lifetime and is given by
The calm water or stillwater loading should be investigated in design processes although it rarely governs the design of a ship on its own. The ship is balanced on the draft load waterline with the longitudinal center of gravity aligned with the longitudinal center of buoyancy in the same vertical plan. Then, the hull girder loads are developed based on the differences between the weights and the buoyancy distributions along the ship’s length. The net load generates shear and bending moments on the hull girders. The resulting values from this procedure are to be considered the design (nominal) values in the LRFD format for the stillwater shear forces and bending moments on the hull girder. 3.2.1.2 Wave-induced Bending Moment
MWH = 0.0022 LBP2 B
M WH e = 4.6M WH
(36)
(37)
where M WHe = extreme value of whipping bending moment in ton-ft. 3.2.1.4 Combined Wave-induced and Dynamic Bending Moment Spectral and extreme analyses can be used to determine the design value of the combined wave-induced and dynamic bending moments on a ship hull girder during its design life [11].
Wave-induced bending moment is treated as a random variable dependent on ship’s principal characteristics, environmental influences, and operational conditions. Spectral and extreme analyses can be used to determine the extreme values and the load spectra of this load type during the design life of the ship. The outcome of this analysis can be in the form of vertical or horizontal longitudinal bending moments or stresses on the hull girder. Computer programs have been developed and are available to perform these calculations for different ships based on their types, sizes, and operational conditions [11].
3.2.2 Load Combinations
3.2.1.3 Dynamic Bending Moment
where MSW = stillwater bending moment, MWD = waveinduced bending moment, Mu = ultimate capacity (moment) of hull girder, kW = correlation factor for waveinduced bending moment and is set equal to one [5].
Dynamic bending moments on the hull girder due to slamming or whipping can be determined using one of the following two methods: 1. Spectral and extreme analyses can be used to obtain the combined wave-induced and dynamic load effects on the hull girder. Computer programs can be used for this purpose as provided by in [11]. 2. Equations 30 to 33, which are based on spectral analysis can be used for this purpose. The average
The reliability-based structural design of ship hull girders for bending as presented in this paper is based on two load combinations that are associated with correlation factors as presented in the subsequent sections [5]. 3.2.2.1 Stillwater and Vertical Wave-induced Bending Moments The load combination for stillwater and vertical waveinduced bending moments is given by M u = M SW + kWD M WD
(38)
3.2.2.2 Stillwater, Vertical Wave-induced, and Dynamic Bending Moments The load combination for stillwater, vertical waveinduced and dynamic bending moments is given by
12
M u = M SW + kW (M W + k D M D )
(39)
where MSW = stillwater bending moment, MW = waves bending moment, MD = stress due to dynamic bending moment, Mu = ultimate capacity (moment) of hull girder, and kD = correlation factor between wave-induced and dynamic bending moments. The correlation factor kD is given by the following two cases of hogging and sagging conditions [5, 9]: a. Hogging condition: 53080 k D = Exp −0.2 + 14.2 LBP 0.3 LBP 158LBP
(
)
(40)
b. Sagging condition: 21200 k D = Exp −0.2 + 14.2 LBP 0.3 LBP 158LBP
(
)
(41)
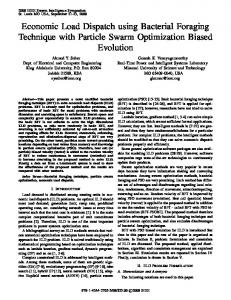
where LBP = length between perpendiculars for a ship in ft. Values of kD for LBP ranging from 300 to 1000 ft can be obtained either from Table 2 or from the graphical chart provided in Figure 5. 4 EXAMPLE 1: LRFD RULES FOR HULL GIRDER UNDER COMBINED LOADS Hull girders are very important components in ship structures, and therefore they should be designed for a set of failure modes such as yielding, buckling, and fatigue of critical connecting components. In addition, they should
0.9 0.8
Correlation Factor
0.7 0.6 0.5
Sagging
0.4
Hogging
0.3 0.2 0.1 0 300
400
500
600
700
800
900
1000
Ship's Length in ft
Figure 5. Correlation Coefficient of Whipping Bending Moment (kD) for 300 < LBP < 1000 ft [5, 7]
Table 2. Correlation Coefficient of Whipping Bending Moment (kD) for LBP between 300 and 1000 ft [5, 9] Length 300 (ft)
kD(sag) kD(hog)
400 500 600 700 800 900 1000
0.5779 0.672 0.734 0.778 0.810 0.835 0.854 0.870
be designed for target reliability levels that reflect the levels in currently used design practices with some calibration, or based on cost benefit analysis. The performance of a hull girder is defined by a set of requirements stated in terms of tests and measurements of how well the hull girder serves various intended functions over its service life. Reliability and risk measures can be considered as performance measures, specified as target reliability levels (or target reliability indices, β0). The selected reliability levels for a hull girder reflect its probability of failure. Reliability-based load and resistance factor design (LRFD) for hull girder requires defining performance functions that correspond to limit states for its significant failure modes. It also requires the statistical characteristic of basic strength and load random variables. Quantification of these variables is needed for reliability analysis and design of the hull girder. For example, the first-order reliability method (FORM) requires the quantification of the mean values, coefficient of variation, and distribution types of all relevant random variables. They are needed to compute the safety (reliability) index β or the PSF’s. 4.1 Target Reliability Levels Selecting a target reliability level is required in order to establish reliability-based design rules for ship structures such as the hull girder. The selected reliability level determines the probability of failure of the structures. The following three methods can be used to select a target reliability value: 1. Agreeing upon a reasonable value in cases of novel structures without prior history. 2. Calibrating reliability levels implied in currently used design codes. 3. Choosing target reliability level that minimizes total expected costs over the service life of the structure for dealing with design for which failures result in only economic losses and consequences. Since the development herein is limited to ship hull girders that are not novel structures, the first method is excluded. Ship hull girders modes of failure have serious consequences such as the entire loss of the ship, loss of lives, and environmental damages (water pollution in case of tankers or chemical carriers). Accordingly, the second method seems to be the proper one to be adopted for selecting target reliability levels since there are a lot of data available from currently used design codes that resulted in structures with adequate reliability. 4.2 Limit States for Hull Girder Bending
0.2539 0.369 0.461 0.533 0.591 0.637 0.675 0.706
The hull girder of a ship for all stations should meet one of the following conditions; the selection of the
13
appropriate equation depends on the availability of information as required by these equations: φ M M u ≥ γ SW M SW + kW (γ W M W + γ D k D M D )
(42)
φ M cF y Z ≥ γ SW M SW + k W (γ W M W + γ D k D M D )
(43)
φ M M u ≥ γ SW M SW + γ WD kWD M WD
(44)
φ M cF y Z ≥ γ SW M SW + γ WD kWD M WD
(45)
where c = nominal buckling knock-down factor, φ M = strength factor of ultimate bending capacity, Fy = nominal yield strength of steel, kD = dynamic bending moment probabilistic combination load factor, kW = wave-induced bending moment probabilistic combination load factor, kWD = probabilistic combination load factor for combined wave-induced and whipping, γD = load factor for dynamic bending moment, γSW = stillwater bending moment partial safety factor, γW = load factor for environmental load, γWD = load factor for combined wave-induced and dynamic bending, MD = nominal dynamic bending moment, MSW = nominal value of stillwater bending moment, Mu = nominal ultimate bending capacity of ship hull girder, MW = nominal value of wave-induced bending moment, MWD = nominal combined wave-induced and whipping bending moment, and Z = section modulus of hull girder. The nominal (i.e., design) values of the strength and load components should satisfy these limit states in order to achieve specified target reliability levels. 4.3 Statistical Characteristics of Random Variables The statistical characteristics of random variables of strength and load models are needed for reliability-based design and assessment of ship structures including hull girders. The moments methods for calculating partial safety factors [12, 3, 13] require full probabilistic characteristics of both strength and load variables in the limit state equation. For example, the relevant strength variables for ship hull girders are the material’s yield strength (stress) Fy, section modulus Z, and buckling knock-down factor c. While the relevant loads variables are the external pressures due to stillwater bending moment, wave bending moment, and dynamic loads. The definition of these random variables requires the investigation of their uncertainties and variability. In reliability assessment of any structural system, these uncertainties must be quantified. Furthermore, partial safety factors (PSF’s) evaluation for both the strengths and loads in any design equation also requires the characterization of these variables. For example, the firstorder reliability method (FORM) as outlined earlier requires the quantification of mean values, standard
deviations (or the coefficient of variation (COV)), and distribution types of all relevant random variables. They are needed to compute the safety index β or the PSF’s. Therefore, complete information on the probability distributions of the basic random variables under consideration must be developed. Quantification of random variables of loads and strength in terms of their means, standard deviations or COV’s, and probability distributions can be achieved in two steps: (a) data collection and (b) data analysis. The first step is the task of collecting as many sets of data deemed to be appropriate for representing the random variables under study. The second is concerned with statistically analyzing the collected data to determine the probabilistic characteristics of these variables. The objective herein is to compile statistical information and data based on literature review on both strength and loads random variables for quantifying the probabilistic characteristics of these variables. The quantification of the probabilistic characteristics of these variables is needed for reliability analysis and design of hull structural components. Tables 3, 4, and 5 provide summaries of the probabilistic characteristics of strength and loads random variables. The information given in these tables is tabulated based on data from a literature review performed in [14] and [13]. Tables 6 through 9 provide all the recommended values of information required for establishing reliabilitybased design rules for ship structures. This information includes limit state functions for different load combinations; probabilistic characteristics (mean values, COV, and distribution type) of random variables involved in these limit state functions. The information also includes mean to nominal values of these random variables, deterministic values of the probabilistic loadcombination factors; probabilistic characteristics of the buckling knock-down factor; mean ratios between different load components, ranges of target reliability index; the biases between different values of each of the random variables; and probabilistic characteristics of model and prediction uncertainty parameters. The recommended range of target reliability indices for hull girder bending is set to be from 4.0 to 5.0 for a sagging condition and 5.0 to 6.0 for a hogging condition for naval ships [16]. 4.4 Calculation of Partial Safety Factors for Hull Girders Based on the ultimate capacity (ultimate moment), this example demonstrates the calculation of partial safety factors for the hull girders when they are under a combination of stillwater, wave-induced, and dynamic bending moments. The performance function of the limit state for this case is given by
14
Table 3a. Recommended Probabilistic Characteristic of Strength Basic Random Variables [9,15] Statistical Information Variable Nominal Mean Standard Distribution Value Deviation Type t (in) t t 0.02 normal a (in) a a 0.11 normal b (in) b b 0.09 normal dw (in) dw dw 0.12 normal fw (in) fw fw 0.07 normal tw (in) tw tw 0.02 normal tf (in) tf tf 0.02 normal L (ft) L L 0.08 normal D (ft) D D 0.01 normal B (ft) B B 0.01 normal Table 3b. Recommended Probabilistic Characteristic of Strength Basic Random Variables [9,15] Statistical Information Variable
Table 4a. Recommended Ranges for Statistics of Strength Basic Random Variables [9,15] Bias Information Random Variable Mean Standard
t (in)
a (in)
b (in)
dw (in) fw (in)
Nominal Value
Mean
Fy
1.11 Fy
0.07 lognormal
tf (in)
L (ft)
COV
Distribution Type
Ordinary Strength Fy (ksi) High Strength Fy (ksi) Fu (ksi) E (ksi) ν
Fy
1.22 Fy
0.09 lognormal
Fu E 0.3
Z
Zr
1.05 Fu 1.024 E 0.3 1.04 Zr
0.05 normal 0.02 normal 0 0.05 lognormal
My
Fy Z
Fy Z
0.15 lognormal
Mp
Fy Zp
Fy Z p or
0.18 lognormal
cFy Z
OS = Ordinary Steel, HS = Higher Strength Steel, na = not available g = φ M M u − γ SW M SW − kW (γ W M W + γ D k D M D ) (46) The partial safety factors for this limit state function were developed for demonstration purposes using a target reliability index β0 of 4.0. This equation provides strength minus load effect expression of the limit state. The First-Order Reliability Method (FORM) as discussed in previous sections requires the probabilistic characteristics of Mu, MSW, MW and MD. According to Table 6, the stillwater load effect MSW is due to stillwater bending that can be assumed to follow a normal
tw (in)
D (ft)
B (ft)
Minimum Recommended Maximum Minimum Recommended Maximum Minimum Recommended Maximum Minimum Recommended Maximum Minimum Recommended Maximum Minimum Recommended Maximum Minimum Recommended Maximum Minimum Recommended Maximum Minimum Recommended Maximum Minimum Recommended Maximum
t t t a a a b b b dw dw dw fw fw fw tw tw tw tf tf tf L L L D D D B B B
Deviation 0.00520 0.01720 0.04170 na 0.10600 na na 0.09300 na na 0.1171 na na 0.0649 na na 0.0180 na na 0.0212 na 0.00000 0.08333 0.16777 0.00694 0.01180 0.01390 0.00200 0.01093 0.01390
distribution with a coefficient of variation of 0.15. Both the wave-induced and dynamic load effects MW and MD can be assumed to follow an extreme value distribution (Type I largest) with a coefficient of variation of 0.15 and 0.25, respectively, as provided in Table 6. The mean values of stillwater, wave-induced, and dynamic bending moments that can be provided in the form of a ratio of stillwater/wave-induced and dynamic/wave-induced loads can range from 0.2 to 0.4 and from 0.25 to 0.35, respectively, as shown in Table 8. Table 10 summarizes the probabilistic characteristics of both the strength and the load effects. The ratios of means for strength/wave-induced load and the partial safety factors for a target reliability of 4.0 are summarized as shown in Figure 6. Based on these results, the following preliminary values for partial safety factors are recommended for demonstration purposes:
15
Mean strength reduction factor (φΜ) = 0.44 Mean stillwater load factor (γSW) = 1.04 Mean wave-induced load factor (γW) = 1.22 Mean dynamic load factor (γD) = 1.05 The above partial safety factors for the strength and the loads can be converted to nominal values by multiplying them by the appropriate mean to nominal ratios. Based on the mean to nominal ratios of Table 10, the following preliminary nominal values for partial safety factors are recommended for demonstration purposes: Nominal strength reduction factor (φΜ) = 0.48 Nominal stillwater load factor (γSW) = 1.04 Nominal wave-induced load factor (γW) = 1.22 Nominal dynamic load factor (γD) = 1.17 4.5 Calculation of Strength Factor for a Given Set of Load Factors As indicated in earlier, for a given β and probabilistic characteristics for the strength and the load effects, the partial safety factors determined by the FORM approach might be different for different failure modes. For this reason, an adjustment is often needed on the strength factor φM to maintain the same values for all load factors γ , s. The following numerical example illustrates the procedure for revising the strength factor for a given set of load factors. For instance, given γ `SW = 1.3, γ `W = 1.8, γ `D = 1.5, kW = 1, kD = 0.7, and the mean values for MSW, MW, and MD (ratios of 0.2, 1.0, and 0.25), the corresponding strength factor φM was calculated for a target reliability level β = 4.0. Using the first-order reliability method (FORM), the mean of Mu was found to be 4.1. With the mean value known, Eq. 27 gives ` φM =
(
γ `SW M SW + kW λ `W M W + k D γ `D M D
=
)
Mu
1.3(0.2) + (1)[1.8(1.0) + 0.7(1.5)(0.25)] = 0.57 4.1
5. EXAMPLE 2: LRFD RULES FOR UNSTIFFENED PANEL UNDER UNIAXIAL COMPRESSION Plates (or panels) are important components in ship structures, and therefore they should be designed for a set of failure modes such as yielding, buckling, and fatigue of critical connecting components. This example considers only a simply supported rectangular plate under uniaxial compressive stress. The limit state for this case is given by
g = Fu − f SW − k w ( f w + k D f D )
(47)
where Fu = the strength of the plate (stress), fSW = external stress due to stillwater bending, and fW = external stress due to wave-induced bending, and fD = stress due to dynamic bending. kW and kD are correlation factors that can take values of 0.7 and 1.0, respectively. The strength Fu is given by one of the following two cases: 1. For a/b > 1.0 π2 F y if B ≥ 3.5 3(1 − ν 2 ) B 2 2.25 1.25 if 1.0 ≤ B < 3.5 (48) Fu = F y − B2 B F if B < 1.0 y 2. For a/b < 1.0 2 1 Fu = F y αCu + 0.08(1 − α )1 + ≤ 1.0 (49) 2 B where Fy = yield strength (stress) of plate, a = length or span of plate, b = distance between longitudinal b Fy a stiffeners, and in which B = , α= , t = t E b thickness of the plate, E = the modulus of elasticity, ν = Poisson’s ratio, and π2 3(1 − ν 2 ) B 2 2.25 125 . Cu = − B2 B 10 .
if B ≥ 35 . if 10 . ≤ B < 35 .
(50)
if B < 10 .
The partial safety factors for the above limit state equation (Eq. 47) were developed using a target reliability index β of 3.0. The first-order reliability method requires the probabilistic characteristics of fu, fs, fw and fD. The partial safety factors for a target reliability level of 3.0 are summarized in Tables 11 and 12. The ratios of means for strength/wave ranges are summarized in Table 13. Calibration on the strength factor fu for a given set of prescribed recommended load factors (such as γs = 1.05, γw = 1.2, and γD = 1.05) are provided in Table 14. Recommended mean and nominal partial safety factors for both the strength and load effects are given in Tables 15 and 16 for demonstration purposes. The following LRFD format can be used: φ u Fu ≤ γ SW f SW + k w (γ w f w + k D γ D f D ) (51)
16
Table 4b. Recommended Ranges for Statistics of Strength Basic Random Variables [9,15] Statistical Information Random Variable Mean COV Minimum 33.8 0.03 OS Fy (ksi) Recommended 37.3 0.07 Maximum 44.0 0.12 Minimum 39.6 0.07 HS Fy (ksi) Recommended 49.6 0.09 Maximum 66.0 0.10 Minimum 59.3 0.02 Fu (ksi) Recommended 61.6 0.05 Maximum 64.3 0.09 Minimum 28,980 0.01 29,696 0.02 E (ksi) Recommended Maximum 30,200 0.06 Minimum na 0.04 Z Recommended na 0.05 Maximum na 0.05 na Minimum 0.10 Recommended My Fy Z 0.15 Maximum na 0.15 na Minimum 0.12 Recommended Mp Fy ZP 0.18 Maximum na 0.18 c Recommended 0.6 for OS na 0.8 for HS na OS = Ordinary Steel, HS = Higher Strength Steel, na = not available
Bias 1.000 1.110 1.220 1.100 1.220 1.350 1.007 1.046 1.090 1.000 1.024 1.076 1.000 1.035 1.040 1.0 1.0 1.0 1.0 1.0 1.0 na na
Table 5. Recommended Probabilistic Characteristics of Load Random Variables [9] Coefficient of Variation 0.3 to 0.9 for commercial ships, and 0.15 for naval vessels
Random Variable
Distribution Type
Mean to Nominal Ratio
Stillwater Bending Moment MSW
Normal
0.4 to 0.6 for commercial ships, and 0.7 for naval vessels
Life-time Extreme Wave-induced Bending Moment MW
Largest extreme value (type I)
1.0
0.1 to 0.2
Whipping Bending Moment MD
Extreme value (type I) exponential
Mean value can be determined using formulae based on spectral analysis
0.2 to 0.3
Springing Bending Moment MSP
Extreme value (type I)
1.0
0.3
Hydrostatic pressure due to stillwater, PSW
Normal
0.4 to 0.6 for commercial ships, and 0.7 for naval vessels
0.15
1.0
0.15
1.0
0.25
1.0
0.25
Hydrostatic pressure due to waves, PW Hydrostatic pressure due to dynamic effects, PD Hydrostatic pressure due to combined waves and dynamic loads, PWD
Largest extreme value (type I) Largest extreme value (type I) Weibull
17
Table 6. Recommendations for Probabilistic Characteristics of Basic Random Variables [9] Random Mean/Nominal Coefficient of Variation Distribution Type Variable c Mean value = 0.22 (hog), 0.19 (sag) Normal 0.74 (hog), 0.36 (sag) Fy 0.07 (OS), 0.09 (HS) Lognormal 1.11 (OS) 1.22 (HS) Z 1.04 0.05 Lognormal Mu 1.1 0.15 Normal MSW 0.7 to 1.0 0.15 Normal MW 1.0 0.1 to 0.2 Type I (EVD) - largest MD 0.2 to 0.3 Type I (EVD) - largest 1.11 MWD 0.971 0.222 to 0.287 Weibull - smallest na = not available, EVD = extreme value distribution Table 7. Recommendations for Combination Factors for Load Components [9] Factor Deterministic Value kW 1.0
kD
53080 EXP (Hogging) −0.2 + 14.2 LBP 0.3 LBP 158LBP
(
)
21200 EXP (Sagging) −0.2 0.3 + 14.2 LBP LBP 158LBP
(
kWD
)
1.0
Table 8. Recommendations for Ratios of Different Load Components [9] Ratio Recommended Value 0.25 to 0.35 M SW / M W
1.11(OS) 1.22(HS) 1.04 1.1 0.7 to 1.0 1.0 1.0 0.971
References and Comments [11] and [14] Reference [11] Ranging from 0.35 to 0.65 for LBP = (400 to 800) ft Ranging from 0.65 to 0.85 for LBP = (400 to 800) ft Assumed value as defined in (11)
Reference [16]
M D / MW
0.25 to 0.35
[16]
M WD / M W
1.0 to 1.35
Assumed values
Table 9. Recommendations for Ranges of Target Reliability Index [9] Range 4.0 to 6.0 (Sagging) 5.0 to 6.0 (Hogging)
Biases or Error na
Reference [16] [16]
Table 10. Probabilistic Characteristics of Strength and Load Variables for the Example [9] Random Coefficient of Variation Mean/Nominal Distribution Type Variable (recommended value) Mu 1.1 0.15 (0.15) Normal MSW 1.0 0.15 (0.15) Normal MW 1.0 0.1 to 0.2 (0.15) Type I Largest MD 0.83 to 1.11 0.2 to 0.3 (0.25) Type I Largest
Biases 1.1 1.0 1.0 1.0
18
a. Strength Factor, φ M
0.5
M SW /M W M D /M W
0.4
0.3
0.25
0.449845 0.4427769 0.4365088
0.2
0.3
0.4479959 0.4403915 0.4353116
0.1
0.35
0.445773 0.4389671 0.4331058
0.2
0.3
Mean Dynamic/ Wave
0.4
0.25
0 0.2
0.3
0.4
b. Stillwater Load Factor, γSW λ Msw M SW /M W M D /M W
0.2 0.25 0.3 0.35
0.3
0.4
1.06
1.054247
1.04
1.029284 1.0419189 1.0532724 1.02873875 1.0411108
Mean Dynamic/ Wave
1.1 1.08
1.02981057 1.0426998
0.3 0.35
Mean Stillwater/Wave
1.02
1.052369
0.25 1
0.3 0.2
0.3
0.4
0.35
Mean Stillwater/Wave
c. Wave-induced Load Fcator, γ W M SW /M W M D /M W
0.3
0.4
1.2
1.2612599 1.2282617
1.200301
1.15
0.2 0.25 0.3 0.35
1.3
1.216849 1.1911799
1.1
1.23447644 1.2061922 1.1784201
1.05
1.247623
Mean Dynamic/ Wave
1.25
0.25 0.3
1
0.25 0.2
0.3
0.4
Mean Stillwater/Wave
d. Dynamic Load Factor, γ D M SW /M W
1.15
Mean Dynamic/ Wave
1.1
M D /M W
0.2 0.25
0.3
0.4
1.0328947 1.0289335 1.0250562
0.3
1.0492608 1.0441725
1.039316
0.35
1.0661246 1.0598484
1.054121
1.05 0.35
1
0.3 0.95
0.25 0.2
0.3
0.4
Mean Stillwater/Wave
Figure 6. Variation of Strength and Load Partial Safety Factors versus Variation of the Ratios for the Mean Values of Load Components for the Example
6. SUMMARY AND CONCLUSIONS Reliability of a system can be defined as its ability to fulfill its design functions for a specified time period. This ability is commonly measured using probabilities. Reliability is therefore, the occurrence probability of the complementary event to failure as
given by Eq. 3. Based on this definition, reliability is one of the components of risk. Safety can be defined as the judgment of risk acceptability for the system making it a component of risk management. The performance of ship hull girder and its components is defined by a set of requirements stated in terms of tests and measurements of how well the system or element serves various or intended functions
19
Table 11. Partial Safety factors (β = 3.0) φu γSW γw Minimum Mean Maximum
0.893886 0.93574 0.9740
1.034425 1.051914 1.069720
1.554748 1.616088 1.667869
γD 1.039628 1.061957 1.08549
Table 12. Strength Mean Value (β = 3.0) µu
Minimum
Mean
Maximum
2.11200
2.30652
2.51402
Table 13. Strength Reduction Factors for γs = 1.05, γw = 1.2, and γD = 1.05 with β = 3.0 µu
Minimum
Mean
Maximum
0.72524
0.75244
0.78058
Table 14. Bias Factors φu γSW 1.16
0.7
γw
γD
1.0
1.0
Table 15. Recommended Mean Factors φu γSW γw 0.75
1.05
1.2
Table 16. Recommended Nominal Factors φu γSW γw 0.87
0.75
1.2
γD 1.05
γD 1.05
over its service life. Risk and reliability measures can be considered as performance measures that can be specified in the form of target reliability levels (or target reliability indices, β0’s). The selected reliability levels of a particular structural element reflect the probability of failure of that element and the risk associated with it. An important consideration in the choice of LRFD design criteria is the consequence of failure. Clearly the target reliability levels relative to the collapse of the hull girder should be larger than that of a non-critical welded detail relative to fatigue. The following three methods can be used to select a target reliability value: (a) agreeing upon a reasonable value in the case of novel structures without prior history using expert opinion elicitation, (b) calibrating reliability levels implied in currently and successfully used design codes, and (c) choosing target reliability level that minimizes the costs over the service life of the structure for dealing with design for which failure results in only economic losses an consequences. Future design rules for ship hull girders will be developed using reliability methods, and they will be expressed in a special format such as the Load and Resistance Factor Design (LRFD) format. The LRFD rules for ship structures based on structural reliability theory can be built on previous and currently used
specifications for ships, buildings, bridges, and offshore structures. This paper provides methods for and demonstrates the development of LRFD rules for ship hull girders subjected to vertical bending due to combined loads. The methodology provided in this paper for developing LRFD rules for ship hull girders consists of several steps as follows: (a) The probabilistic characteristics of strength and load random variables that are used in hull-girder structural design were analyzed, and values for these characteristics were recommended for reliability-based design purposes. These values were selected based on the statistical analyses performed on data collected for strength and load random variables, on values recommended in other studies, or sometimes on sound engineering judgment. (b) Different load combinations for hull girders were established and presented with combinations and correlation factors that included the stillwater bending, wave-induced bending, and wave dynamic bending moments. The correlation among these different load components was accounted for and expressed in the form of correlation factors. (c) Limit states for these load combinations were established based on critical modes of failures of hull girders and the identified load combinations. (d) Target reliability levels as suggested and used by other studies were summarized, and ranges of target reliability levels were selected for the for the hull girder limit states in bending. (e) The First-Order Reliability Method (FORM) can be used to assess the reliability of ships hull girder as well as to develop and establish the partial safety factors. In this paper, the FORM method was used to develop partial safety factors for demonstration purposes. These factors were developed for the ultimate design capacity (Mu) of hull girders under a combination of stillwater, waveinduced, and dynamic bending moments load effects. The prescribed probabilistic characteristics of hull strength and load effects were used to develop the partial safety factors based on a linear limit state. The partial safety factors were computed for a selected case. Based on these results and for a target reliability level β of 4.0, the following nominal values for partial safety factors were computed for demonstration purposes: Strength reduction factor (φΜ) = 0.48 Stillwater load factor (γSW) = 1.04 Wave-induced load factor (γW) = 1.22 Dynamic load factor (γD) = 1.17 The resulting partial safety factors can be used, for example, to design the ultimate capacity (ultimate moment) of a hull girder under a combination of stillwater, wave-induced, and dynamic bending moment by satisfying the following design criterion:
20
0.48M u ≥ 1.04M SW − kW (1.22M W + 1.17k D M D ) (52) Similar design criterion can be adapted for unstiffened plate element subjected to uniaxial compression, using Eq. 51 and the nominal PSF values provided in Table 16. Therefore, reliability-based design rules can be expressed in a practical format that is suitable for the use of practicing engineers in designing various hull structural elements.
9.
ACKNOWLEDGMENTS The authors would like to acknowledge the opportunity and support provided by the Carderock Division of the Naval Surface Warfare Center of the U.S. Navy through its engineers and researchers that include J. Beach, W. Melton, P. Hess, D. Bruchman, J. Conley, W. Richardson, J. Adamchak, D. Kihl, J. Sikora, B. Hay, T. Brady, J. Dalzell, A. Disenbacher, and R. Lewis; and the guidance of the Naval Sea System and Command by N. Nappi, T. Packard., R. Walz, J. Snyder, J. Hough, and A. Engle.
10.
11.
12.
REFERENCES 1.
2.
3.
4.
5.
6.
7.
8.
Ayyub, B. M., Karaszewski, Z., and Wade, M., 1999. “Probabilistic Risk Analysis of Diesel Power Generators Onboard Ships,” Naval Engineers J., ASNE, May 99. Kumamoto, H., and Henley, E.J., 1996. “ Probabilistic Risk Assessment and Management for Engineers and Scientists,” Second Edition, IEEE Press, New York. Ayyub, B. M., and McCuen, R. H., 1997. “Probability, Statistics and Reliability for Engineers”, CRC Press LLC. National Research Council (NRC), 1989. “ Improving Risk Communication,” National Academy Press, Washington, D.C. Mansour, A. E., Jan, H. Y., Zigelman, C. I., Chen, Y. N., Harding, S. J., 1984. “Implementation of Reliability Methods to Marine Structures,” Trans. Society of Naval Architects and Marine Engineers, Vol. 92, 11-20. Ellingwood, B., Galambos, T. V., MacGregor, J. G., Cornell, C. A., 1980. “Development of a Probability Based Load Criterion for American National Standard A58,” National Bureau of Standards, Special Publication No. 577. Ayyub, B.M., Beach, J., and Packard, T., "Methodology for the Development of ReliabilityBased Design Criteria for Surface Ship Structures," Naval Engineers Journal, ASNE, 107(1), Jan. 1995, 45-61. Ayyub, B.M., Assakkaf, I., Atua, K., Engle, A., Hess, P., Karaszewski, Z., Kihl, D., Melton, W.,
13.
14.
15.
16.
Sielski, R.A., Sieve, M., Waldman, J., and White, G. J. Reliability-based Design of Ship Structures: Current Practice and Emerging Technologies, Research Report to the US Coast Guard, SNAME, T & R Report R-53, 1998. Atua, K. I., 1998. "Reliability-Based Structural Design of Ship Hull Girders and Stiffened Panels," A dissertation submitted to the Faculty of the Graduate School of the University of Maryland, College Park in partial fulfillment of the requirements for the degree of Doctor of Philosophy. Hughes, O. F., 1988. “Ship Structural Design, A rationally-Based, Computer-Aided Optimization Approach,” The Society of Naval Architects and Marine Engineers, Jersey City, New Jersey. Sikora, J. P., Dinsenbacher, A., and Beach, J. A., 1983. “A Method for Estimating Lifetime Loads and Fatigue Lives for Swath and Conventional Monohull Ships,” Naval Engineers Journal, ASNE, 63-85. Ang , A. H-S., Tang, W. H., 1990. “Probability Concepts in Engineering Planning and Design,” Vol. II Decision, Risk, and Reliability, John Wiley & Sons, NY. Ayyub, B. M., and White, A. M., 1987. “Reliability-Conditioned Partial Safety Factors”, Journal of Structural Engineering, Vol. 113, No. 2, February, ASCE, 280-283. Atua, K., Assakkaf, I. A., and Ayyub, B. M., 1996. "Statistical Characteristics of Strength and Load Random Variables of Ship Structures," Probabilistic Mechanics and Structural Reliability, Proceeding of the Seventh Specialty Conference, Worcester Polytechnic Institute, Worcester, Massachusetts. Assakkaf, I. A., 1998. "Reliability-based Design of Panels and Fatigue Details of Ship Structures," A dissertation submitted to the Faculty of the Graduate School of the University of Maryland, College Park in partial fulfillment of the requirements for the degree of Doctor of Philosophy. Mansour, A.E., Wirsching, P.H., and White, G.J., and Ayyub, B. M., 1995. “Probability-Based Ship Design: Implementation of Design Guidelines,” SSC 392, NTIS, Washington, D.C., 200 pages.
21