Journal of Rehabilitation Research and Development Vol. 40, No. 3, May/June 2003 Pages 253–264
Reliability of computer-automated hearing thresholds in cochlearimpaired listeners using ER-4B Canal Phone™ Earphones James A. Henry, PhD; Christopher L. Flick, BS; Alison Gilbert, MS; Roger M. Ellingson, MS; Stephen A. Fausti, PhD Department of Veterans Affairs (VA) Rehabilitation Research and Development National Center for Rehabilitative Auditory Research (NCRAR), VA Medical Center, Portland, OR; Department of Otolaryngology, Oregon Health and Science University, Portland, OR; VA Audiology Clinic, VA Medical Center, Portland, OR
effort was to develop a standardized testing device that can be used efficiently in audiology clinics. An important component of tinnitus testing is the precise measurement of hearing thresholds; thus, our computerized testing system has been programmed to perform such testing. The threshold testing protocol involved several unique features, however, that could potentially affect response reliability. First, the testing protocol was under full computer control and was directed by a testing algorithm that is designed to replicate human decision making. Second, thresholds were obtained to the nearest decibel, unlike conventional audiometric testing that uses 5 dB test increments. Third, the earphones used with the system were Etymotic Research
Abstract—This paper describes the second phase of a study to determine test-retest reliability of hearing thresholds using a computer-automated technique with ER-4B Canal Phone™ insert earphones. The first phase documented reliable hearing thresholds in 20 normal-hearing individuals. For this second phase, 20 individuals with cochlear hearing loss completed the same testing protocol as for phase one. During each of two sessions, hearing thresholds were obtained in one-third octave steps at 500 Hz to 16,000 Hz. The octave frequencies were immediately retested, followed by ear-tip reinsertion and further retesting at octave frequencies. Both groups showed overall good threshold reliability, with observable differences between groups. First, repeated testing resulted in improved hearing thresholds for the normal-hearing group, but not for the cochlear-loss group. Second, the normal-hearing group showed overall better response reliability, both within and between sessions, than the cochlear-loss group. These differences were small but consistent.
Abbreviations: ANOVA = analysis of variance, DLI = difference limen for intensity, ER = Etymotic Research, HL = hearing level, SD = standard deviation, SISI = Short Increment Sensitivity Index, SNHL = sensorineural hearing loss, SPL = sound pressure level. This material is based upon work supported by the Department of Veterans Affairs Rehabilitation Research and Development (RR&D) Service (C891-RA and RCTR 597-0160). All correspondence should be addressed to James A. Henry, PhD; National Center for Rehabilitative Auditory Research, VA Medical Center (NCRAR), P.O. Box 1034, Portland, OR 97207; 503-2208262, ext. 57466; fax 503-402-2955;
[email protected].
Key words: auditory threshold, hearing, reliability of results.
INTRODUCTION In the development of a tinnitus measurement technique, we used computer automation to achieve the highest degree of interexaminer and intersession consistency in conducting the testing [1–5]. The overall goal of this 253
254 Journal of Rehabilitation Research and Development Vol. 40, No. 3, 2003
(ER)-4B Canal Phone™ insert earphones that were designed for high-fidelity reproduction of music; i.e., they were not designed for audiometric testing. These earphones were deemed most suitable for an automated testing technique because of the need to use a single set of earphones for testing across a wide range of frequencies (500 Hz to 16,000 Hz). (Normally, audiometric testing at such high frequencies requires the use of special earphones.) For this testing system to be considered appropriate for clinical application, documentation of response reliability was essential. The unique features associated with this system necessitated a study to document the reliability of repeated threshold responses. We previously reported a group of 20 normal-hearing individuals who were tested repeatedly, both within and between sessions, to determine the test-retest reliability of their threshold responses [6]. Response reliability was shown to be good and compared well to other studies that had evaluated hearing threshold reliability using conventional supra-aural earphones [7,8]. We also needed to determine if the same response reliability could be demonstrated with individuals who have hearing loss. This present study therefore was to replicate the previous study of normal-hearing individuals with a group of cochlear-impaired individuals.
METHOD Subjects Twenty individuals with cochlear hearing loss completed all testing. One ear was selected as the test ear for each subject, and only that ear was tested. Selection of the test ear was made randomly, based on alternating right and left ears for subsequent subjects (10 right ears and 10 left ears were tested). For the test ear, the subjects were required to have hearing thresholds exceeding 25 dB hearing level (HL) at two or more of the frequencies between 250 Hz and 8,000 Hz. All but two of the subjects did not have tinnitus. Subjects consisted of four females and 16 males (age range = 28 to 86 years; mean = 61.4; standard deviation [SD] = 14.8). Instrumentation The equipment and procedures used for this study have been described in detail [2] and were identical to the previous study using normal-hearing individuals [6] (also available on-line http://www.vard.org/jour/01/38/5/
flick385.htm). Briefly, the system consisted of four major system components: (1) main controlling computer (Dell Dimension, 166 MHz Pentium central processing unit [CPU]) with a signal generator card (National Instruments, AT-DSP2200-128k) installed in an industry standard architecture (ISA) slot; (2) subject-response computer (Compaq Concerto 4/25); (3) signal processing module (custom built by Oregon Hearing Research Center, Oregon Health and Science University) used for signal mixing, attenuation, and earphone buffering; and (4) ER-4B Canal Phone insert earphones. An automated-calibration application was custom-programmed for the testing system. Procedures Testing procedures for the cochlear-impaired subjects were identical to those previously described for the normal-hearing subjects [6]. Each subject attended two test sessions separated by 1 to 7 days. Testing time was approximately 1 to 1 1/4 hours for Session 1 and less than 1 hour for Session 2. The full range of test frequencies for the automated testing protocol included 500, 620, 800, 1,000, 1,260, 1,600, 2,000, 2,520, 3,180, 4,000, 5,040, 6,360, 8,000, 10,080, 12,700, and 16,000 Hz (17 test frequencies separated by one-third octaves). Three stages of testing occurred during each session—Stage 1: hearing thresholds at all 17 frequencies, Stage 2: repeat hearing thresholds at the six octave frequencies (500, 1,000, 2,000, 4,000, 8,000, and 16,000 Hz) without removing the ear tip from the subject’s ear canal, and Stage 3: repeat Stage 2 following removal and reinsertion of the ear tip. At each test frequency, the initial presentation level was 60 dB sound pressure level (SPL). Step sizes for tone presentation were progressively reduced through a series of three bracketing protocols: (1) up 10 dB, down 20 dB; (2) up 5 dB, down 10 dB; and (3) up 1 dB, down 2 dB. During testing at a single frequency, the reversal rules were the same for each of the three bracketing series. The only differences between the series were the step sizes and the number of responses required during ascending tracks. For the start of each bracketing series, the tone presentations increased in level until a response was obtained. The response reversed the direction of stimulus output to descending steps. During the descending track, another reversal occurred when the first “no response” occurred following the presentation of a stimulus. For the first series, only one response was required during
255 HENRY et al. Reliability of computer-automated hearing thresholds
ascending tracks, and thus, two reversals. For the second and third series, two responses were required during ascending tracks, with four reversals. Pulsed pure tones of 400 ms duration and a 50 percent duty cycle were presented in segments of 2.4 s each. Thus five tones were presented per segment unless the subject responded during the segment, which terminated the stimulus presentation. Time intervals between segments were randomized between 1 s and 4 s following a response. (Intervals were fixed at 1 s when no response occurred.) The time required for each ascending or descending track varied according to subject response time. The average time to complete individual tracks was about 15 s. The computer started the tone presentations for the second bracketing series at a level of 10 dB below the response level obtained during the first series. Two responses were obtained for the last two bracketing series and were averaged for each series. The level of the first tone presented during the third series was the average response level obtained during the second series, less 2 dB. The “thresholds” obtained at each frequency, and subsequently reported, are based on the averages of the two responses obtained during the final bracketing series.
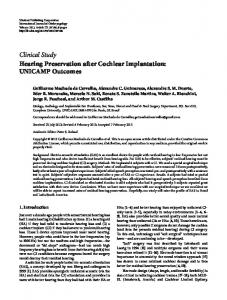
RESULTS Conventional Hearing Thresholds The Figure shows the mean conventional hearing thresholds, in dB HL, for the test ears (using a Virtual Model 320 audiometer). Mean hearing thresholds are shown separately for the subjects in the present study and for the normal-hearing subjects from the previous study [6].
Figure. Mean hearing thresholds in dB HL for test ears of subjects in normalhearing and cochlear-loss groups.
Mean hearing thresholds were compared between the Virtual Model 320 audiometer and the automated system at the test frequencies that were common between systems: 500 Hz, 1,000 Hz, 2,000 Hz, 4,000 Hz, and 8,000 Hz. This comparison required use of the same decibel metric; thus, the dB HL thresholds obtained from the Model 320 were converted to dB SPL [9]. Note that, although the two earphones produced equal SPL in their respective calibration couplers, the sound pressure was not necessarily equal at the eardrum. It would thus be expected that differences in mean thresholds would be observed between the two systems even with the use of the same decibel metric. Table 1 shows that these means differed by about 1 dB to 2 dB at 500 Hz, 1,000 Hz, and 2,000 Hz, and the differences increased to 4.1 dB at 4,000 Hz and to 7.3 dB at 8,000 Hz. To test for significance, we calculated t-tests. The multiple
Table 1. Mean hearing thresholds, in dB SPL, obtained with two systems: (1) Virtual Model 320 audiometer with TDH-50P earphones and (2) automated system with ER-4B Canal Phone™ earphones.
Mean Hearing Threshold (dB SPL)
p Value*
Frequency (Hz) 500 1,000 2,000 4,000 8,000 *Results
TDH-50P Supra-aural Earphones
ER-4B Canal Phone Earphones
25.8 25.0 40.1 60.3 68.0
24.5 27.0 41.2 56.2 60.7
of paired t-tests—only the means at 8,000 Hz differed significantly after corrections for multiple tests using Bonferroni’s method.
0.1553 0.0329 0.4526 0.0874 0.05). At the test frequencies where there was an N of 20 (500 Hz to 5,040 Hz), 44 percent of the differences were positive, 34 percent of the differences were negative, and 22 percent of the responses were equal across sessions. The SDs of the differences are shown in Table 2, where it can be seen that they ranged from 2.5 dB to 11.5 dB, with an average SD of 5.4 dB. Pearson product-moment correlations were also evaluated for each frequency, and the Pearson r’s are shown in Table 2. Each of these r values was ≥0.747, and all coefficients were significant at p < 0.0001, except at 16,000 Hz (r = 0.520; p = 0.3186). We also determined the average magnitude of the differences between sessions by calculating the absolute value of each subject’s between-session threshold difference at each frequency. The means of these absolute values are shown in the last column of Table 2 and ranged from 1.8 dB to 6.3 dB. The average difference, ignoring the direction of the differences, was 3.3 dB (as compared to 2.5 dB for the normal-hearing subjects).
Confidence Intervals for Difference Scores To show the range of individual between-sessions differences in hearing thresholds, Table 3 displays the confidence intervals for the difference scores. A total of 279 between-sessions threshold differences were found, and difference scores were grouped according to the indicated confidence intervals ranging from ±1 dB to ±20 dB. Of the 279 differences, 233 (83.5 percent) were within ±5 dB, 268 (96.1 percent) were within ±10 dB, and 271 (97.1 percent) were within ±15 dB. We expanded the assessment of between-sessions confidence intervals to analyze confidence intervals at the individual test frequencies. Table 4 shows that, in general, between-sessions responses were most reliable at frequencies between 1,000 Hz and 8,000 Hz. Table 4 also displays the corresponding percentages obtained from the normal-hearing subjects for a direct comparison of reliability between the normal-hearing and cochlearimpaired groups [6]. At most test frequencies, betweensessions response reliability is seen to be slightly better for the normal-hearing subjects. Within-Session Reliability Table 5 shows the within-session mean threshold differences for the sensorineural hearing loss (SNHL) subjects. Thresholds were obtained three times during each session, and these three trials are referred to as Stage 1, Stage 2, and Stage 3, as in Table 2. There were three possibilities to calculate differences between responses
Table 3. Confidence intervals for between-sessions differences in hearing thresholds.
Interval (dB) in Which Between-Sessions Threshold Differences Occurred From (≥)
*
Cumulative Number of Differences*
Percent of Differences†
To (