Reliability of large power units in probabilistic approach Janusz Buchta, Andrzej Oziemski Technical University of Łódź Institute of Electrical Power Engineering Łódź, Poland
[email protected],
[email protected] Abstract— The paper presents results of reliability analysis made for the 370 MW power units installed in the Bełchatów Power Station (Poland). The concept of standardized power unit and the method of a histogram with a set number of observations in each class was applied in a study. The study includes analysis of probability distributions of operation times and repair times for the main power unit components. Empirical probability distribution functions are identified and their parameters are estimated in the study. The final forecast includes an estimation of such reliability measures like expected operation time, expected failure rate, average repair time and expected annual failure duration. Keywords- power system reliability, power station
I. INTRODUCTION Large power units have a considerable effect on the operation of the electric power system. This entails a qualitatively different approach to the use of the existing potential, with special regard to the problem of reliability of installations. The measure of reliability are indices, determined on the basis of the data on the power plant operation, which are initial quantities for forecasting, i.e. determining their forecast values. The knowledge of the current and forecast values of failure rates, their changeability during the power plant operation is, in turn, the basis for determining installation modernization programs, rationalization of repair and materials management, and setting quality requirements for manufacturers. Globally, availability factors and failure rates of power units of all power plants serve the purpose of
determining an indispensable power reserves and controlling the operation of the power system. The research of power units reliability has been made for many years in all developed countries [1, 2]. The fully computerized scheme for reliability estimation of power units operating in power system was initiated in Poland in late 1980s. At present, Polish power stations voluntarily send information about all failures to the Energy Market Agency which prepare statistical studies in Poland. The Bełchatów Power Station also participates in this project. In authors' opinion such a system of collecting and estimating reliability ratings and excess of power capacities allows to qualify some of break-downs as scheduled repairs. As a result, information about power station availability can be incomplete. The Bełchatów Power Station, which is the subject of the study, is the largest brown coal fueled power station in Europe with capacity of 4440 MW. The power station has around 20% share in electricity generation in Poland. Due to the modernization program the capacity of single power unit has increased from 360 up to 370 MW. II.
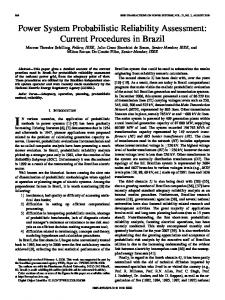
PERCENTAGE PROPORTION OF SHUT-DOWNS OF 370 MW UNITS Since the first of dozen 370 MW units was commissioned in the Bełchatów Power Station in 1982, a systematic research on power units reliability was initiated by the Institute of Electrical Power Engineering at Technical University of Łódź [3, 4, 5]. Information on the failure frequency, times of failures and installation repairs have been recorded in computer
database as well as their physical causes have been determined. Statistical data files of the successive years of the power station operation have been systematically complemented and verified. The verification of statistical data consist in elimination of events which are not of random origin (i.e. actively influenced by operation and maintenance staff) and these, which were not qualified as break-downs only because there was enough ready-reserve power during failure. The records of failure frequency of installations, containing the description and analysis of the failure and other materials filed by the operation monitoring services constitute the basic source of information on the failure frequency and range of repairs of generating devices of power units. Following the establishment of the computer database, these materials are systematized and used to make statistics and forecasts for selected power unit plants that constitute weak points in the process of power generation. The investigations were carried out for all the twelve 370 MW power units installed in the Bełchatów Power Plant, and the time of observation of their operation covered the period from the beginning of the operation until the end of 2006. As a result, statistical material concerning over 2000 cases of emergency shut-downs of the power units has been accumulated. a) W 1,9%
F
O 3,1%
6,6%
G 12,7%
57,7% 18,0%
T
B
b) F W O 2,6%
G T
9,8% 9,4% 77,4%
B
Figure 1. Percentage proportion of shut-downs of 370 MW power units of Bełchatów Power Station depending on the failure location presented in: a) a quantitative approach, b) a time approach. Explanations: B - steam boiler and its auxiliaries, T - steam turbine and its auxiliaries, G - generator and its auxiliaries, F - system of feed water pumps, W - system of cooling water and service water pumps, O - others (including failures of electrical devices).
Fig. 1 shows a percentage proportion of shut-downs of 370 MW units that have been recorded for the whole period of power station operation. All shut-downs are classified depending on the failure location and presented in quantitative or time approach. The statistics of failures shown in Fig. 1 indicates that the BB-1150 boiler is the most serious source of disturbances reducing the availability of power station. Modern steam boilers consist of tubular heat exchangers (economiser, evaporator tubes, steam superheaters) which are influenced by thermal stresses in high temperature and by chemical and mechanical interaction between steam, water or flue gas. Cumulating all of these factors causes high failure frequency of tubes forming heating surfaces in boiler. III.
PROBABILITY DENSITY FUNCTIONS OF OPERATION TIMES AND REPAIR TIMES FOR THE MAIN COMPONENTS OF THE 370 MW UNITS
The last of dozen units installed in the Bełchatów Power Station was synchronised seven years after the first one was commissioned. All units are homogenous in several respects such as constructional uniformity and similar conditions in which units operate. Therefore the idea of a standardized unit has been introduced into the reliability study of the 370 MW units. The standarized unit is the unit in its useful life with stabilized failure rate that substitutes a dozen of power station units. The assumption that a standarized unit is in its useful life requires to exclude a period of an early life from an operation time of respective power units. The concept of a standardized unit allows to obtain an appropriately numerous population of failures not only for a power unit but also for its main generating devices (boiler, turbine, generator) and boiler elements. While establishing the population, the cases of incidental failures that occurred in the initial period of the power plant operation were neglected. It particularly refers to units 1 and 2 during the first three years of the power plant operation. The cases of failures that occurred in first year of operation were also skipped for remaining units. One can state that a higher failure frequency of a 370 MW power units in the initial period of their operation was caused mainly by a design, construction and assembly defects. All these factors are distinctive for an adaptation of new generation power units. Therefore this period was excluded while population of failures for a standardized 370 MW unit was selected. To forecast operational states, the technological systems were disassembled, and the failures were classified according to their location and causes. Calculation unit was implemented in computer database to identify probabilistic models for empirical distributions of operational times and shut-down times of standardized 370 MW unit. Considering times of failures recorded in a computer database, times to failure and times of failure duration have been calculated. The statistical data sets have been obtained for chosen components of 370 MW power unit. The histogram is often used in statistical data analysis to illustrate the major features of the distribution of the data in a convenient form. It divides up the range of possible values in a data set into classes. In a classical histogram, each data class spans the interval of the same width. The height of a rectangle drawn above each class is proportional to the number of
observations in the class. The shape of the histogram sometimes is particularly sensitive to the number of classes. If the classes are too wide, important information might get omitted. On the other hand, if the classes are too narrow, the meaningful information fades due to random variations and small number of data in each class. The histogram with a constant width of class interval dispossesses a random sample of its statistical attributes. The classical histogram is generally used when dealing with large data sets (more then 100 observations). It’s difficult to get such a large data sets in a reliability analysis of an engineered systems. The method of a histogram with a set number of observations in each class was applied in a presented study instead a classical histogram. On the contrary to a classical histogram, the histogram with a set number of observations in each class preserve all statistical features of data set. This histogram is prepared according to the following steps: - sorting numbers in a data set of n observations in an ascending order t1, t2, t3, … tn; - calculating number of classes r by the formula r = 2ln(n) and rounding down r to the nearest integer; - calculating number of observations m in each class by the formula m = n / r and rounding down m to the nearest integer; - assigning all observations to each class in such a way that equal numbers from a data set are included in the same class; therefore the number of observations in the i-th class – ni can vary from an assumed value m; - determining the lower and upper bound of each class; for example the upper bound of the 4th class (lower bound of the 5th class) is an arithmetic mean of the greatest number included in the 4th class and the lowest number included in the 5th class; - calculating the i-th class interval width - ∆ti as the difference of its upper and lower bound; determining the i-th class midvalue – ti as an arithmetic mean of its lower and upper bounds; - calculating the value of an empirical probability density function by the formula ni (1) f x (ti ) = n ⋅ ∆ti The histogram is completed by drawing a bar for each class. The histogram with a set number of observations in each class can be applied for a less numerous data sets (n ≥ 40). An empirical probability density function f x(t) is compared with the shape of the density function of different theoretical distributions [6, 7] (expotential, Weibull, normal, log-normal), and subjectively best distribution is selected as the one representing the random variable under investigation. The hypothesis thus constructed is verified by means of (Pearson's and Kolmogorov) statistical tests of goodness of fit and only on this basis is the decision made to accept or reject it. All calculations are performed for the standard significance level α = 0.05 [6, 7]. The Kolmogorov test compares the empirical distribution function with the cumulative distribution function specified by the null hypothesis and tests goodness of fit with this distribution. The hypothesis regarding the distributional form is rejected if the test statistic, λ, is greater than the critical value λα obtained from a table (λ0.05 = 1.358). Person’s chi-
square test is an alternative to the Kolmogorov goodness-of-fit test. For the chi-square goodness-of-fit computation, the data are divided into r classes and the test statistic χ2 is calculated [7]. The hypothesis that the data are from a population with the specified distribution is rejected if χ2 〉 χ2(α, r-c ). The critical value χ2(α, r-c ) is the chi-square percent point function with r - c degrees of freedom and a significance level of α. The variable c is the number of estimated parameters for the distribution increased by 1. For example, for a 3-parameter Weibull distribution, c = 4. A Weibull distribution is very popular statistical model in reliability engineering and failure analysis. Operation times are modeled in the study by a Weibull distribution with the probability density function defined as follows: b −1 t b b t (2) f (t ) = ⋅ ⋅ exp− a a a where b is the shape parameter and a is the scale parameter When b = 1, then the Weibull distribution reduces to the exponential distribution. Failure duration times are modeled in the study by a log-normal distribution with the probability density function defined as follows: (ln t − m )2 1 (3) f (t ) = ⋅ exp− 2 ⋅σ 2 t ⋅ σ ⋅ 2π where m is the mean of the natural logarithms of the failure duration times and σ the standard deviation of the natural logarithms of the failure duration times. Consider the histogram shown in Fig. 2a. The data set consists of n = 256 observations. The number of class intervals equals r = 11. According to the table shown in the upper-right corner, each class includes 23 or 24 observations, so that it’s a histogram with set number of observations. The width of the 1st class interval is 167 hours, the width of the 2nd class interval – 334 hours, the 3rd class – 610 hours, etc. The width of each class interval varies from another but the number of observations in each class is near the same. The hypothesis of the Weibull distribution has been tested. The shape and scale parameters of the Weibull distribution have been estimated for a given data set. The statistics χ2 and λ have been calculated in Pearson’s and Kolmogorov tests. The obtained values are less then critical statistics χα2 and λα respectively, so that both tests accept the Weibull distribution with parameters a = 1592.2 and b = 0.838. An investigated probability distribution functions were identified as Weibull distributions with parameter b < 1 (Fig. 2). The Weibull distributions were fitted but operation times are most often modeled by an expotential distribution. The analysis of considered statistical data sets has shown that an expotential distribution can be applied as well, but the Weibull distribution better fits to investigated probability density functions. If the shape parameter b is less then 1, this would suggest that failure rate decreases over time.
b)
a)
t [h]
t [h]
Testing of hypothesis of Weibull distribution: a = 1592.2, b = 0.838 Pearson's test: χ2 = 17.500, χα2 = 18.307 Kolmogorov test: λ = 0.588, λα = 1.358
Testing of hypothesis of Weibull distribution: a = 4615.6, b = 0.696 Pearson's test: χ2 = 13.024, χα2 = 15.507 Kolmogorov test: λ = 0.765, λα = 1.358
d)
c)
t [h]
t [h]
Testing of hypothesis of Weibull distribution: a = 3943.8, b = 0.809 Pearson's test: χ2 = 15.325, χα2 = 15.507 Kolmogorov test: λ = 0.796, λα = 1.358
Testing of hypothesis of Weibull distribution: a = 8097.7, b = 0.737 Pearson's test: χ2 = 9.819, χα2 = 14.067 Kolmogorov test: λ = 0.409, λα = 1.358
Figure 2. Probability density functions of operation times for: a) boiler BB-1150 - Weibull distribution, b) turbine 18K360 - Weibull distribution, c) boiler evaporator - Weibull distribution, d) P1B convection superheater - Weibull distribution. Explanations: a, b - estimated parameters of Weibull distribution, χ2 - the value of Pearson's statistics, χα2 - the critical value of Pearson's statistics for the significance level α = 0.05, λ - the value of Kolmogorov statistics, λα - the critical value of Kolmogorov statistics for the significance level α = 0.05 i – the class number, n - the sample size, r - the number of classes, sum - the total value of all the observations in the sample, ni - the number of observations in the i-th class, fi - the value of empirical probability density function for the i-th class
b)
a)
t [h]
Testing of hypothesis of log-normal distribution: m = 1.369, σ = 0.697 Pearson's test: χ2 = 8.194, χα2 = 9.488 Kolmogorov test: λ = 0.671, λα = 1.358
t [h]
Testing of hypothesis of log-normal distribution: m = -0.072, σ = 0.421 Pearson's test: χ2 = 9.172, χα2 = 12.592 Kolmogorov test: λ = 0.735, λα = 1.358
Figure 3. Probability density functions of repair times for: a) long-term failures of generator GTHW-360 (log-normal distribution), b) short-term failures of generator GTHW-360 (log-normal distribution). Explanations: m, σ - estimated parameters of log-normal distribution
In emergency states, strong dependence of the time of damage liquidation on the cause of its occurrence was found. Average times of shut-downs, in the case of permanent defects of the installations clearly differ from the times of shut-downs caused by the incorrect operation of the automatic control systems and safety devices, the operational staff mistakes and the like. And so, the values of times are as follows: 41.4 h and 1.85 h for the boiler, 64.1 h and 2.07 h for the turbine, 84.8 h and 1.89 h for the generator, 45,2 h and 1.91 h for feed water pump, respectively. Thus, it should be concluded that the times of long-term failures and short-term defects belong to two statistically different populations and that it is advisable to study their distributions separately. Generally speaking, the distributions of failure duration times are log-normal distributions (Fig. 3).
The results indicate that the evaporator is the most defective element in technological track of 370 MW power unit. The mean time of the shut-down duration is approx. 40 h, which with the expected number of failures over the year of 1.45 gives the total duration of shut-downs of approx. 58 h. The expected time between failures of 4430 h is, in this case, the shortest of all the elements under investigation.
By means of estimation, parameters of identified probability distribution functions of operation and repair times have been calculated for investigated devices of 370 MW units. Such reliability indices as expected failure-free time, expected failure rate, expected mean time of the shut-down and expected annual time of shut-downs have been estimated. Table 1 presents expected values of basic reliability indices for a standardized 370 MW unit and its main components. Table 2 contains the results of reliability forecasts for shut-downs of important elements of the BB-1150 boiler, i.e. for an economizer, evaporator, inner suspended pipes P1A, convection superheater P1B, outlet superheater PIV, reheater and all superheaters summed up.
The appropriate level of power system reliability is ensured by keeping the high-level reliability of its subsystems (power generation, transmission and distribution) and components (power units, overhead lines, transformers, protection etc.) [1, 8, 9]. The experience in power system operation shows that failure frequency of power unit components (boiler especially) is many times higher than other components of the power system. According to Polish [10] and Canadian [11] research on transmission and distribution components reliabilty, the failure rate is 0.012÷0.15 per annum for power transformers, 0,028÷0,098 per annum for switchgear and 0.025÷0.041 per annum for busbars.
TABLE I.
FORECASTS FOR FAILURES OF THE BASIC POWER STATION SYSTEMS
Failure location Ba T G F W O Unit
Expected failure rate [1/a] 3.67 1.09 0.70 0.45 0.25 0.46 5.98
Mean time of a shut-down [h]
Total time of shut-downs [h/a]
36.8 15.2 29.9 11.5 5.5 4.0 28.1
135.2 16.6 20.9 5.1 1.4 1.8 167.7
Mean time between failures, [h] 1740 5870 9200 14400 25960 14010 1070
a. The same acronyms as Fig. 1 explanations
TABLE II.
FORECASTS FOR RELIABILITY INDICES OF THE MOST DEFEC TIVE ELEMENTS OF THE BB-1150 BOILER
Boiler element
Expected failure rate [1/a]
Mean time of a shutdown [h]
Total time of shutdowns [h/a]
Mean time between failures [h]
Economiser
0.29
41.0
11.9
22470
Evaporator Inner suspended pipes P1A Convection superheater P1B Outlet superheater PIV
1.45
39.9
57.8
4430
0.38
41.8
15.9
16850
0.66
46.1
30.4
9780
0.29
56.3
16.3
22290
0.27
41.2
11.2
23630
1.44
45.1
65.0
4440
Reheater All superheaters (total)
IV.
CONSLUSIONS
Electric power blackouts experienced in United States, Great Britain and Italy reminded the importance of power system reliability. These incidents have shown that the occurrence of a massive outage is feasible and can happen in each country.
Basic power unit components are complicated thermal and mechanical installations (boiler, turbine set, auxiliaries) which are processed by intensive fatigue or wear and tear. These effects appear in less degree in typical electrical devices in which the ageing process concerns only mechanical elements and organic insulation. Therefore, power units are the most unreliable components of the power system and their reliability analysis differs from the other power system components. Investigations referring to 370 MW power units installed in the Bełchatów Power Station have been carried out systematically for a number of years. The results allow to analyse a changeability of reliability indices in a long-term perspective and define reasons or effects of defective operation of generating devices. The knowledge of the current and forecast values of failure rates can be useful to determine modernization schedules or to rationalize repair and materials management. The failure rate is a reasonable measure for a durability of generating devices and an indication for economical effectiveness of repairs. REFERENCES [1] [2] [3]
[4]
R.N. Allan, R. Billinton, “Power system reliability and its assessment”. Power Engineering Journal. July 1992, November 1992, August 1993. “Generating availability data system. Data reporting instructions”, North American Electric Reliability Council, New Jersey, October 2002. E. Bilkowski, M. Gieras, J. Skierski, A. Oziemski, R. Sikora, “Niezawodnościowe wskaźniki eksploatacyjne bloków 360 MW Elektrowni Bełchatów S.A.”, Energetyka, March 2003, pp. 144-149. E. Bilkowski, M. Gieras, J. Skierski, A. Oziemski, “Niezawodność elektrowni Bełchatów S.A. w ujęciu statystycznym”, BMP 2003, No 6, pp.14-18.
[5]
[6] [7] [8]
M. Pawlik, J. Skierski, A. Oziemski, “Zuverlässigkeitsbewertung von Braunkohlegefeuerten Kraftwerksblöcken großer Leistung“, XXXIII Kraftwerkstechnischen Kolloquium. Dresden, Germany, October 2001, pp. 141-152 R.E. Barlow. F. Proschan, “Mathematical theory of reliability”, Wiley, New York, 1965. D. Kececioglu, “Reliability Engineering Handbook”, DEStech Publ., 2002. J. Paska, P. Wójcik, J.Bargiel, W. Goc, P. Sowa, “Data for electric power system calculations”, 8th International Conference on Electrical Power Quality and Utilisation, September 2005, Poland, pp. 477-482
[9]
J. Paska., “Generation system reliability and its assessment”, Archiwum Energetyki, No 1-2, 1999. [10] J. Paska, J. Bartczak, A. Kłos, A. Momot, E. Nowakowska, J. Bargiel, W. Goc, P. Sowa, B. Teichamn, “Application of TRELSS and implementation of value-based reliability approach at Polish Power Grid Company”, TR-114816 EPRI, Palo Alto, CA and PPGC Warsaw, Poland, 2000. [11] R. Bilinton, ”Canadian experience in the collection of the transmission and distribution component unavailability data”. 8th International Conference on Probabilistic Methods Applied to Power Systems – PMAPS 2004, September 2004, Aimes – Iowa, USA.