F. Dell'Acqua, Senior Member, IEEE and P. Gamba, Senior Member, IEEE. AbstractâIn this ... mentioned possibility of a fast processing and the huge impact of the monitored .... 3) data analysis: usually performed by means of pixel- based or ...
1
Remote sensing and earthquake damage detection: experiences, limits and perspectives F. Dell’Acqua, Senior Member, IEEE and P. Gamba, Senior Member, IEEE
Abstract— In this paper a survey of the techniques and data sets used to evaluate earthquake damages using remote sensing tools is proposed. Starting from some preliminary definitions about earthquake damages, their evaluation scale and the difference between identification of damage “extent” and identification of damage “level”, the advantages and limits of different remote sensing data sets are presented. At the same time, multiple algorithms for data interpretation and information extraction are explored, also by means of a couple of test examples. According to the outcomes of this survey, open issues are finally presented and discussed, identifying possible research lines as well as working solutions.
I. I NTRODUCTION Remote sensing data interpretation techniques have dramatically improved in the last decade, and have been actively applied to a number of different applications. Current procedures include the possibility to process Earth Observation (EO) data within days, if not hours, of their acquisition. As a consequence, EO data is a natural choice for disaster monitoring, thanks to the wide area coverage, the above mentioned possibility of a fast processing and the huge impact of the monitored phenomena with respect to human and economic losses. Accordingly, while there are on-going activities including EO data within other phases of the so called “risk cycle”, the main use of EO data so far in disaster monitoring is in the post-event phase. Within the pool of the numerous natural and man-induced disasters that humans face, a special role is played by earthquakes, due to their unpredictability, the usually high impact on a country or a region, and the need for a fast and accurate response in the hours immediately following the event. Earthquakes are major disasters with a consistently high frequency of occurrence. According to the USGS, globally there were more than 17 earthquakes per year with a magnitude 7 and higher in the last 18 years. Big earthquakes are likely to affect a large number of people and a wide geographical area. Just to list the numbers for one of the last major event, the May 2008 earthquake in China caused the destruction of 420,000 homes, more than 70,000 casualties and 5 million homeless, according to the MCEER Information Service [1]. With respect to earthquakes, EO data are currently used to provide many different information, usually by means of printed maps for the rescue teams on the ground, or digital layers for use in Geographic Information Systems (GIS) platforms. According to the experience by the Service Providers The authors are with Dipartimento di Elettronica, Universit`a di Pavia, Via Ferrata, 1, 27100 Pavia, Italy.
involved in rapid disaster mapping tasks in the framework of the European Global Monitoring for Environment and Security (GMES) Initiative, the final “users” are usually looking for three different products: basic mapping or background space-map products: mapping of the infrastructures, population density, trafficability maps identifying roads, transport networks and their state at the time of the crisis (examples are available at [2]); rapid damage assessment: these are maps, maps of the extent of the damage impact and maps of the estimation of the damage (level of destruction, etc.) that in all cases are produced rapidly; typical EO damage maps are providing zones of damage with different damage levels, either based on a regular grid (e.g. with a 500 m or 1000 m cell size) or based on image segmentation following the structure of the observed area (examples are available at [3]); detailed damage assessment : these are maps of the extent of the damage impact and maps of the estimation of the damage (level of destruction, etc), produced within the crisis time frame, i.e. usually within a few days (examples are available at [4]). While the first product is common to different disasters, the second and third ones are specific to earthquakes and are usually obtained either: by means of a change detection technique using a prepost image pair with same sensor/same geometry; by means of a change detection technique using pre- and post-event data from different sensors; by means of an interpretation technique applied to a single post-event data set. Additionally, data fusion with existing pre-event GIS layers and in situ information (e.g. by seismic sensors) may also be considered. The scope of this paper is to introduce first the problem and quickly outline the possibilities and limits of EO data in earthquake damage assessment (Section II). Then, a more detailed analysis of the experiences proposed in technical literature with respect to the problem under investigation is proposed (Section III). Finally, open issues as well as possible future research lines are introduced and discussed in Section V. Between the state-of-the-art survey and the perspectives, two operational examples in real test cases are proposed in Section IV.
II. E ARTHQUAKE DAMAGE ASSESSMENT FUNDAMENTALS Before entering into the details of the methodologies used for earthquake damage assessment, some preliminary considerations may be useful. Indeed, after an earthquake there are several damages that could be considered: 1) damages to buildings and other built-up structures (such as bridges, dams, ports, . . . ); 2) damages to infrastructures, such as roads, highways, lifelines, water pipes, . . . ; 3) secondary damages, such as those due to landslides or floods triggered by the earthquake, soil liquefaction and similar. . Moreover, for each of this damages, it is still necessary to discriminate between damage extent and level identification. In this work we mainly focus on the first type of damages, as the second and third ones are usually only marginally covered by the use of remote sensing techniques, with the main exception of landslides [5] or barrier lakes [6]. Damage extent identification for buildings and built-up areas is, in principle, relatively straightforward (e.g. from Very High Resolution - VHR - EO data), especially in the case of complete collapse, because man-made objects visibly change their shape (in most cases for regular to less regular, and with a loss of shadow effects) when affected by an earthquake [7]. Damage level assessment, instead, is a much more complex task, due to the definitions used in earthquake engineering and referring mostly to ground-based evaluations and structural effects on portions of the structure (e.g. walls), that might be partially or totally invisible to nadir-looking sensors [8]. As a matter of fact, fast earthquake damage extent assessment was and is still routinely performed by aerial manned or unmanned flights, including usage of commercial footage from helicopter-based TV cameras [9]. The use of more rigorous data interpretation techniques based on airborne or spaceborne sensor, able to provide a geographically accurate extent of the affected area has never been considered as a complex task, although their automatic implementation may reveal some challenges, as mentioned in next sections. The major problem is indeed damage level acquisition, because definitions and best practices coming from national civil protection organizations, earthquake engineers and professionals do not completely match with observables in EO data. Specifically, damage level assessment is mostly obtained in situ, by means of structural surveys carried out by expert teams visiting the damaged area. Typically, a written or electronic form for each building is completed, with information about the damage extent and level, adding notes about the status of the building parts, and including any structural damages (e.g. cracks in the walls). These surveys are completed by a set of georeferenced photographs and require a considerable amount of time and effort. In a coarse way, individual building damage states are labelled according to scales agreed at the regional level (e.g. the European Macro-seismic -EMSbuilding damage scale [10]). As noted by looking at the EMS scale graphical representation of the damages on pp-15-16 of the cited book, and supported by experimental evidence in many researches (notably in [11]), there is no straightforward
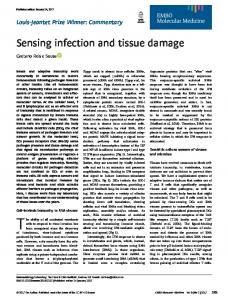
way to map these damage states into information visible in EO data, and the best that could be achieved is an even coarser evaluation, where the 5 EMS classes are reduced to three by clustering them in different ways (see Section IV for an example). Discrepancies between EO data and in situ surveys are shown in fig. II, where a small sample of a Quickbird image recorded on April 12 2009 over the town of L’Aquila, Italy is compared with ground photos of damaged buildings. As a matter of fact, the limits of EO data in capturing the full range of earthquake related damages stem from their own nature. To better explain the point, we will address in the following all sorts of EO sensors, from nadir-looking and side-looking optical imagers and radars to 3D sensors, such as lidars. Specifically, aerial and spaceborne nadir-looking sensors (such as VHR optical ones) can collect information about the status of the building roofs and the presence/absence of debris close to the building lateral walls. An increase in spatial resolution may allow a better characterization of the damaged vs. undamaged class, but won’t be effective with respect to intermediate damage levels, that can be discriminated only by considering the status of the walls. Sidelooking sensors (such as optical oblique photos) may capture more information, and are more relevant to the damage level assessment task, but they pose serious problems with respect to georeferentiation of the data and positional errors. They are also less frequently available, as the only side-looking spaceborne sensors are radar ones, whose performance in urban areas is limited by shadowing and layover issues [12]. For optical sensors in this group, a finer spatial resolution may be instrumental to extract details of the wall damages, and refine the damage level assessment. Their use is however mostly at the experimental stage, due to the above mentioned limited availability, the higher operational costs and the complexity of the data interpretation routines, which are currently performed by visual inspection [13]. Finally, 3D sensors have been recently used experimentally after the Haiti earthquake [14], but no actual assessment of their performance with respect to damage detection has been attempted. One may expect that 3D information may reveal partial or total collapse better than bidimensional optical or radar data, but that no advantage with respect to wall damage characterization can be obtained. In summary, as better discussed in next section where individual experiences are considered, the use of EO data for earthquake damage assessment is basically limited by two main factors: the nature of the sensor and its orientation with respect to the target area; the spatial resolution, which may or may not allow the characterization of the damages at the chosen level of detail, meaning both the damage level and the spatial or geographical detail. III. E XPERIENCES IN EARTHQUAKE DAMAGE ASSESSMENT USING EO DATA As mentioned in the previous section, sensors used for earthquake damage assessment are quite various, either in spatial resolution (from HR to VHR), or in spectral resolution (from
Fig. 1. A small portion of L’Aquila city center as imaged by the VHR optical sensor on board of the Quickbird satellite, compared with ground photos of some of the buildings in the area. Details corresponding to important damages are completely invisible from space, and clearly visible from the ground.
panchromatic to multi-spectral), or even in frequency (from visible to near infrared to microwaves). Surveys referring to data and techniques for this task are available in [15] and [16], and partially, in the context of EO data for disaster assessment, in [17], [18] and [19]. Like the data, techniques are also very different. Following the definition in [17], the EO data processing chain for earthquake damage assessment is usually subdivided into the following steps: 1) pre-processing, including atmospheric and geometric corrections, fusion of panchromatic and multi-spectral data sets, filtering and contrast enhancements; 2) geo-referentiation, including co-registration of multiple EO data sets at different spatial resolution with available GIS layers in the reference projection/geoid most useful for the final user(s); 3) data analysis: usually performed by means of pixelbased or object-based approaches on the co-registered EO data sets, including classification, segmentation, geometrical as well as spectral feature extraction, selection and fusion. 4) information extraction, including spatial analysis, change detection, inference, and fusion of multiple data sources as well as the above mentioned GIS layers. Although there are dedicate approaches for the first step
(e. g. [20] and [21]), we will focus on the last two steps of the procedure, providing a survey of the available procedures used to extract earthquake damage extent and level estimation. Although we assume that pre-processing and geo-referencing is done properly, it must be acknowledged that these steps are crucial and a correct implementation of each of them is often the first issue in operational services, because of the lack of uniformly validated reference data sets, the different implementations of these steps in different commercial or research software and the large impact of pre-processing enhancement steps on the data interpretation and information extraction procedures. Please note that this review does not include algorithms considering 3D data. Although there is the possibility to use these data for change detection [39], no actual application to earthquake damage detection has been reported so far. A. Post-event optical data The most usual approach in earthquake damage detection is the interpretation of post-event optical data. When available, nadir-looking sub-meter resolution satellite or aerial images are preferred, and visual interpretation as well as more sophisticated semi-automatic algorithms have been already applied to many events. Techniques to interpret oblique view aerial data are also considered within this groups of methodologies.
Visual interpretation of VHR images have been considered since the first images were made available. one of the first example, referring to the May 2003, Boumerdes (Algeria) earthquake is available in [22], where multiple experts’ and non-experts’ opinions were combined to achieve a sufficiently robust damage detection using the EMS detection scale. Comparison was provided with respect to ground survey, and it was noted that major difference between visual evaluations of different interpreters was achieved for lighter damage states (grades 1 to 3 of the EMS scale). A similar example, using Cartosat-1 and Resourcesat-1 imagery for the October 2005 Pakistan earthquake is proposed in [23]. In this work, only “damaged” buildings are extracted, due to the limited spatial resolution of the data. Finally, SPOT HRVIR data is considered in [24] and collapsed buildings are extracted and compared with government statistics based on field surveys. Again, only collapsed buildings are considered and no attempt to further discriminate other different levels was done. Semi-automatic approaches based on post-event optical data only are usually based on classification, aiming at a land use class containing one or more “damage” classes. A very interesting example, using pattern recognition techniques to achieve a robust classification and therefore what the authors call “damage patterns” is [25]. Pixel-base pairwise classifiers are applied to VHR images of the December 2003, Bam (Iran) earthquake and the “damage” class is isolated and used to extract percentages of damages in aggregated in pixel windows. A comparison with available ground truth shows that this aggregation provides interesting results with respect to discretized damage percentages. A more refined example, using post-event aerial images, is proposed in [26]. Segmentation techniques are used to extract the shadow of individual buildings after the earthquake using VHR aerial data, assuming their shape is available as a stored GIS layer. By comparison between the detected shadow and the original shape of the building a robust classification between damaged and undamaged buildings is achieved. This work is interesting because it show how to extract damage information from inference, as opposed to extract damages from direct classification as in the previous cited work. Its limits are however clear, since not all damages may be inferred by the proposed methodology, and a simple damaged/undamaged binary decision is achieved. Finally, oblique imagery may be used to asses damages, as in [27],[9], and [13]. The research in [27] describes the development of a very sophisticated and semi-automatic framework to exploit oblique video data, by combining multiple frames and identify damages based on color changes as well as textural characteristics. Results are similar to [9] in the sense that they strictly depend on the quality of the video and the stability of the platform for correctness of the damage assessment and its location, respectively. Visual interpretation is also considered in [13], whose most important result is the comparison between damage levels for individual buildings using oblique imagery and VHR nadir-looking satellite data. The report stresses that oblique imagery improve the interpretation and allows recognizing level 2-5 of the EMS scale, although no real validation with ground information is produced. Satellite data does not go beyond level 4 and 5, and
slightly overestimates damages. B. Post-event radar data The launch of a new generation of radar satellites (such as TerraSAR-X and COSMO-SkyMed [28]) capable to provide in a very short time (down to 12 hours in/the case of the SkyMed constellation) VHR SAR data without limitations due to cloud cover or illumination condition started a new era for earthquake damage detection using VHR SAR. The advantage of very high resolution comes however with the drawback that each image covers a small portion of the earth surface, and may be acquired using different viewing angles, which is an important difference for radar images, because it determines huge shadowing and layover effects, especially in urban areas [12]. Moreover, the novelty of these sensors does not allow having a complete pre-event coverage, especially with any of the possible viewing conditions mentioned above, and this calls for analyses based on post-event data only. Examples of very simple approaches approaches developed using post-event VHR SAR are those considering visual interpretation and manual extraction of information about damages, similarly to what reported below for VHR optical data. Examples are [29] and [30]. More sophisticate and semiautomatic approaches are instead those referring to the changes in the 3D structure of a building and available by comparison of its 2D appearance in the radar, slanted and therefore oblique, imagery with what would be expected without any damage. This is obtained in [31] by extracting the 3D parameters of each building from an optical pre-event imagery and simulating its 2D appearance in the SAR scene. When the similarity between the simulated and the actual scene is low, the building is labeled as “damaged”. Another example for the same category is the work reported in [32], where the change in the 2D appearance is used to compute a discretized percentage of damages in a given area. In general, the complexity of SAR data in urban area and the oblique view, possibly with different incidence angles, make the use of post-event VHR SAR data very challenging. The possibility to include more damage levels for individual buildings is apparently very far from being achieved at this moment. More promising are results at the aggregated level, which may be able to exploit the immediate availability of radar data, and could work as preliminary interpretation step for the more accurate post-event VHR optical data. C. Pre- and post-event optical data When pre-event and post-event data are available, optical data can be used to detect changes. To start with, we note that, as stated in [16], there are plenty of methodologies that could be used to extract damage on a pixel-by-pixel basis from optical images, depending on the resolution and the time difference between the images. Moreover, spectral as well as spatial (e.g. textural) features may be considered as input to the selected change detection method. As also mentioned in [11], while final damage detection and evaluation is done at some object level (buildings or blocks), the analysis can be directly obtained at the object level or is first performed at
the pixel level, and the results are jointly considered within a spatially defined area. A first example is [33], where semivariograms are applied to SPT HRVIR data of the 1999 Izmit (Turkey) earthquake. Due to the coarse resolution of the optical data and the neighborhood required to compute semivariograms, results are limited to detect various level of damages in large geographical blocks. The methodology shows the potential of spatial information when individual buildings are not visible as an alternative way to achieve block-based damage assessment via a more standard post-classification comparison. As a matter of fact, when VHR pre- and post-event data are available, damage maps are usually obtained by comparing building shapes and spectral characteristics in the two images. The complexity of the task is in the definition of the spectral and spatial features that need to be compared. A combination of morphological profiles and building radiances is proposed in [34], while edges are proposed in [35]. Results are evaluated in terms of collapse ratio, without distinction for light or heavy damages. A few attempts to improve this methodology and extract more damage levels are however available. In [36] a comparison between the overlapping portions of the shapes of the pre- and post-event detected buildings is implemented. Results are encouraging, since the possibility to discriminate between light and heavy damages was proved within 75% of accuracy. A similar attempt is reported in [37], where four damage grades were obtained with a precision of 78%. Both methodology extract objects, take into account the different positions and possible multiple matches. Finally, a further step in this direction, at the expenses of a more complex probabilistic analysis framework and the exploitation of more spectral and spatial feature is made by [38]. In general, pre- and post-event comparison on optical data is currently the most active research filed for earthquake damage assessment. Automatic and semi-automatic implementation are more and more considered, because of the huge amount of data which may be available for future events, when considering sub-meter data sets. D. Pre- and post-event radar data The availability of both pre- and post-event SAR data is limited to fixed view SAR systems, which is the case for lower resolution sensors, such as those on board of the European ENVISAT satellite. Their resolution, around 10 meters, does not allow individual building damage assessment, but is still quite informative with respect to the damages to the elements within the area on the ground corresponding to a single pixel. Accordingly, there are many papers dealing with the subject of earthquake damage using multitemporal SAR data. They exploit both the intensity and the phase change, which is peculiar to SAR systems, and provide very interesting results. The first researches were prompted by the 1995 Hyogokennanbu earthquake, and reported in [40] and [41]. According to these analyses, it was possible to extract the damage percentage by jointly considering the intensity correlation and the phase coherence between pre- and post-event SAR images. Specifically, [41] introduced a discriminant score, correlated
with the level of damage, that was subsequently changed in order to cope with other events in [42]. It is important to note, in fact, that the changes in intensity and phase due to building damages depend on the structural as well as material characteristics of the original built-up structures. Therefore, due to the different phenomena affecting, for instance, masonry and concrete buildings, and the difference in shapes (e.g. flat as opposite to gable roofs), it is quite difficult to understand a priori which would be the effect of an earthquake without performing the same simulation that were mentioned in the section about post-event VHR SAR data. Moreover, as noted in [43], intensity and coherence are valid measures of change only at the scale used to compute them. As a consequence, in addition to the coarser resolution of the original SAR data, the size of the window used to compute the correlation coefficients also plays a role, and the results may be extremely valuable, but are relevant only at the block level. The same conclusion was independently found in [44] and defines at the moment the fundamental limit of this methodology to assess earthquake damages. IV. RUNNING TWO TESTS In order to investigate the performance of state-of-the-art techniques either routinely used or experimentally proposed to exploit EO data in earthquake damage assessment, in the following a couple of examples are presented. They correspond to a more “standard” methodology, widely applied in operational services, and to a more research-driven approach, aimed at exploiting the potentials of new spaceborne EO sensors. Both tests serve the purpose to showcase the possibilities as well as the limits identified in the previous sections. A. Change detection using VHR optical pre- and post-event HR data In this subsection we report about some results obtained by our research group in connection with a validation exercise performed in 2009 within the RESPOND project funded by the European Space Agency. The test was designed and managed by the Independent Service Validation Group and involved many service providers. The selected test area was the town of Pisco (Peru), where a 7.9 M earthquake occurred on August 16, 2007. Upon request by the Peruvian authorities, the International Charter for Disaster Management [45] was activated, and EO data from multiple sources (optical and radar) was acquired. The main source for validation data for this event was the Peruvian Civil Protection, but additional information were gathered by other groups collecting damage data by in situ surveys within days or weeks after the event. The data from Peruvian Civil Protection features an orthophoto of the town of Pisco, overlaid with 12098 polygons depicting the different buildings in the area of interest. The EO data used for the exercise was a time series of three SPOT-5 images: a pre-event SPOT-5 panchromatic image, 5 meter resolution, acquired on January 20, 2006.
one SPOT-5 panchromatic crisis acquisition at 2.5 meter resolution, acquired on August 21, 2007 one SPOT-5 panchromatic post-crisis acquisition at 2.5 meter resolution, acquired on November 11, 2007. The location of the test site as well as two of the SPOT 5 panchromatic images are shown in fig. IV-A. They cover a large area around the town of Pisco. Due to the validation data available and its quality, the analysis was however focused on a smaller area, including the town of Pisco and its close neighborhood. With respect to these data, it is also worth mentioning that, according to experts from CNES, the Ground spatial sampling of SPOT-5 (3.5 m) allows resolving a minimum object size of nearly 7 m, making it not the most appropriate EO data for EQ damage mapping at the building level. However, there are many examples of earthquake damage maps retrievable from the International Charter web site [45] showing the usefulness of SPOT-5 to provide a global map of affected areas and urban changes and thus to provide a first-approximation assessment map of the damages (both in intensity and location). Recognizing the limits of the available data and the problems in extracting damage levels corresponding to well-defined scales, two different maps were produced: Coarse crisis mapping product: an estimate of the spatial density of damaged buildings based on a grid of non overlapping areas of 500 by 500 m; it provides damage density levels in 4 classes based on the estimated percentage of damaged buildings ( 10%, 10-25%, 25-50%, 50%), given by the number of damaged buildings divided by the total number of buildings. Detailed crisis mapping product: a finer damage scale information (at the same resolution of the provided EO data), with a “minimum option”(map of all buildings classified into damaged and undamaged) and a “better option” (map of all buildings classified into three classes corresponding to class 1&2, class 3&4, and class 5 in the EMS building damage scale). Accordingly, to provide meaningful validation data, the above mentioned 12098 building surveys were re-assembled to provide something compatible with the EO data available. The original damage states are in fact evaluated according to a legend with five classes, labeled as “Large”, “Light”, “Severe”, “No Damage” and “undetermined”. Such a scale is neither consistent with EMS building damage scale nor with the three classes required in the crisis mapping (detailed) product - “better” option. The correlation between the EMS and the Peruvian legend is however very strong, and the following equivalences were assumed: Large EMS level 5, Light EMS level 2, Severe EMS level 3-4, No damage EMS level 1. Correspondingly, the “minimum” option legend corresponds to map classes Large, Light and Severe into the “damaged” class and No damage into the “undamaged” class. Similarly, the “better option” legend corresponds to map class Large into “Destruction” (EMS class 5), class Severe into “Substantial to very heavy damage (EMS classes 3&4)” and classes Light and No damage into “Negligible to moderate damage (EMS
classes 1&2)”. The final ground truth images for the area of the town of Pisco, together with their color legends, are shown in fig. IV-A. The methodology used to extract the final maps is based on a simple change detection analysis based on thresholded greylevel difference [46] of the panchromatic images recorded at the two dates close to the event. Changed versus “unchanged” pixels were then aggregated at the 500 m grid level or to a 10 m grid level (corresponding to the building level) to using the damage levels introduced above to discriminate among damage classes. Of course, the approach is not accurate at the finer level of detail, since it assumes that the percentage of damage correspond to a percentage of the area of each affected building. It may be more reasonable (and actually, it is, according to the results) at the coarser aggregated level. The final results of this procedure are shown in fig. IV-A and visually compared with the validation maps in fig. IV-A. The results show overall accuracy values that are acceptable (65%) to good (more than 80%), but highlight at the same time the limits of the data and of the possibilities of EO data. First of all, it is clear that the good overall accuracy of the coarse damage map is obtained at the expenses of a large overestimate of the damage. This is consistent with the actual damage on the ground (hence the high overall accuracy). Satellite data is excellent for a gross damage extent and to detect heavy damages, but it is much less accurate when details or more precise damage levels are requested. For the same reason, the detailed damage map has a lower accuracy, despite the simplified damage level, and no decent result was obtained for a the more detailed (“better”) option mentioned above. B. Damage assessment using VHR optical and SAR post-event only data As mentioned in Section III, sometimes the quality or the availability of the optimal data for damage assessment at a given scale using EO is limited, if any at all. This has often been the case for pre-event data on the disaster area, highly likely to lack when recent, very high resolution radar spaceborne sensors are concerned. These systems such as TerraSAR-X, and especially COSMO-SkyMed [28] which features a constellation of satellites with coordinated orbits, can be programmed to acquire a large number of images soon after a disaster took place, but a detailed ( 1m GSD) pre-event acquisition is often unavailable. This initially seemed to be the case for EO data referring to the L’Aquila (Italy) earthquake on 6 April, 2009. COSMOSkyMed (C/S) was activated and programmed, in close cooperation between the Italian Civil Protection Department (DPC) and the Italian Space Agency (ASI), to acquire almost immediately a number of images in the stricken area, but at the beginning, in the rush of the emergency response, no preevent data (neither SAR nor optical) was made available to the research groups involved. At a later stage, three VHR Spotlight-2 radar images were found in the C/S archive; this was however a very fortunate case due to the presence, near L’Aquila, of some reference targets used for calibration. In general, coverage of the Earth surface with VHR images still
Fig. 2. The test site of the first EO data analysis proposed in this paper: (a) location of Pisco (Peru); (b) pre-event SPOT-5 panchromatic image, 5 meter resolution, acquired on January 20, 2006; (c) SPOT-5 panchromatic crisis acquisition at 2.5 meter resolution, acquired on August 21, 2007.
Fig. 3. The ground truth obtained on the Pisco test site using ground survey data sets provided by the Peruvian Civil Protection: (a) coarse ground truth on a 500 m grid (yellow = less than 10% damaged building, blue = within 10% and 25%, green = within 25% and 50%, red = more than 50%); (b) detailed ground truth - minimum option (red = damaged, gree = undamaged); (c) detailed ground truth - better option (red = destruction, green = substantial to very heavy damage, yellow = negligible to moderate damage).
remains poor, and the initial unavailability of such data in the case at hand highlighted the limits of a Change Detection approach, which in principle would offer a good ground for discovering less evident damage. This pushed towards searching for a possible technique for evaluating damage from post-event data only. In the framework of the emergency managed by the Italian Civil Protection and the Italian Space Agency, a research work was started offline in parallel to the actions carried out for handling the emergency information, aimed at discovering possible clues
of damage in the post-event data alone. Specifically, an operational hypothesis was made that the disorderly physical shape of damaged buildings result in disorderly patterns of reflectivity distribution in space, as opposed to the classical ”double-bounce”-”layover”-”shadow” pattern for the simplified ”parallelepiped” model of (undamaged) building reported in fig. IV-B, reflecting into basically homogeneous areas as in fig. IV-B. If so, a feasible, quantitative way to measure the ”disorder” of the reflectivity pattern was assumed to be GLCM [47] texture measures, specifically those
Fig. 4. Results of rapid damage mapping for the Pisco test area. Top row shows the coarse damage map result compared with the ground truth in fig. IV-A(a), while the bottom row compares the results obtained with the validation map in fig. IV-A(b).
Fig. 5. The classical ”double-bounce”-”layover”-”shadow” pattern for a SAR acquisition over the simplified ”parallelepiped” model of an (undamaged) building.
connected to the local homogeneity of the image contents; more details will be given later. Speckle effects make single-pixel classification of SAR images unsatisfactory, and better results may be achieved if information is extracted at the level of larger aggregates. For urban areas, a sensible aggregation level may be the urban block, which in addition can be assumed to have a certain degree of inherent homogeneity in terms of both shape and vulnerability. In our experiments, a partition of the urban area of L’Aquila into 58 urban blocks was made by visual inspection, resulting in 58 GIS polygons (see Fig. IV-B). The average block size is 0.1176 (single polygons ranging from 0.0146 to 0.698), covering typically 100 to 150 buildings, at least in the city
centre, less and less outwards. The footprints of severely damaged buildings, i.e. EMS 98 grades 4 and 5, were visually extracted by trained professional at the Italian Air Force School “Scuola di Aerocooperazione” in Guidonia, Italy, from a post-event, 15-cm resolution aerial image acquired by the Italian Air Force in the immediate aftermath of the event. The results of visual interpretation were kindly provided by the DPC. It allows assigning a “Damaged Area Ratio” (DAR) to each block in the GIS layer: (1) where: is the DAR value on
-th urban block (GIS
Fig. 7. Partition of the urban area of L’Aquila into urban blocks. The color of each block is associated to a Ground Truth class (green=ND, yellow=LD, red=HD)
Fig. 6. SAR reflectivity map corresponding to the ”double-bounce””layover”-”shadow” pattern.
polygon) is the ”damage flag” (valued 0 or 1) indicating whether building in polygon was damaged by the earthquake is the footprint area of the -th building in -th polygon is the total area of the -th polygon
In the case at hand, DAR values ranged from zero to . . . %, with an average value of 3.99% overall. It is to be noted that block partition may be automated by extracting blocks from the same radar data later used for damage assessment [48] [49]. To test the hypothesis, three post-event Spotlight-2 C/S images were considered. For the purposes of our explanation, we will concentrate on the case of an image acquired by April, 2009 at 04:54:39 with the SAR-3 C/S satellite on an incidence angle of 19.07 degrees. Several co-occurrence texture measures [47] were then extracted at different window sizes from the geocoded SAR image. Co-occurrence texture parameters were extracted from the cited image using different windows sizes and different shift values, and were averaged over every one of the 58 blocks. A sensitivity analysis of GLCM spatial features to the damage was carried out, by computing the correlation values between DAR and each computed texture. Many of the texture measures were, not surprisingly, found to be too weakly correlated to the damage level to be useful as damage proxies; two exceptions were found to be ”homogeneity” and ”entropy”, with absolute values of correlations reaching above 0.4. The GLCM window size appeared not to critically influence the correlation value. Either average homogeneity or average entropy can be used
as rough damage proxies. In order to filter out some of the noise (i.e. texture variations uncorrelated with damage variations), a reasonable partition of the damage level was made into three classes: ND-non-damaged or slightly damaged; LDlow level of damage; HD-high level of damage based on DAR value and two thresholds (ND-to-LD; LD-to-HD). Classification experiments [51] highlighted that most classification errors concern ND blocks classified as damaged, suggesting that most of the proxy variability happens in the ND value range. This can be seen as a limited capacity of this radar-based method to discriminate between damaged and non-damaged blocks, while it is still sufficiently good at discriminating between different levels of damage. It can thus be expected that, if an independent source of information is available to determine whether a block is damaged or not (i.e. non-ND or ND), the radar can then do a better job of telling how much a damaged block is damaged (i.e. LD vs. HD). This idea was first launched and tested in [51], where the independent source of information was a post-event VHR multispectral image to which a classification method outlined in [52] was applied to sort out rubble pixels. While the extent of rubble pixels did underestimate greatly the real damage extent, using only the information on the presence/absence of a significant amount of rubble in a given block effectively helps improving the final 3-class accuracy. This method was implemented as a ”Service” in EU FP7 project ”SAFER”, a GMES Fast Track project; once tested and validated it was included into the official SAFER Service Portfolio V2 for implementation as an Emergency Service. Pre-event optical data can also be of help. A possible exploitation was proposed in [50], where preliminary results were published on the possible correlations between characteristics of urban blocks and damage estimation errors in the case of Port-au-Prince after the 2010 Haiti Earthquake. An estimator of DAR based on GLCM texture values was built and blocks with the greatest mismatch between predicted and actual DAR were investigated for recurring characteristics. A principle fusion scheme was proposed in [53] to post-correct estimated damage levels based on the expected estimation error.
earthquake damages considering one single EO sensor. Even VHR optical data from an aerial platform, when available, do not provide the whole range of information which is required for a complete damage characterization. There is therefore a strong need for a data fusion approach, which would allow to compare and merge the information obtained by multiple sensors, in situ measurements and partially ground survey. The wide area and compete coverage of EO data can be an advantage when jointly considered with much sparser and incomplete in situ surveys, that could be useful to calibrate the real meaning of what a remote sensor captures by means of ground truth in selected test samples. Moreover, the inclusion of a priori information (such as vulnerability models [54] for buildings and soil geophysical properties for microzonation effects [56]) define a way to gather enough information to exploit and interpret EO data and what they can provide to the final user. This concept, graphically represented in fig. V-A has been in principle applied in terms of post-correction assumedly based on significantly off-average vulnerability of specific urban blocks in [53]. Here, the presence of given geometric features in the pre-event image are assumed to be indicators of significantly different structural characteristics and thus significantly different building vulnerability. This issue is being investigated within our group with still unpublished results on L’Aquila, 2009 and Haiti, 2010 test cases. applied to . . . in . . . B. Single-scale versus multi-scale approaches
According to the survey proposed in Sections II and III and the test results in Section IV, there is a number of open issues that still require some efforts to be solved. Some of them are basic questions related to the validity of the EO approach to earthquake damage assessment (either spatially or thematically speaking), while other ones are scientific questions about the scale used for evaluate these damages and the methodologies used for the validation in itself. Finally, some are related to the social and economic elements of the damages and to data policy problems. This Section tries and analyzes the most relevant ones, offering suggestions for future research lines.
Regarding geographical scale issues, it is worth noting that most of the methodologies available in technical literature are relevant to a single geographical scale, i. e. they have been developed for a specific data set with a given spatial resolution, and with the aim of a specific final product/map. For instance, methods applied to VHR optical data are always looking for building level damage assessment, and no other geographical scale is usually considered. Multi-scale approaches, extracting different features at different scales and fully exploiting the information available in the data for multiple products are less frequent. The same is true for the use of data sets with different spatial resolutions to achieve a single-scale product (e. g. HR and VHR data for building damage assessment). In a way, the possibility to use multi-scale approaches in usually discarded in favor of using the finest and/or less noisy data source available. The possibility to improve the results of this fine data set by means of other data sets or processing steps at a coarser resolution (like the urban extent extraction in the Pisco test case) is rare in operational applications. This is an interesting research line, not only because it enables the extraction of multiple products, whose usefulness may be different in different situations/events. It also allows the design of algorithms working seamlessly on EO data at different spatial resolution, and a better integration of information coming from other sources.
A. Data fusion and in situ measurements
C. A new EO-based damage scale?
One of the most clear outcomes of this analysis is the ineffectiveness in trying to extract meaningful information about
A third point highlighted by the survey in Section III and the tests in Section IV is the need to define clearly a damage
V. O PEN ISSUES
Fig. 8.
A graphical representation of . . . .
assessment scale referring to EO data, As a matter of fact, even agreeing that remote sensing is not able to capture the whole range of damages that are requested for death tolls and economic losses estimation, to many practitioners it is still unclear what remote sensing is able to provide. Although some attempts are available [57], it has been clearly described in [11] that, even in a well-studied event like the Bam earthquake in December 2004, several studies have been done and each of them defines its own “damage” scale, from damage intensity of a single pixel, to identification of collapsed buildings, to number or percentage of collapsed building in a given region. As a matter of fact, damage assessment depends on scale, as clearly described in this work. However, at the finest level (either pixel or building), an accurate damage level scale, developed by scientists in EO in cooperation with earthquake scientists and engineers, commonly agreed and used, as well a possibly connected to other scales (e.g. the EMS one), is still lacking and yet widely needed. Like all the “standardization” processes, the definition of such a damage scale won’t be easy, but it could certainly build over the experience of more than ten years of use of EO data for the tasks and could certainly involve all of the major players and service providers in this arena. As a first step in this direction, Table V-C proposes a first attempt, based on VHR nadir-looking optical data at sub-meter spatial resolution, and considering the experience of the authors. The damage levels in this EO-based scale are five as in the EMS scale, but they are quite different. Moreover, they do not include the “undamaged” class, defined a complementary to the union of those in the table. D. The need for a continuous validation framework An additional open issue with respect to earthquake damage assessment is the continuous improvement of the techniques developed and their adaptation to new sensors, new fusion approaches, new situations and (hopefully) new damage level scales. This calls for the definition of a validation framework that would allow understanding which are the real improvements and how much they are, providing a useful feedback
to researchers, practitioners and service providers on where to put their efforts and where more efforts are required. In recent technical literature, different methods have emerged as possible ways to get reference data for earthquake damage maps. There is however no clear consensus on the very sensitive issue about how validation should be carried out and which are the characteristics to be validated. The RESPOND project, funded by the European Space Agency, made one of the few attempts to define a validation framework, but there is still a long way to go. The only statement which is generally accepted is that in all cases the accuracy of the reference source must be higher than the level which is expected by the product to be validated. Moreover, validation is a learning process, and validation exercises should be held regularly to assess the validity of the products by service providers. They will also serve to improve the validation skills of the evaluators, and next exercises. Indeed, the methodology for realizing a validation exercise is not defined once for all. As a way to make this learning process more efficient, a good solution would be a joint design of the validation exercise between the evaluators and the service providers. Only by gaining proper knowledge of the details of operational EO data analysis it is possible to design effective ways to check damage extraction results.
E. Social vulnerability, economic and population losses As mentioned in the introduction, EO data is not immediately useful to assess non-physical damages, such as population and economic losses. These data are however extremely useful for completing databases and extract input parameters that are instrumental to the estimate of those losses. There are examples of very interesting works related to these issues. Specifically, [58] describes a way to include EO data into the computation of a social vulnerability index, while the GED4GEM project [59] is working to include EO, census and housing survey data into a global exposure database, useful for estimate losses.
TABLE I D AMAGE LEVELS THAT MAY BE RECOGNIZABLE USING EO DATA Class name destroyed collapsed damaged roof lightly damaged roof light damage
short description the building is totally destroyed and only debris are visible the building is collapsed, but the roof is totally or mostly untouched (“pancake” effect) (most of) the walls are standing, but (most of) the roof is damaged the walls are standing, and a minor part of the roof is damaged no visual change in the building roof, but debris are close to the walls
VI. C ONCLUSIONS This paper aims at describing the current status of earthquake damage assessment in urban areas using EO data. Summarizing from the previous Sections, it may be concluded that: the experiences in the past years show that the task is extremely complex, and still far from being achieved at this moment; many techniques have been designed and tested, operational use of EO data for earthquake damage assessment, although not completely validated,is already in place; Apart from improving and validating existing approaches and develop new ones, to cope with data coming from next generations of airborne and spaceborne remote sensors, the last part of this paper has also highlighted a few open issues, where the research challenge is still open. In addition to them it is likely that the interest in EO data for natural hazard management will increase, with the wider availability of data sets, the greater recognition of the need for global monitoring and the increasing request of fast and efficient response to natural disasters.
visual example
[4] International Charter: activation for the New Zealand, Feb. 2011 earthquake. [Online]. Available: http://www.disasterscharter.org/web/charter/ activation_details?p_r_p_1415474252_assetId= ACT-357
[5] W. Zhang, J. Lin, J. Peng, Q. Lu “Estimating Wenchuan Earthquake induced landslides based on remote sensing”, Int. J. Remote Sens., Vol. 31, no. 13, pp. 3495-3508, 2010 [6] M. Xu, C. Cao, H. Zhang, J. Guo, K. Nakane, Q. He, J. Guo, C. Chang, Y. Bao, M. Gao, X. Li, “Change detection of an earthquake-induced barrier lake based on remote sensing image classification,”Int. J. Remote Sens., Vol. 31, no. 13, pp. 3521-3534, 2010. [7] B. Allenbach, R. Andreoli, S. Battiston, C. Bestault, S. Clandillon, K. Fellah, J.B. Henry, C. Mayer, H. Scius, N. Tholey, H. Yesou, and P. de Fraiport: “Rapid EO disaster mapping service: added value, feedback and perspectives after 4 years of Charter actions”, Proc. of IGARSS’05, Seoul, Korea, July 2005, pp. ???-???. [8] G. Trianni, P. Gamba, “Damage detection from SAR imagery: application to the 2003 Algeria and 2007 Peru earthquake,” International Journal of Navigation and Observation, Vol. 2008 (2008), Article ID 762378, 8 pages, doi:10.1155/2008/762378. [9] H. Mitomi, F. Yamazaki, and M. Matsuoka, ”Automated detection of building damage due to recent earthquakes using aerial television images”, Proc. of Asian Conference on Remote Sens., Taiwan, pp. 401406, 2000. [10] European Macroseismic Scale 1998, G. Guenthal, Ed., Cahiers du Centre European de Geodynamique et de Seismologie, Vol. 15, Luxembourg, 1998. [11] E.M. Rathje, B.J. Adams, “The role of remote sensing in earthquake science and engineering: opportunities and challenges,” Earthquake Spectra, vol. 24, no. 2, pp. 471-492, 2008. [12] U. Stilla, U. Soergel, U. Thoennessen, “Potential and limits of InSAR VII. ACKNOWLEDGMENTS data for building reconstruction in built up-areas,” ISPRS J. PhoThe authors wish to thank the PhD students and posttogramm. Remote Sens., vol. 58, pp. 113-123. doc researchers who collaborated with them on this subject [13] R. Spence, K. Sato, “Port au Prince earthquake damage assessment using Pictometry”, Cambridge Architectural Research Ltd, June 2010 for many years (Giovanna Trianni, Gianni Lisini and Diego . [Online] Available: Polli), as well as many colleagues around the globe for useful http://www.eqclearinghouse.org/20100112-haiti/ discussions about the topic of this paper during many meetings wp-content/uploads/2010/02/PaP_damage-assessmentusing-Pictometry.pdf and conferences (Fumio Yamazaki, Norman Kerle, Salvatore [14] . .. Stramondo, Ellen Rathje, Michal Shimoni, Michele Crosetto). [15] F. Yamazaki, “Applications of remote sensing and GIS for damage Specifically, they wish to thank the European Space Agency assessment,” Proceedings of the 8 International Conference on Strucfor funding the above mentioned earthquake damage assesstural Safety and Reliability, unformatted CD-ROM, 12p, 2001. ment validation exercise and the Peruvian Civil Protection [16] V. F. Tian, J. F. Zhang, “Techniques for seismic damages assessment by using remotely sensed images,” Proc. of IGARSS’04, Anchorage, AK, (Miguel Estrada) for the ground survey used to validate the Sept. 20-24, 2004, pp. 1422-1425. EO-based damage assessment results for the Pisco test site. [17] S. Voigt, T. Kemper, T. Riedlinger, R. Kiefl, K. Scholte, H. Mehl, “Satellite Image Analysis for Disaster and Crisis-Management Support,” IEEE Trans on Geosci. Remote Sensing, vol. 45, no. 6, pp. 1520-1528, R EFERENCES June 2007. [18] A. Wiesmann, U. Wegmuller, Y. Haeberlin, A. Retiere, O. Senegas, [1] MCEER Information Service. [Online]. Available: T. Strozzi, and C. Werner, “SAR based products for the implementation http://mceer.buffalo.edu/infoservice/default.asp of humanitarian aid and development assistance projects within the [2] International Charter: activation for the China, May 2008 earthquake. UNOSAT project,” in Proc. IGARSS’04, Anchorage, AK, Sept. 20-24, [Online]. Available: 2004, pp. 4803-4806. http://www.disasterscharter.org/web/charter/ [19] B. Allenbach, R. Andreoli, S. Battiston, C. Bestault, S. landillon, activation_details?p_r_p_1415474252_assetId= K. Fellah, J.-B. Henry, C. Meyer, H. Scius, N. Tholey, H. Yesou and P. de ACT-204 Fraiport, ”Rapid EO disaster mapping service: Added value, feedback [3] JRC: maps for the Pakistan, Oct. 2005 earthquake [Online]. Available: and perspectives after 4 years of Charter actions”, Proc. IGARSS’05, http://global-atlas.jrc.it/maps/PUBLIC/DLR_map_ Seoul, Korea, July 2005, pp. 4373-4378. pakistan-muzzaffarabad02_damage_1-7500_ [20] Y. Kosugi, M. Sakamoto, M. Fukunishi, W. Lu, T. Doihara, and medium.jpg S. Kakumoto, “Urban change detection related to earthquakes using an
[21] [22] [23]
[24] [25] [26] [27] [28]
[29]
[30]
[31] [32]
[33] [34] [35]
[36]
[37] [38] [39] [40] [41] [42] [43]
adaptive nonlinear mapping of high-resolution images,” IEEE Geosci. Remote Sens. Letters, vol. 1, no. 3, pp. 152-156, 2004. M. Manfredi, M. Aldrighi, and F. Dell’Acqua, “Eigenmethod for feature matching of pre- and post-event images exploiting adjacency,” IEEE Trans. Geosci. Remote Sens., vol. 48, no. 7, pp. 2890-2898, 2010. F. Yamazaki, K. Kouchi, M. Kohiyama, N. Mueaoka, M. Matsuoka, ”Earthquake damage detection using high-resolution satellite images”, ... , K.V. Kumar, T.R. Martha, and P.S. Roy, ”Mapping damage in the 7.3 earthquake Jammu and Kashmir caused by 8 October 2005 M from the Cartosat-1 and Resourcesat-1 imagery,” Int. J. Remote Sens., vol. 27, no. 20, pp. 4449-4459, 2006. , D. Kaya, P.J Curran, G. Llewellyn, ”Post-earthquake building collapse: a comparison of government statistics and estimates derived from SPOT HRVIR data,” Int. J. Remote Sens., vol. 26, no. 13, pp. 2731-2740, 2005. E.M. Rathje, M. Crawford, K. Woo, and A. Neuenschwander, “Damage patterns from satellite images from the 2003 Bam, Iran earthquake,” Earthquake Spectra, vol. . . . M. Turker, and E. Sumer, “Building-based damage detection due to earthquake using the watershed segmentation of the post-event aerial images,” Int. J. Remote Sens., vol. 29, no. 11, pp. 3073-3089, 2008. N. Kerle, and R. Stekelenburg, “Advanced structural disaster damage assessment based on aerial oblique imagery and integrated auxiliary data sources”, . . . F. Covello, F. Battazza, A. Coletta, E. Lopinto, L. Pietranera, G. Valentini, and S. Zoffoli, “COSMO-SkyMed mission status,” Proc. of SPIE Conf. Image Signal Process. Remote Sens. XIV, Cardiff, UK, Sept. 2008, vol. 7109. D. Ehrlich, H.D. Guo, K. Molch, J.W. Ma, and M. Pesaresi, “Identifying damage caused by the 2008 Wenchuan earthquake from VHR remote sensing data,” International Journal of Digital Earth, vol. 2, no. 4, pp. 309-326, 2009. Y. Shao, H. Gong, S. Wang, F. Zhang, and W. Tian, “Multi-source SAR Remote Sensing Data for Emergency Monitoring to Wenchuan Earthquake Damage Assessment”, Proc. of 2009 Joint Urban Remote Sensing Event, Shanghai, China, May 2009, unformatted CD-ROM. D. Brunner, G. Lemoine, and L. Bruzzone, “Earthquake damage assessment of buildings using VHR optical and SAR imagery,” IEEE Trans. Geosci. Remote Sens., vol. 48, no. 5, pp. 2403-2420, 2010. F. Dell’Acqua, P. Gamba, D.A. Polli, “Earthquake damage assessment from post-event VHR radar data: From Sichuan, 2008 to Haiti, 2010,” Proc. of 2011 Joint Urban Event (JURSE 2011), Munich, April 2011, pp. 201-204, 2011. E. Sertel, S. Kaya, and P.J. Curran, “Use of semivariograms to identify earthquake damage in an urban area,” IEEE Trans. Geosci. Remote Sens., vol. 45, no. 6, pp. 1590-1594, 2007. M. Chini, N. Pierdicca, and W.J. Emery, “Exploiting SAR and VHR optical images to quantify damage caused by the 203 Bam earthquake,”, IEEE Trans. Geosci. Remote Sens., vol. 47, no. 1, pp. 145-152, 2009. M. Matsuoka, T.T. Vu, and F. Yamazaki, “Automated damage detection and visualization of the 2003 Bam, Iran, earthquake using highresolution satellite images,” Proc. of 25th Asian Conf. Remote Sens., 2004, pp. 841-845. F. Dell’Acqua, M. Stasolla, P. Gamba, E.M. Raijte, “Matching Spectral with Spatial analysis to improve building damage recognition in VHR images,” Proc. of 4th International Workshop on Remote Sensing for disaster Management, Cambridge, UK, 25-27 Sept. 2006, CD-ROM. A.-L. Chesnel, R. Binet, and L. Wald, “Object oriented assessment of damage due to natural disaster using very high resolution images,”, . . . Z. Chen, and T.C. Hutchinson, “Probabilistic urban structural damage classification using bitemporal satellite images,”, Earthquake Spectra, vol. 26, no. 1, pp. 87-109, 2010. ... C. Yonezawa, and S. Takeuchi, “Decorrelation of SAR data by urban damages caused by the 1995 Hyogoken-nanbu earthquake,”, Int. J. Remote Sens., vol. 22, no. 8, pp. 1585-1600, 2001. M. Matsuoka, and F. Yamazaki, “Use of satellite SAR intensity imagery for detecting building areas damaged due to earthquakes,” Earthquake Spectra, vol. 20, no. 3, pp. 975-994, 2004. M. Matsuoka, and F. Yamazaki, “Building damage mapping of the 2003 Bam, Iran, earthquake using Envisat/ASAR intensity imagery,” Earthquake Spectra, vol. 21, no. 81, pp. 8285-8294, 2005. P. Gamba. F. Dell’Acqua, G. Trianni, “Rapid damage detection in Bam area using multi-temporal SAR and exploiting ancillary data,” IEEE Trans. Geosci. Remote Sens., Vol. 45, no. 6, pp. 1582-1589, 2007.
[44] G.A. Arciniegas, W. Bijker, N. Kerle, and V.a. Tolpekin, “Coherenceand amplitude-based analysis of seismogenic damage in Bam, Iran, using Envisat ASAR data,” IEEE Trans. Geosci. Remote Sens., vol. 45, no. 6, pp. 1571-1581, 2006. [45] International Charter, Space and Major Disasters. [Online]. Available: http://www.disasterscharter.org [46] A. Singh, “Digital change detection techniques using remotely-sensed data,” Int. J. Remote Sens., vol. 10, no. 6, pp. 989-1003, 1989. [47] R.M. Haralick, K. Shanmugan, and I.H. Dinstein, “Textural features for image classification,” IEEE Trans. on Systems, Man, and Cybernetics, vol. SMC-3, no. 6, pp. 610-621, 1973. [48] F. Dell’Acqua, P. Gamba, L. Odasso, and G. Lisini, “Segment-based urban block outlining in high-resolution SAR images,” Proc. of 2009 Urban Remote Sensing Event, Shanghai, China, May 2009, unfirmatted CD-ROM. [49] F. Dell’Acqua, G. Vercesi, and D.A. Polli, “Urban block outlining in High-Resolution SAR images based on detection of linear features,” in Proc. of the 2011 EARSeL Symposium, Prague, Czech Republic, 30 May1 June 2011, . . . . [50] F. Dell’Acqua, D.A. Polli, “Post-event Only VHR Radar Satellite Data for Authomated Damage Assessment: A Study on COSMO/SkyMed and the 2010 Haiti Earthquake.” Photogrammetric Engineering and Remote Sensing, Special Issue on Haiti earthquake, in press. [51] F. DellAcqua, C. Bignami, M. Chini, G. Lisini, D.A. Polli, and S. Stramondo, “Earthquake damages rapid mapping by satellite remote sensing data: LAquila April 6th, 2009 event,” IEEE Journal of Selected Topics in Applied Earth Observations and Remote Sensing, in press. [52] . . . [53] F. Dell’Acqua, and D.A. Polli: “Post-event Spaceborne VHR Radar for Seismic Damage Assessment: Integrating Pre-event Optical Data?”. Proc. of ESA JRC EUSC 2011 - Image Information Mining: Geospatial Intelligence from Earth Observation, Ispra (Varese), Italy, 30th-31st March 2011, unformatted CD-ROM. [54] D. Polli, F. Dell’Acqua, P. Gamba, “First steps towards a framework for Earth Observation (EO)-based seismic vulnerability evaluation,” Environmental Semeiotics, vol. 2, no. 1, pp. 16-20, 2009. [55] . . . [56] M. Shafique, M. van der Meijde, N. Kerle, and F.D. van der Meer, F.D, “Impact of DEM source and resolution on topographic seismic amplification”, Int. Journal of Applied Earth Observation and Geoinformation, vol. 13 , no. 3, pp. 420-427, 2011. [57] D. Erlich, A. Gerhardinger, C. MacDonald, M. Pesaresi, I. Caravaggi and C. Louvrier, “Standardized damage assessment and reporting - a methodology that combines field data and satellite data analysis for improved damage reporting,” EUR Rep. 22223 EN, European Community, 2006. [58] A. Ebert, N. Kerle, and A. Stein, “Urban social vulnerability assessment with physical proxies and spatial metrics derived from air- and spaceborne imagery and GIS data,” Nat. Hazards, vol. 48, pp. 275-294, 2009. [59] Globale Exposure Database for the Global Earthquake Model (GED4GEM) [Online]. Avaliable at http://www.globalquakemodel.org