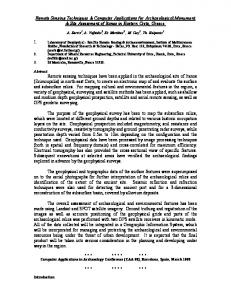
Iraqi Bulletin of Geology and Mining
Vol.5, No.1, 2009
p 47 62
REMOTE SENSING TECHNIQUES AND GIS APPLICATIONS IN DETECTIG GEOHAZARDS IN THE JAZIRA AREA, WEST IRAQ Varoujan K. Sissakian* and Mawahib F. Abdul Jabbar** Received: 20/ 8/ 2008, Accepted: 30/ 11/ 2008
ABSTRACT Remote sensing techniques and GIS applications, with other available different geological data are essential tools in detecting different types of geohazards. Landsat 7ETM+, aerial photographs, topographic, geologic and geophysical maps of different scales were used to detect geohazard areas caused by karstification in Jazira vicinity, western part of Iraq. Different combinations of many bands like 7, 4, 2 and 5, 4, 2 and GIS extensions are used to achieve the best results, in this study. The Jazira vicinity, West Iraq, is characterized by a dense karstification, due to exposure of gypsum beds within the Fat'ha Formation (Middle Miocene). Different forms of karst (sinkholes and dolines) with different shapes and sizes are developed, some of them form salt marshes and the largest one is called Ashqar Salt Marsh. Two main lineaments of NE – SW trend and length of more than 100 Km, with escarpments of heights (8 – 15) m are developed. Collapses in different phases, changing the trend of a main branch of wadi Tharthar and controlling the trend of many valleys are characteristic features within the study area in which a big site is located. Three main phases of karstification are indicated, the latest phase is still active, which may cause many problems to any existing structure or those, which will be build in future. Many potential areas for active karstification and abandoned valleys are detected too.
تطبيقات تقنيات التحسس النائي ونظم المعلومات الجغرافية في اكتشاف المخاطر الجيولوجية غرب العراق،في منطقة الجزيرة فاروجان خاجيك سيساكيان و مواهب فاضل عبد الجبار المستخلص إضافة إلى المعطٌات الجٌولوجٌة األخرى من األسالٌب،تعتبر تقنٌات التحسس النائً ونظم المعلومات الجغرافٌة 7ETM+ استخدمت المرئٌات الفضائٌة من نوع الندسات.األساسٌة فً اكتشاف المخاطر الجٌولوجٌة وبأنواعها المختلفة والصور الجوٌة والخرائط الطبوغرافٌة والجٌولوجٌة والجٌوفٌزٌائٌة وبمقاٌٌس مختلفة الكتشاف المناطق المتأثرة واستخدمت مجامٌع مختلفة من الحزم الطٌفٌة. غرب العراق،بالمخاطر الجٌولوجٌة بسبب التخسفات فً منطقة الجزٌرة . باإلضافة إلى تقنٌات نظم المعلومات الجغرافٌة النجاز هذه الدراسة2 و7 و5 وكذلك2 و7 و4 مثل تتصف منطقة الجزٌرة بكونها من المناطق ذات التخسف الكثٌف بسبب تكشف الصخور الجبسٌة العائدة لتكوٌن توجد أنواع عدٌدة وبإشكال وأحجام مختلفة من ظاهرة التخسف ومنها البالوعات االذابٌة.)الفتحة (الماٌوسٌن األوسط – توجد استطالتٌن رئٌسٌتٌن باتجاه شمال شرق. وإن األخٌرة تشكل ممالح عدٌدة وأكبرها هً مملحة األشقر،والدوالٌن تتصف.) متر05 – 8( وقد تكونت جروف صخرٌة على امتدادهما وبارتفاع، كم011 جنوب غرب وبطول أكثر من إضافة إلى تحوٌل مجرى احد الفروع الرئٌسٌة لوادي الثرثار،منطقة الدراسة بوجود أطوار مختلفة من التخسف لوحظت ثالثة أطوار من التخسف وان الطور األخٌر من التخسف الزال نشطا.والسٌطرة على مجاري الودٌان األخرى وتم اكتشاف مجرى لوادي مهجور إضافة إلى.وسٌؤثر على المبانً التً ستقام فً الموقع الموجود فً منطقة الدراسة .مناطق عدٌدة تعتبر مناطق تخسف كامنة ____________________________________ * Expert, State Company of Geological Survey and Mining, P.O. Box 986, Baghdad, Iraq e-mail:
[email protected] ** Senior Geologist, State Company of Geological Survey and Mining, Baghdad, Iraq
74
Remote Sensing Techniques and GIS Applications,
Varoujan K. Sissakian and
Mawahib F. Abdul Jabbar
INTRODUCTION The studied area is located, physiographically, within the Jazira Province, west of Iraq. It is about 320 Km NW of Baghdad and 60 Km west of Hatra (Fig.1). The Jazira Province is characterized by dense karstification, which is developed in different forms (Hamza, 1997; Sissakian and Ibrahim, 2003 and Sissakian and Al-Musawi, 2007). Some of the large karst forms are developed to salt marshes (sabkhas), the largest one in the studied area is called Ashqar Salt Marsh , which is about 25 Km2 (Fig.2). The aim of this study is to detect karstified areas and their phases using remote sensing techniques and GIS applications, beside all other types of available data. Moreover, to detect potential areas for karstification, to indicate the location and trends of abandoned valleys and to clarify the status of a site that is located within the studied area (Fig.2).
Fig.1: Location of the studied area
78
Vol.5, No.1, 2009
p 47 62
Fig.2: Google Earth image of the studied area and near vicinity
Iraqi Bulletin of Geology and Mining
74
Remote Sensing Techniques and GIS Applications,
Varoujan K. Sissakian and
Mawahib F. Abdul Jabbar
To achieve the aim of this study, the following available data in the archive of the State Company of Geological Survey and Mining are used: ─ Topographical maps, scale 1:250 000, 1: 100 000 and 1: 250 000 ─ Geological reports and maps, scale 1: 250 000, 1: 100 000 and 1: 25 000 ─ Geophysical report and map, scale 1: 250 000 ─ Aerial photographs, scale 1: 42 000, photographed in 1952 – 1956 ─ Google Earth on line, 2007 ─ Landsat images, September 2002 GEOLOGICAL SETTING The studied area is built up by the Fat'ha Formation (Middle Miocene). The Fat'ha Formation consists of alternation of green marl, limestone and gypsum in cyclic nature, with sandstone beds in the uppermost part (Ma'ala, 1976). Due to thick gypsum beds (1.5 – 10 m), which has high dissolving ability, different types and forms of karst are developed, like sinkholes, natural bridges that are interconnected by subsurface valleys. The exposed thickness of the Fat'ha Formation, in the studied area is 63 m (Ma'ala, 1976). Whereas, in Khlesia oil well, which is about 60 Km SW of the studied area, it is 515 m (Gaddo and Parker, 1958 in Ma'ala, 1976). From structural and tectonic points of view, the studied area is located within the Stable Shelf, represented by Salman – Hadhar Zone (Al-Kadhimi et al., 1996). The studied area, however, is considered to be within the Unstable Shelf (Fouad, 2009), it is characterized by flat nature, due to almost horizontal beds, with regional dip towards the east. Some subsurface folds, however, exist within the involved zone, like Tayarat anticline and Khlesia Uplift (southwest of the studied area), which have NE – SW trend, without clear surface expression. Two main lineaments with trend of NE – SW are the main outstanding features in the studied area. They are about 100 Km in length, extending northeastwards off the studied area for about 60 Km, crossing the Tigris river and are only 8 Km apart from each other (Fig.2). The area limited by the two lineaments is densely karstified; among the karst features is a large doline called the Ashqar sabkha (Salt Marsh), with many other karst features. Along these lineaments, many folds eastwards of the studied area exhibit plunging and/ or doming (Al-Mubarak and Youkhanna, 1976 and Zuwaid, 1993), besides clear control to the trend of Greater Zab River, by the lineament, east of the studied area (Fig.2). From neotectonic point of view, the studied area is uplifted (since the Late Miocene) with amount of (200 – 250) m. The contour line of + 200 m value exhibits clear bulging with the same trend of the aforementioned two lineaments. The estimated rate of regional uplift is about (0.1 – 0.2) cm/ 100 years (Sissakain and Deikran, 1998). The area limited by the two lineaments, however is subsided, as indicated from the topographical maps with clear southeastern rim, which is (8 – 15) m in height (Fig.3). The residual gravity anomalies map, scale 1: 250 000 (Al-Kadhimi et al., 1974) shows very clear impression for the two lineaments with full coincidence to the surface expression. The recorded negative and positive anomalies range from (–0.4 to –0.8) mg and (0.2 – 0.6) mg, respectively (Fig.4). The negative anomalies are good indication for the subsidence, indicating continuation of the subsidence down to depth of (750 – 1000) m (Jassim Al-Bdaiwy, personal communication, 2008). The seismic attenuation map, scale 1:1000 000 shows also very clear indication for the two lineaments and subside area, in between. The effect of the a subsidence might be down to about 1000 m (Dr. Saffa F. Fouad, personal communication, 2008).
51
Iraqi Bulletin of Geology and Mining
p 47 62
Vol.5, No.1, 2009
J B 9 H C 215 – 220 m 206 m
D 205 - 220 m
SITE I
220 – 230 m E
Ashqar Sabkha 1 1'
204 – 204 m
205 – 213 m
205 – 210 m (a.s.l)
7
4
205 – 210 m 5 6
Fig.3: Google Earth image of the studied area showing karst areas and depths of the karst features
Fig.4: Residual gravity anomaly map of the studied area (after Al-Kadhimi et al., 1974)
50
Remote Sensing Techniques and GIS Applications,
Varoujan K. Sissakian and
Mawahib F. Abdul Jabbar
METHOD OF WORK In order to achieve the aim of this work, topographical and geological maps of scales 1: 250 000, 1: 100 000 and 1: 25 000; aerial photographs, scale 1: 40 000, photographed in 1952 – 1956; geophysical map scale 1: 250 000; Landsat ETM+ and Google Earth on line images were studied and interpreted to detect the shape of the karst features, their sizes, shapes, depths and the general topography of the studied area, especially the height of the escarpments, along the two main lineaments, which bound the main depressions. Moreover, the trend of valleys and their tributaries were followed carefully, in order to recognize any abnormal trend. After thorough interpretation of the aforementioned data the karstification phases, shapes, sizes and their activity, abandoned valleys and abnormal valley trends and potential areas for karstification were detected. However, each type of the used data has different resolution in detecting the main studied aspects. The acquired results of different aspects using different types of data are briefed in Table (1). PREVIOUS WORKS Ma'ala (1976) mapped Al-Jazira area, including the studied area; he mentioned the presence of many depressions and attributed them to karstification. But, he didn't recognize the lineaments and karstification phases. Al-Badry et al. (1986) studied the accumulated salt deposits in the depressions of Al-Jazira vicinity, among them is the Ashqar Sabkha. They drilled a borehole in the marginal part of the sabkha, with a depth of 42 m, only rocks of the Fat'ha Formation were encountered in the borehole. Neither cavity filling materials nor rock salt were reported in the drilled borehole, although they mentioned that rock salt was encountered in many drilled oil wells in the surrounding areas. Sissakian and Ibrahim (2003) recognized three karstification phases from studying of the topographic and geologic maps of different scales, during compilation of the Geological Hazard Map of Qayarah quadrangle, scale 1: 250 000. But, they didn’t recognize the abandoned tributaries and the active phase of the karstification. Al-Daghistani, 2007, prepared a geomorphological map of the Nineveh Governorate, using visual image interpretation, in which he mapped different karst features, in the studied area; he also didn't recognize different karstification phases. GIS and DEM APPLICATIONS Within GIS and Digital Elevation Model (DEM) applications, spatial analysis and hydrological extensions of Arc GIS were used to clarify the subsided areas due to karstification, and to deduce the trend of abandoned valleys and to delineate the potential karst areas. The two used extensions are: Spatial Analysis, a contour map with interval of 10 m is drawn (Fig.5). In reviewing the drawn contour lines, it is very clear that the trend of the main tributary of wadi Al-Thar'thar was along A, B, C, E, F and G. Whereas, now it is along A, B, C and D, then it drains in Ashqar Sabkha (Figs.5 and 6). The remaining part of the valley from F to G is now isolated from the main trend of the tributary between the points E and F, which means the main tributary has abandoned its main trend. Hydrologic extension, the valleys of the studied area were classified into four orders (Fig.7), using GIS hydrologic extension. In reviewing the constructed stream orders map, it is clear that the trend of the main tributary, which is of second and third orders, was along the points A, B, C, E, F and G. This is more evidenced from reviewing the width of the valley between the points F and G (Figs.8 and 9). If the valley was not continuous starting from point A to the point G, then the width of the valley between the points F and G wouldn’t be as it is now.
52
55
Inadequate
+
ـــــ
Seismic attenuation map, scale 1: 1000 000
ـــــ
++
Residual gravity anomalies map, scale 1: 250 000
5, 4, 2
Fairly clear
ـــــ
ـــــ
++/+++ +++
+++ +++
7, 4, 2
+++
+++
Google Earth image
Landsat 7 ETM+
ـــــ
ـــــ
ـــــ
+++ +++
+++
ـــــ
ـــــ
ـــــ
++
1: 25 000
++
ـــــ
ـــــ
ـــــ
1: 100 000
ـــــ
ـــــ
ـــــ
Active karst areas
1: 250 000
Karst Karstification Features phases
Aerial photographs Scale 1 : 40 000
Topographic maps scale
Type of data used
+++
Clear
ـــــ
ـــــ
+++ +++
++
ـــــ
ـــــ
ـــــ
ـــــ
Course of abandoned valleys
++
+
+++ +++
+++
++
+ + ++
ـــــ
ـــــ
+ +
+
+
++
ـــــ
ـــــ
+++ Very clear
Lineaments
Escarpments with heights (5 – 15) m
Table 1: Comparison between different used data and their applicability in interpretation of different aspects, in the studied area
Iraqi Bulletin of Geology and Mining Vol.5, No.1, 2009 p 47 62
Remote Sensing Techniques and GIS Applications, Mawahib F. Abdul Jabbar
Fig.5: Topographic contour map of the studied area, deduced from GIS, topographic extension 57
Varoujan K. Sissakian and
Fig.6: Landsat 7ETM+ Image, showing interpreted lineaments and sabkhas, with karstification phases (1 – 1', 2 – 2' and 3 – 3')
Iraqi Bulletin of Geology and Mining Vol.5, No.1, 2009
55 p 47 62
Remote Sensing Techniques and GIS Applications, Mawahib F. Abdul Jabbar
Fig.7: Map of stream orders in the studied area, deduced from GIS, hydrologic extension 55
Varoujan K. Sissakian and
p 47 62
Vol.5, No.1, 2009
Fig.8: Landsat 7ETM+ image, bands 7, 4, 2
Iraqi Bulletin of Geology and Mining
54
Remote Sensing Techniques and GIS Applications, Mawahib F. Abdul Jabbar
Fig.9: Landsat 7ETM+ image, bands 5, 4, 2 58
Varoujan K. Sissakian and
Iraqi Bulletin of Geology and Mining
Vol.5, No.1, 2009
p 47 62
REMOTE SENSING APPLICATIONS The following data are used in detecting the karstification areas and phases. Moreover, deducing the activity of the karstification and detecting potential areas for karstification that forms a type of geohazards (Sissakian, 2000). Landsat 7 ETM +, different combination of different spectral bands was used to detect karstification areas, phases and their activity and potential areas. Two combinations were found to be the most clear and useful, these are bands 7, 4, 2 (Fig.8) and 5, 4, 2 (Fig.9). In studying the mentioned spectral bands, the following aspects were indicated: ─ Two old karstification phases exist in the studied area (Figs. 8 and 9). These are clearly visual in Ashqar Sabkha and the other two small sabkhas, which are southwest wards. The first phase had caused the karst forms 1, 1', 2, 2', 3 and 3'. The second phase caused the conjunction of the forms 1 with 1', and, 3 with 3'. These two phases are responsible for changing the trend of the valley from A, B, C, E, F and G, to the new trend A, B, C and D. ─ The third phase of karstification, which is still active, is recognized from development of circular and/ or crescentic shapes (points no. 4, 5, 6, 7, 8 and 9; Figs.8 and 9). Its is also recognized from the abnormal shape of another main tributary of wadi Al-Thar'thar between the points H, I and J, which gave almost a circular shape to the valley (Figs.3, 6, 8 and 9). A normal valley wouldn’t form such abnormal shape in its trend. Another indication for the latest active phase is the crescentic form that is developed in the southwestern ends of the two lineaments (Figs.2 and 9). A site that is located in the studied area suffers from dense karstification. A circular form with diameter of about 4 Km (point no.8 in Fig.8) is located in the center of the site; it will cause severe damages to any construction, in the involved area. Careful inspection will indicate many other smaller karst features, within the site. Figure (10) is enlarged part of the Landsat 7 ETM+ bands 5, 4, 2, many circular and crescentic shapes were found, which are indications for the latest phase of karstification that is still active, such forms were found in points K, L, M, N and P. At point O (Figs.10 and 11), the width of the valley is decreased, largely; this could be attributed to karstification too. In reviewing the developed crescentic form just beside the valley, point M in Figs. (10 and 11), it could explain the change in the width of the valley, by assuming that part of the drained water flows off the valley to the developed crescentic form, which is a karst form. But, this must be checked in the field to be confirmed. Points O and P (Fig.10) are just along the western border of the site, they are clear indications for karstification, which will affect on any construction within the site. Figure (11) is a Landsat 7 ETM + band 5 (black and white) it is enlarged image, almost all circular and crescentic karst forms are visible too. The width of the valley between points F and G is clear too, but the trend of the valley between points E and F is not clear and it can't be detected that the valley is abandoned before point F. Google Earth, 2007 images of different scales was used for interpretation and detection of karstification, its phases, and activity and potential areas (Figs.2 and 3). From reviewing of the images, almost the same features are detected as those in Landsat 7 ETM +, but with different interpretation applicability (Table 1). Aerial photographs, photographed in 1952 – 1956 by Hunting Aerosurvey of scale 1: 40 000 were used for interpretation (using Topcon stereoscope) and detecting karstification areas and their activity. Generally, the aforementioned features and forms that detected by using Landsat 7 ETM+ and Google Earth images were detected too, but with different detection applicability and clearness, the details are mentioned in Table (1).
54
Remote Sensing Techniques and GIS Applications, Mawahib F. Abdul Jabbar
Fig.10: Landsat 7ETM+ image, bands 5, 4, 2 (close-up view) 51
Varoujan K. Sissakian and
Iraqi Bulletin of Geology and Mining
Vol.5, No.1, 2009
p 47 62
Fig.11: Landsat 7ETM+ band 5 DISCUSSION The remote sensing techniques and GIS applications, with the back-up of topographical, geological and geophysical maps, are found to be very useful in detecting karstification features, shapes, sizes, phases and their activity. A big site, although abandoned hitherto, is located within the studied area, it is very close to a main active karst area, limited by the points H, I and J (Figs.6, 8 and 9); it also includes one large circular area (No.8 in Figs.8 and 9), which is potential area for karstification. This is very clear in Landsat 7 ETM + and Google Earth images. If any structure is constructed in the involved area, then it will suffer from subsidence due to karstification, causing sever damages to the constructed structure. Moreover, one of the two lineaments bounds the site (Figs.6, 8 and 9) in its northwestern side. The lineament is formed due to subsidence and is still active. This also will cause damages to the facilities of the site, after construction. The main branch (A through G) of wadi Al-Thar'thar is abandoned in its middle part and its flow direction is changed towards the Ashqar Sabkha in point C (Figs.3, 6, 7, 8 and 9). This phenomenon is clear in Landsat image, Google Earth image and aerial photographs. It is also confirmed using GIS applications, Hydrological extension (Fig.7) and Spatial analysis (Fig.5). From the former, the order of the valley is indicated, which is the same (orders 2 and 3) along the two parts of the valley, whereas from the latter the inflection point C (Figs.5 and 7), where the valley is divided into two parts, due to subsidence, is indicated. Moreover, the width of the valley between points F and G (Figs.8, 9, and 11) wouldn’t be as it is now, if the valley was not originally flowing from point A to G, because if the valley was originally flowing from point E to G, then the valley wouldn’t be able to erode rocks and have such width. This is indicated and confirmed from comparing the width of the valley and its length (between points E and G) with other existing valleys in neighboring areas, with the same length and width.
50
Remote Sensing Techniques and GIS Applications,
Varoujan K. Sissakian and
Mawahib F. Abdul Jabbar
Three phases of karstification are clear in all used data, the third phase is still active, it is indicted in the trend of the main branch of wadi Al-Thar'thar, at points H, I and J (Figs.3, 5, 6, 8 and 9). It is also indicated by the presence of different circular forms, like in points no. 4, 5 and 6 (Figs.3 and 8). CONCLUSIONS The followings could be concluded in the studied area. Remote sensing techniques and GIS applications are found very useful in indicating karstification phases and active karst areas. Bands 5, 4 and 2 are found more clearly in indicating karstification phases. Landsat and Google Earth images are clearly used in indicating abandoned valley trends. Band 5 of the Landsat image shows more clearly the karst features. The interpreted lineaments and the associated sabkhas (salt marshes) are clearly visible in residual gravity anomalies map and partly in seismic attenuation map. Some of the karst features are also visible in topographical map, scale 1: 25 000. The existing site suffers from active karstification that will cause severe damages to its facilities, after construction. The studied area is much more karstified than the surrounding areas due to the presence of subsurface weakness zone, indicated by the two lineaments. ACKNOWLEDGMENT The authors would like to express their sincere thanks to Dr. Saffa F. Fouad (Expert, Structural Geologist), Mr. Sabah Y. Yacoub (Expert, Geologist) and Mr. Jassim A. Al-Bdaiwi (Expert, Geophysicist) for their valuable comments and amendment of this paper. REFERENCES Al-Badry, A.S., Ahmad, A.I. and Al-Sabbagh, N.Y., 1986. Geological exploration and reserve estimation of salt marshes in the Jazira area, Mosul Governorate. GEOSURV, int. rep. no. 1554. Al-Daghistani, H.S., 2007. Geomorphological Map of Nineveh Governorate, Northwestern Iraq, Using Visual Image Interpretation. Raf. Jour., Vol.18, No.1, p. 81 – 91. Al-Kadhimi, J.A.M., Fattah, A.S. and Abbas, M.J., 1974. Residual gravity anomalies map, scale 1: 250 000. GEOSURV, manuscript report. Al-Kadhimi, J.A.M. and Sissakian, V.K., Fattah, A. S. and Deikran, D.B., 1996. Tectonic Map of Iraq, 2nd edit., scale 1:1000 000. GEOSURV, Baghdad, Iraq. Al-Mubarak, M.A. and Youkhanna, R.Y., 1976. Report on regional geological mapping of Fatha – Mosul area. GEOSURV, int. rep. no. 753. Ma'ala, K.A., 1976. Report on regional geological mapping of Hadhar area. GEOSURV, int. rep. no. 742. Fouad, S.F., 2009. Tectonic Map of Iraq, scale 1: 1000 000, 3rd edit., GEOSURV, Baghdad, Iraq (in press). Hamza, N.M., 1997. Geomorphological Map of Iraq, scale 1: 1000 000. GEOSURV, Baghdad, Iraq. Sissakian, V.K., 2000. Geological Hazards in Iraq. GEOSURV, int. rep. no. 2555. Sissakian, V.K. and Deikran, D.B., 1998. Neotectonic Map of Iraq, scale 1: 1000 000. GEOSURV, Baghdad, Iraq Sissakian, V.K. and Ibrahim, F.A., 2003. Geological Hazards Map of Qayarah quadrangle, scale 1: 2500 000. GEOSURV, int. rep. no. 2913. Sissakian, V.K. and Ibrahim, F.A., 2005. Geological Hazards Map of Iraq, scale 1: 1000 000. GEOSURV, Baghdad, Iraq. Sissakian, V.K. and Al-Mousawi, H.A., 2007. Karstification and related problems, examples from Iraq. Iraqi Jour. Geol. Min., Vol.3, No.2, p. 1 – 12. Zuwaid, Q.A., 1993. Geology of Qayarah Quadrangle, scale 1:250 000. GEOSURV, Baghdad, Iraq.
52