remote sensing Article
Assessment of Atmospheric Correction Methods for Sentinel-2 MSI Images Applied to Amazon Floodplain Lakes Vitor Souza Martins 1, *, Claudio Clemente Faria Barbosa 1 , Lino Augusto Sander de Carvalho 1 , Daniel Schaffer Ferreira Jorge 1 , Felipe de Lucia Lobo 2 and Evlyn Márcia Leão de Moraes Novo 2 1 2
*
Image Processing Division, Brazilian Institute for Space Research, São José dos Campos 12227-010, Brazil;
[email protected] (C.C.F.B.);
[email protected] (L.A.S.C.);
[email protected] (D.S.F.J.) Remote Sensing Division, Brazilian Institute for Space Research, São José dos Campos 12227-010, Brazil;
[email protected] (F.L.L.);
[email protected] (E.M.L.M.N.) Correspondence:
[email protected] or
[email protected]; Tel.: +55-12-3208-6809
Academic Editors: Yunlin Zhang, Claudia Giardino, Linhai Li, Xiaofeng Li and Prasad S. Thenkabail Received: 16 January 2017; Accepted: 24 March 2017; Published: 29 March 2017
Abstract: Satellite data provide the only viable means for extensive monitoring of remote and large freshwater systems, such as the Amazon floodplain lakes. However, an accurate atmospheric correction is required to retrieve water constituents based on surface water reflectance (RW ). In this paper, we assessed three atmospheric correction methods (Second Simulation of a Satellite Signal in the Solar Spectrum (6SV), ACOLITE and Sen2Cor) applied to an image acquired by the MultiSpectral Instrument (MSI) on-board of the European Space Agency’s Sentinel-2A platform using concurrent in-situ measurements over four Amazon floodplain lakes in Brazil. In addition, we evaluated the correction of forest adjacency effects based on the linear spectral unmixing model, and performed a temporal evaluation of atmospheric constituents from Multi-Angle Implementation of Atmospheric Correction (MAIAC) products. The validation of MAIAC aerosol optical depth (AOD) indicated satisfactory retrievals over the Amazon region, with a correlation coefficient (R) of ~0.7 and 0.85 for Terra and Aqua products, respectively. The seasonal distribution of the cloud cover and AOD revealed a contrast between the first and second half of the year in the study area. Furthermore, simulation of top-of-atmosphere (TOA) reflectance showed a critical contribution of atmospheric effects (>50%) to all spectral bands, especially the deep blue (92%–96%) and blue (84%–92%) bands. The atmospheric correction results of the visible bands illustrate the limitation of the methods over dark lakes (RW < 1%), and better match of the RW shape compared with in-situ measurements over turbid lakes, although the accuracy varied depending on the spectral bands and methods. Particularly above 705 nm, RW was highly affected by Amazon forest adjacency, and the proposed adjacency effect correction minimized the spectral distortions in RW (RMSE < 0.006). Finally, an extensive validation of the methods is required for distinct inland water types and atmospheric conditions. Keywords: Amazon inland water; MAIAC aerosol product; adjacency correction; TOA simulation; MODIS atmospheric product; atmospheric correction
1. Introduction Inland waters are an essential resource for terrestrial life and ecosystem services [1,2]. The Amazon freshwater is an ecosystem bearing one of the highest biodiversities in the world [3]. Amazonian aquatic systems depend on satellite image applications to investigate bio-optical parameters due to the extent and limitations of in-situ measurements [4–7]. Thus, remote sensing images have long been recognized as a potential data source for the continuous modelling and monitoring of the water quality [8]. Remote Sens. 2017, 9, 322; doi:10.3390/rs9040322
www.mdpi.com/journal/remotesensing
Remote Sens. 2017, 9, 322
2 of 23
The new generation of orbital optical sensors, such as Sentinel-2 and Landsat-8, presents a scientific opportunity for inland water research [9]. The Multispectral Imager (MSI) on-board Sentinel-2A delivers images with high spatial (10–30 m), temporal (10 days) and radiometric (12 bits) resolutions [10]. These configurations offer capabilities for the mapping of small and irregular open-water systems, higher sensitivity to bio-optical variables and higher temporal observations enabling the monitoring of changes in the water composition over time. In addition, MSI has been designed with eight spectral bands in the visible and near-infrared (NIR) wavelengths that are feasible for water research of the main optically active components (OACs): chlorophyll-a (Chl-a), total suspended solids (TSS) and coloured dissolved organic matter (CDOM) [11]. In a preliminary assessment of the MSI application, Toming et al. [12] reported reasonable retrievals of Chl-a and CDOM concentrations based on a historical dataset from Estonian lakes. Thus, Sentinel-2 MSI data represent a new perspective for inland and coastal waters [13–15]. Atmospheric correction is a prerequisite to quantify biogeochemical properties based on surface reflectance, once it removes attenuation effects caused by active atmospheric constituents, such as molecular and aerosol scattering and absorption by water vapour, ozone, oxygen and carbon dioxide [16]. In fact, due to the low reflectance, the accurate removal of atmospheric effects is paramount for water surfaces [17]. The surface reflectance quality is highly dependent on the atmospheric correction method, atmospheric-surface characteristics, and sensor design [18]. Several atmospheric correction algorithms are available for multispectral sensors which can be divided in two main categories [19]: (i) image-based approach; and (ii) atmospheric radiative transfer codes (RTCs). In the first category, the atmospheric effects are derived from the image itself and then removed from the TOA signal. For instance, ESA provides a Sentinel toolbox that includes a Sen2Cor processor to generate MSI land products (Level 2A). This processor is a semi-empirical algorithm that integrates image-based retrievals with Look-Up tables (LUTs) from the LibRadtran model to remove atmospheric effects from MSI images [20]. In parallel, Vanhellemont and Ruddick [21] developed an image-based processor, named ACOLITE, for the atmospheric correction of Operational Land Imager (OLI) and MSI images applied to marine and inland water studies. The ACOLITE computes aerosol scattering using Rayleigh-corrected reflectance from NIR bands for clear water and SWIR bands for moderate and turbid water; the water contribution measured in these bands can be negligible [22]. Overall, both ACOLITE and Sen2Cor are image-based approaches available for MSI images and present an advantage in regions without external atmospheric information. In the second category, RTCs compute scattering and absorption of light through the atmosphere to remove them from the signal measured by satellite sensors. The 6S vector version (Second Simulation of a Satellite Signal in the Solar Spectrum) is a well-established RTC that accounts for a wide variety of atmospheric conditions and sensor characteristics [23]. However, the main implication of using RTC is the prior knowledge about atmospheric parameters (e.g., aerosol optical depth (AOD), water vapour and ozone) coinciding with the satellite overpass. In general, this information is available from climatological models [24], sun photometer measurements [25] or satellite atmospheric products [26]. Among the alternatives, recent Moderate Resolution Imaging Spectroradiometer (MODIS) algorithm, named Multi-angle implementation of atmospheric correction (MAIAC), provides a suite of atmospheric products (AOD, cloud mask and water vapour) at fine 1 km resolution [27], which is promising for enhanced quality information in regions with high cloud cover areas such as the Amazon region [28]. In addition to atmospheric correction issues, the contribution of adjacency effects also demands correction [29,30]. In the Amazon context, the presence of dense forest around water bodies contributes to modify the water spectrum measured by orbital sensors. Therefore, remote sensing of the Amazonian water system faces several challenges, such as: (i) dynamic system with optically complex water; (ii) logistical difficulties in collecting water samples and validation data; (iii) seasonal variability of aerosol loading from biomass burning plumes (iv); high cloud cover and cloud cirrus; and (v) forest adjacency effects. In view of these challenges, the critical assessment of atmospheric correction methods applied to new Sentinel 2 MSI image is required, which is still missing for Amazon lakes.
Remote Sens. 2017, 9, 322
3 of 23
atmospheric correction methods applied to new Sentinel 2 MSI image is required, which is still Remote Sens. 9, 322 lakes. 3 of 23 missing for2017, Amazon Therefore, our objective is to present an inter-comparison of three atmospheric correction algorithms (6SV based on MAIAC atmospheric product, ACOLITE and Sen2Cor) applied to new a Therefore, our objective is to present an inter-comparison of three atmospheric correction Sentinel-2 MSI image in the case of Amazon floodplain lakes. Regarding atmospheric correction, we algorithms (6SV based on MAIAC atmospheric product, ACOLITE and Sen2Cor) applied to new conducted a supplementary analysis to understand atmospheric components in the study area, and a Sentinel-2 MSI image in the case of Amazon floodplain lakes. Regarding atmospheric correction, then, simulated the contribution of atmospheric and surface reflectance to MSI TOA bands. Finally, we conducted a supplementary analysis to understand atmospheric components in the study area, we developed an adjacency correction based on the Linear Spectral Unmixing (LSU) model for water and then, simulated the contribution of atmospheric and surface reflectance to MSI TOA bands. Finally, surfaces, due to the strong forest adjacent effects on the water spectrum. All comparisons were we developed an adjacency correction based on the Linear Spectral Unmixing (LSU) model for water conducted over four Amazon floodplain lakes using in-situ radiometric measurements concurrent to surfaces, due to the strong forest adjacent effects on the water spectrum. All comparisons were the MSI image overpass. conducted over four Amazon floodplain lakes using in-situ radiometric measurements concurrent to the MSI image overpass. 2. Materials 2. Materials 2.1. Site Description and Field Data 2.1. Site Description and Field Data Our study area consists of four Amazon floodplain lakes located in the Mamirauá Sustainable Development Reserve (MSDR), closeAmazon to the confluence the Solimões Rivers (~25 km) Our study area consists of four floodplainoflakes located inand theJapurá Mamirauá Sustainable (Figure 1). TheReserve MSDR (MSDR), is a complex floodplain ecosystem remains entirely for km) 3–6 Development close to the confluence of thethat Solimões and Japurá flooded Rivers (~25 months due to MSDR seasonal level variation. The annual average entirely amplitude of the level (Figure 1). The is awater complex floodplain ecosystem that remains flooded forwater 3–6 months reaches ~10.6 m water [31]. In thevariation. MSDR lakes, OACs average concentrations change seasonally driven by due to seasonal level The annual amplitude of the water level reaches exchange flow In (in-the andMSDR out-flowing) with large fluvial systems, as the Japurá Solimões ~10.6 m [31]. lakes, OACs concentrations changesuch seasonally drivenand by exchange rivers [32].and Few studies reported the bio-optical properties region (e.g., Affonso et flow (inout-flowing) with large fluvial systems, suchfor asthis the Amazon Japurá and Solimões rivers [32]. al. since most the efforts concentrated on for multidisciplinary reports about the et ecological Few[33]), studies reported bio-optical properties this Amazon region (e.g., Affonso al. [33]), management, fish concentrated communities on andmultidisciplinary ecosystem disturbance In ecological general, MSDR integrates a since most efforts reports [34,35]. about the management, fish sustainable use natural resources and[34,35]. preservation practices, locala sustainable communities communities andofecosystem disturbance In general, MSDR where integrates useare of committed to rational exploitation, andwhere biodiversity protection in are the committed reserve [36].toThus, the natural resources andresource preservation practices, local communities rational MSDR an and ecological and sustainable for human–environment and resourcerepresents exploitation, biodiversity protection inmodel the reserve [36]. Thus, the MSDRrelations, represents an becomes an attractive region for further studies of bio-optical patterns and natural conservation ecological and sustainable model for human–environment relations, and becomes an attractive region using remote sensing data. for further studies of bio-optical patterns and natural conservation using remote sensing data.
Figure 1. study areaarea and sample stationsstations over four Amazon (a) Buá-Buá; Figure 1. Overview Overviewof of study and sample over four floodplain Amazon lakes: floodplain lakes: (b) Mamirauá; (c) Panta-leão; and (d) Pirarara. (a) Buá-Buá; (b) Mamirauá; (c) Panta-leão; and (d) Pirarara.
Remote Sens. 2017, 9, 322
4 of 23
Radiometric measurements were carried out at twenty sample stations during 12–19 August 2016 (Figure 1). Inter-calibrated Trios-RAMSES radiometers were used to measure the above water upwelling +0 +0 radiance (Lw [W [watt]·m−2 ·sr−1 ·nm−1 ]), sky radiance (Lsky [wW [watt]·m−2 ·sr−1 ·nm−1 ]) and above surface downwelling irradiance (Ed+0 [W [watt]·m−2 ·sr−1 ·nm−1 ]), within 350–900 wavelengths. The +0 sensors view followed the framed description of Mobley [37], whereas Lw has a relative azimuth angle (φv ) within 90◦ –135◦ from the sun and a zenith angle (θv ) of 45◦ from the nadir, and Lsky has a zenith angle (θ0 v ) of θv + 90◦ from nadir. All radiometers operate simultaneously, and measurements were performed within a 3-h interval (10:00 a.m.–13:00 p.m.) to avoid potential impact of specular reflection (glint) at low sun angles. In the pre-processing, all spectroradiometric measurements were interpolated for 1 nm interval (originally ~3.3 nm) and were normalized by sky reference. The remote sensing reflectance (Rrs ) was calculated at each sampling station according to Mobley [37]: Rrs (θv , φv , λ) =
+0 +0 Lw (θv , φv , λ) − rsky (θ0 v , φv , θ0 , W) × Lsky ( θ 0 v , φv , λ )
Ed+0 (λ)
! (1)
Afterwards, water reflectance (Rw∗ ) is calculated as: Rw∗ = π·Rrs
(2)
where, rsky is the air-water interface reflection coefficient that minimizes skylight reflection effects, and can be obtained in Mobley [38] as a function of a given view zenith and azimuth angles (θv ; φv ), sun zenith angle (θ0 ) and wind speed W (m/s). In-situ Rw∗ spectra were weighted by spectral response functions SRF(λ) of MSI bands, thus deriving a multi-spectral data comparable to atmospherically corrected MSI-reflectance from image.
R Rw,situ (λi ) =
k
Rw∗ (λ) × SRF(λ) dλ R k SRF(λ) dλ
(3)
where Rw,situ (λi ) is the MSI reflectance simulated from in-situ reflectance, k is bandwidth (nm), λi is the central wavelength of spectral band, and i is the number of MSI spectral band. Figure 2 shows the magnitude contrast of the mean and standard deviation of Rw∗ spectra among lakes. Although all lakes present a typical low spectral reflectance (5 m) and low wind speed (~1 m/s) that minimize resuspension and circulation of sediment from the bottom. Therefore, the time gap between MSI image (12 August) and in-situ measurements (12–19 August) was in principle not considered to be an issue for the comparisons. Table 1. Spectral bands of MSI sensor on-board Sentinel-2 satellite. MSI Bands (Spatial Resolution)
Central Wavelength (nm)
Bandwidth (nm)
Lref (W·m−2 ·sr−1 ·µm−1 )
SNR at Lref
Band 1 (60 m) Band 2 (10 m) Band 3 (10 m) Band 4 (10 m) Band 5 (20 m) Band 6 (20 m) Band 7 (20 m) Band 8 (10 m) Band 8A (20 m) Band 9 (60 m) Band 10 (60 m) Band 11 (20 m) Band 12 (20 m)
443 (Deep blue) 490 (Blue) 560 (Green) 665 (Red) 705 (Red-edge) 740 (Red-edge) 783 (Red-edge) 842 (NIR) 865 (NIR) 945 (NIR) 1375 (SWIR) 1610 (SWIR) 2190 (SWIR)
20 65 35 30 15 15 20 115 20 20 30 90 180
129 128 128 108 74.5 68 67 103 52.5 9 6 4 1.5
129 154 168 142 117 89 105 172 72 114 50 100 100
2.3. MAIAC Atmospheric Data Several MODIS algorithms were developed to provide atmospheric products, such as aerosol optical depth, column water vapour and ozone [46–48]. Continuous efforts have been made to enhance the accuracy of atmospheric retrievals from MODIS data. In addition to climate research, these atmospheric products are also used as input in the atmospheric correction of optical images [49]. In this context, the MAIAC algorithm was developed to derive a surface bidirectional reflectance distribution function (BRDF) from MODIS data and a suite of atmospheric products at a high 1 km resolution [27]. These atmospheric products include the cloud and cloud shadow mask, aerosol optical depth at 0.47 and 0.55 µm and column water vapour (UH2O ) (see Lyapustin et al. [27,50] for more details). Figure 3 shows the MOD09 surface reflectance product and a comparison of three MODIS aerosol products for the same day of MSI image (12 August 2016): (Figure 3b) MAIAC AOD 1 km; (Figure 3c) MOD04 3 km Collection 6; and (Figure 3d) MOD04 10 km Collection 6. There is a clear difference in the number of valid AOD retrievals between fine resolution MAIAC and MOD4 AOD products. Cloudy conditions limited the wide coverage of MOD04 retrievals at 3 and 10 km resolutions, while the fine-scale MAIAC retrieves AOD information for an individual set of cloud-free pixels. In our case, both Sentinel-2A and Terra satellite have an almost concurrent overpass (~10:30 a.m.), which guarantees fair applications of MODIS atmospheric products as auxiliary information in atmospheric correction. Thus, we selected tile h01v01 of the MAIAC atmospheric product on 12 August 2016. The average of AOD550 and UH2O within a 2 km buffer from each lake was used as input for the 6SV model (Table 2). In addition, columnar ozone content was obtained from MODIS global daily product (MOD08_D3-Total_Ozone_mean) on 12 August 2016.
Aerosol Model AOD at 550 nm 1 Ozone (cm-atm) Water vapour (g/cm2) Terrain elevation (km) Remote Sens. 2017, 9, 322 1
0.3 0.346 4.88 0.04
Biomass Burning 0.26 0.34 0.346 0.346 4.7 4.06 0.04 0.04
0.3 0.346 4.15 0.04
7 of 23
AOD adjusted by Terra bias (Section 4.1).
Figure 3. 3. MODIS MODIS AOD AOD products products concurrently concurrentlywith withMSI MSIimage imageon on12 12August August2016: 2016: (a) (a) MOD09 MOD09 surface surface Figure 1 (c) km;MOD04 (c) MOD04 3 km Collection and (d) MOD04 10 km reflectance;(b) (b)MAIAC MAIAC AOD reflectance; AOD 1 km; 3 km Collection 6; and (d)6;MOD04 10 km Collection 6. 550 550 Collection 6. Table 2. Input parameters of 6SV model for Sentinel MSI image.
3. Methods Parameters
BUA
MAM
PANTA
PIRA
Water vapour (g/cm ) Terrain elevation (km)
4.88 0.04
4.7 0.04
4.06 0.04
4.15 0.04
In this section, we present three atmospheric correction methods used for the MSI image and zenith angle (◦ ) 3.1.) 6SV 30.96model based 30.96 on MAIAC 30.96 AOD 30.96 forest adjacency Solar correction: (Section 550 and UH2O products; Solar azimuth angle (◦ ) 53.99 53.99 53.99 53.99 (Section 3.2.) ACOLITE algorithm; (Section 3.3) Sen2Cor algorithm; and (Section 3.4) forest adjacency Model Biomass Burning correction based onAerosol the LSU model. Based on the MSI-corrected image, we calculated the average of 1 0.3 0.26 0.3 to perform a direct AOD at 550 nm water surface reflectance using a 3 × 3-pixel box centered at each 0.34 sample station Ozone (cm-atm) 0.346 0.346 0.346 0.346 comparison with in-situ measurements. 2 3.1. 6SV Model + MAIAC Atmospheric Products 1
AOD adjusted by Terra bias (Section 4.1).
The 6SV model is a robust radiative transfer code for the atmospheric correction of different satellite data for a of variety ofAOD climatological conditions [23]. The atmospheric radiative transfer The assessment MAIAC 550 is still missing in the Amazon region. Therefore, we performed an evaluation of this satellite AOD product by comparing it with ground measurements. In this context, AERONET program is a global sun-photometer network that provides a multi-spectral sun and sky radiance to derive aerosol optical properties, such as AOD and angstrom exponent information [25]. There are three long-term operational AERONET sites in the Amazon basin: Balbina (1993–2003), Belterra (1996–2005), and Manaus-Embrapa (2011–2016). These sites provide consolidated ground-truth data for the quality evaluation of satellite aerosol products. Therefore, we compared MAIAC AOD retrievals at 550 nm with AERONET observations based on procedures used by Lyapustin et al. [27]. Besides validation of AOD products, we also calculated the monthly average of AOD550 , columnar water vapour and cloud cover frequency within the Mamirauá region (see red box in Figure 1) using the 15-year MAIAC Terra products (2000–2015). This temporal analysis provides background knowledge of the most variable atmospheric constituents in the study area.
Remote Sens. 2017, 9, 322
8 of 23
3. Methods In this section, we present three atmospheric correction methods used for the MSI image and forest adjacency correction: (Section 3.1.) 6SV model based on MAIAC AOD550 and UH2O products; (Section 3.2.) ACOLITE algorithm; (Section 3.3) Sen2Cor algorithm; and (Section 3.4) forest adjacency correction based on the LSU model. Based on the MSI-corrected image, we calculated the average of water surface reflectance using a 3 × 3-pixel box centered at each sample station to perform a direct comparison with in-situ measurements. 3.1. 6SV Model + MAIAC Atmospheric Products The 6SV model is a robust radiative transfer code for the atmospheric correction of different satellite data for a variety of climatological conditions [23]. The atmospheric radiative transfer computes attenuation effects caused by the scattering of molecules and aerosols and gaseous absorption by water vapour (H2 O), carbon dioxide (CO2 ), oxygen (O2 ), and ozone (O3 ). Currently, the 6SV model is an operational model used to derive the surface reflectance product from MODIS, ETM+ and OLI images [51,52]. The comparison of 6SV with other complex RTCs, such as SHARM, DISORT and MODTRAN, showed that the vector mode is highly accurate and provides fair agreement results that agree with other RTCs [53]. Due to consistency of multiple sensors and generic features, we used the 6SV model (version 1.1) to evaluate the atmospheric correction of the MSI image. For a given sun-view geometry, sensor characteristics, atmospheric condition and surface reflectance (Rsur ), TOA reflectance can be estimated with the following Equation (4) [23]: RTOA (λ, θv , φv , θ0 , φ0 ) = [RR+A (λ, θv , θ0 , φ0 )
+ td (λ, θ0 )tu (λ, θv ) 1−SR(λsur)R(λsur) (λ) ]Tg (λ, θv , θ0 ,)
(4)
where Tg refers to gaseous transmission of the principal absorbing constituents (O2 , O3 , CO2 , H2 O); RR+A is the molecular and aerosol scattering intrinsic reflectance; td and tu represent the atmospheric transmittance of aerosol and molecular from sun to target and target to sensor, respectively; S is the atmosphere spherical albedo of the atmosphere; and θv , φv , θ0 , φ0 are the view zenith, view azimuth, solar zenith and solar azimuth angles, respectively. Solving Equation (4) for surface reflectance and simplifying notations of angles, the atmospheric correction proceeds as following Equation (5): Rsur = (RTOA /Tg − RR+A )/[td tu + S(RTOA /Tg − RR+A )]
(5)
These atmospheric quantities are internally generated when running the model. In this study, the 6SV model was set to MSI bands using a spectral response function. Subsequently, the code was run for each subset of the MAIAC-based atmospheric data according to each lake, applying water vapour (Uh2 O , measured in g·cm−2 ), ozone content (UO3 , measured in cm·atm−1 ), aerosol model and AOD at 550 nm described in Table 2. We selected a biomass burning model based on the global aerosol mixture from Taylor et al. [24], which indicated a dominance of biomass burning particles in August in the Mamirauá region (biomass burning: 72%, Sulphate: 22.8%, Maritime: 2.5%, and Dust: 2.7%). The sun angles, date and time of the image acquisition were obtained from the image metadata. To understand the contribution of the atmosphere and surface to the TOA signal measured by MSI sensor, and to assess the atmospheric effects according to spectral bands, the TOA reflectance was simulated from the above mentioned water reflectance for each lake (Equation (3)). This theoretical TOA reflectance was simulated using the average AOD of August in the lakes (BUA: 0.178; MAM: 0.188; PANTA: 0.181; and PIRA: 0.19), biomass burning model, tropical atmosphere profile, and the average of in-situ reflectances from each lake.
Remote Sens. 2017, 9, 322
9 of 23
3.2. ACOLITE Algorithm The Atmospheric Correction for OLI “lite” (ACOLITE) algorithm was developed for the atmospheric correction of OLI/Landsat 8 and MSI/Sentinel 2 images for ocean and inland water studies [21,54,55]. The ACOLITE algorithm removes scattering effects of molecular and aerosol components over clear and turbid water. The Rayleigh scattering was corrected using LUTs from the 6SV model, while aerosol scattering was estimated based on the NIR (842 and 865 nm) bands for clear water and SWIR (1610 and 2130 nm) bands for moderate and turbid water [55]. These bands are very useful to decouple the aerosol reflectance, because the water contribution can be assumed to be negligible. Thus, the aerosol reflectance is retrieved at those bands and extrapolated to VNIR wavelengths based on aerosol type (ε) or on ratio of Rayleigh corrected reflectance in these infrared bands. The algorithm (version 2016.05.20) allows the user to choose some inputs for the atmospheric correction: (i) derive ε fixe on scene, per pixel or user-defined; (ii) gain factors for radiometric calibration [56,57]; (iii) atmospheric pressure; (iv) smooth window applied to aerosol reflectance values; and (v) cloud mask threshold (default: 0.0215 on the 1610 nm band). In our study, atmospheric correction was performed using the SWIR band approach, as recommended for turbid water [55]; aerosol correction per-pixel; a smooth window of 25 pixels; and cloud dilatation of 16 pixels (default). 3.3. Sen2Cor Algorithm The Sentinel 2 MSI data are distributed as ortho-image TOA reflectance products. To derive the MSI land products at Level-2A, the Sentinel toolbox provides the Sen2Cor processor for atmospheric correction and scene classification [20]. As a module of the Sen2Cor algorithm, an operational atmospheric correction is applied to the MSI spectral bands to retrieve atmospheric parameters from the image itself, with cirrus correction in a channel at 1375 nm; water vapour retrieval based on the B8A and B9 bands (865, 945 nm) and AOD retrieval [58]. Thus, the algorithm performs a semi-empirical approach that associates image-derived atmospheric properties with the pre-computed Look-up table (LUT) from libRadtran radiative transfer model. The advantage of this image-based approach is that is supports the application in regions without climatological information. The spectral relation of the reflectance of B4 (665 nm) and B2 (490 nm) bands with B12 (2190 nm) band is used for the AOD retrievals in reference areas, such as dense dark vegetation (DDV) surfaces [59]. In the Amazon region, DDV surfaces around lakes benefit AOD retrievals due to the strong reflectance relation between visible and SWIR bands and temporal stability in these preserved areas. When these vegetated areas are not available on scene, the algorithm identifies dark soil and water surfaces, or applies a default visibility of 20 km. To run the Sen2Cor algorithm (version 2.2.1), we chose the rural aerosol, ozone content of 330 D.U., smooth window of 100 × 100 m2 box applied to the water vapour map, and adjacency correction within the 1000 × 1000 m2 box. 3.4. Adjacency Effect Correction Adjacency effects are an optical-physical process caused by molecular and aerosol scattering where the target view is affected by radiation reflected from neighbourhood surfaces [60]. These multiple scattering regimes of photons from adjacent areas modify the spectral signal of the target pixel. The magnitude of these effects depends on the: (i) atmospheric turbidity, at a particular aerosol scattering phase function; (ii) spectral contrast of the surface reflectance; and (iii) sensor characteristics [61–63]. The influence of atmospheric scattering on adjacency effects increases as a result of the high optical thickness [64,65]. This impact produces blurring effects that distort the effective spatial resolution, reduce the apparent surface contrast and affect the land cover characterization [62,66]. In case of Sentinel-2 MSI, the actual spatial resolution allows discrimination of small water bodies [67], however, atmospheric scattering might change the effective pixel size and quality of the image according to aerosol microphysical properties (particle-size distribution, composition, and particle
Remote Sens. 2017, 9, 322
10 of 23
shapes) and loading [63]. Moreover, the target spectrum is more susceptible to adjacency effects in heterogeneous areas, especially, at high-spatial resolution [68]. In coastal and inland waters, these effects are more evident due to typical lower reflectance in relation to their neighbourhood surfaces, such as sand close to coastal waters and vegetation around reservoirs and lakes [30]. In our study, the large contrast of reflectance between forest and water surfaces contributes to spectral distortions of water-pixels, particularly, in the NIR signal (Figure 4). For example, the water spectrum of the Mamirauá Lake is highly affected by the forest neighbourhood, due to the typical low reflectance (0.8 up to 5 km from the lake (example in Figure 4). The average of these vegetation spectra is referred to as forest endmember per lake (Table 3). After running the LSU model, the forest fraction mapping of the lake was multiplied by forest reference spectrum to estimate adjacency effects for all water-pixels (Equation (7)), which were then removed from the MSI surface reflectance derived from the 6SV model (Equation (8)). Radj, i (xn , yn ) = Rfpure, i × ffi (xn , yn )
(7)
Rcor∗ , i (xn , yn ) = Rcor, i (xn , yn ) − Radj, i (xn , yn )
(8)
where Radj is the forest adjacency effects, Rfpure is the forest reference spectrum (Table 3), ff is the fraction of forest signal affecting the water spectrum, Rcor is the MSI-corrected image from 6SV model, Rcor∗ is the adjacency corrected image, xn = [x1 , . . . , xn ] is the column of pixel n, yn = [y1 , . . . , yn ] is the row of pixel n over water surface, and i = [1, . . . , 8] is the number of spectral band. Finally, the adjacency corrected MSI image was also evaluated with in-situ measurements. Table 3. Water and forest endmembers selected as input to LSU per lake. Lake
Type
B1
B2
B3
B4
B5
B6
B7
B8
BUA
Water Forest
0.005 0.023
0.006 0.031
0.008 0.062
0.007 0.030
0.006 0.096
0.002 0.289
0.002 0.341
0.002 0.343
MAM
Water Forest
0.007 0.017
0.008 0.022
0.009 0.048
0.008 0.023
0.007 0.075
0.004 0.251
0.004 0.306
0.003 0.313
PANTA
Water Forest
0.008 0.009
0.011 0.015
0.017 0.042
0.017 0.019
0.016 0.072
0.006 0.249
0.006 0.300
0.005 0.296
PIRA
Water Forest
0.008 0.017
0.012 0.023
0.019 0.050
0.018 0.025
0.015 0.077
0.005 0.253
0.004 0.312
0.003 0.329
4. Results and Discussion The results will be presented in the following sequence: (i) validation of MAIAC AOD550 product in the Amazon region; (ii) seasonal distribution of AOD550 , UH2O and cloud cover over the study area; (iii) simulation of the TOA reflectance of the MSI spectral bands; (iv) inter-comparison of three atmospheric methods applied to the MSI image from 12 August 2016; and (v) forest adjacency correction based on the LSU model. 4.1. Evaluation of MAIAC AOD550 Figure 5 shows a comparison between the average of AERONET measurements within ±30 min of MODIS overpass and the average of MAIAC AOD550 within a 25 × 25 km2 area. The agreement between the satellite and ground measurements was assessed using a linear regression model and the standard expected error (EE) of MODIS atmospheric products (dashed red lines) defined by AOD = ±0.05 ± 0.15 × AOD [46]. EE is the number of MAIAC retrievals falling within the standard expected error, and Remer et al. [46] suggested that EE threshold of 66% represents a satisfactory accuracy of the satellite AOD retrievals. The number of match-ups for Terra (245) was higher than that
Remote Sens. 2017, 9, 322
12 of 23
for Aqua (67), due to the difference of the cloud cover between morning and afternoon periods. In general, our results showed that both Terra and Aqua products agree well with AERONET measurements, with both slope of linear regression and correlation coefficient (R) higher than 0.74. For comparison, the Aqua product presents a slightly better accuracy than that of Terra, with a mean ratio of 1.03 for Aqua and 0.8 for Terra. In this context, forest surfaces represent feasible areas for a strong relation of visible and SWIR bands used for the DDV approach [59] and an increase the sensitivity of aerosol scattering effects in TOA reflectance [73]. Finally, the quality of MAIAC retrievals over the Amazon region are also observed by the number of AOD retrievals falling within standard expected error that presented EE values higher than 66% threshold (EE is 76.7% for Terra and 88.1% for Aqua). To increase the confidence in the AOD product as input for 6SV atmospheric correction, AOD values obtained from MAIAC Terra were corrected (AODcorrected = AOD × 1/0.803) using a mean ratio2017, of 0.803 Remote Sens. 9, 322 (see in Figure 5). 12 of 23
Figure 5.5. Scatter Scatterplot plotofof MAIAC AOD550 (y-axis) compared to AERONET AOD550 data (x-axis) Figure MAIAC AOD 550 (y-axis) compared to AERONET AOD550 data (x-axis) from from three sites in the Amazon region: Balbina, and Manaus-Embrapa. Solid three sites in the Amazon region: Balbina, BelterraBelterra and Manaus-Embrapa. Solid blue andblue greyand linesgrey are lines are the linear regression fits for Terra and Aqua, respectively. Red dashed lines are the MODIS the linear regression fits for Terra and Aqua, respectively. Red dashed lines are the MODIS standard standard error expected error(∆AOD intervals = ±0.05 ± 0.15[74]. × AOD) [74]. Regression Text box: Regression equation, expected intervals = ±(∆AOD 0.05 ± 0.15 × AOD) Text box: equation, correlation correlation coefficient (R), match-ups (n), root mean square error (RMSE), mean ratio), coefficient (R), match-ups (n), root mean square error (RMSE), mean ratio (AODMAIAC /AODAERONET ⁄ AOD ), and EE is the number of retrievals falling within standard expected (AOD AERONET and EEMAIAC is the number of retrievals falling within standard expected error. error.
4.2. Background of Atmospheric Constituents 4.2. Background of Atmospheric Constituents The seasonal variability of atmospheric constituents imposes distinct conditions for atmospheric The and seasonal variabilityinformation of atmospheric conditions for correction the background of these constituents constituents isimposes desirable distinct to understand the effects atmospheric correction and the background information of these constituents is desirable to on remote sensing data [75]. Figure 6 presents the monthly average of AOD550 , UH2 O and cloud cover understandusing the effects remote sensing datain[75]. Figurearea 6 presents monthly average of frequency 15-yearon MAIAC Terra products the study (red boxthe in Figure 1). The results AOD , U and cloud cover frequency using 15-year MAIAC Terra products in the study area H O showed that2 atmospheric components have distinct patterns between the first and second half of the (red box in first Figure results showed thatcloud atmospheric components have distinct year. In the half1). of The the year, high frequency cover (~90%) was observed, which patterns restricts between the first and second half of the year. In the first half of the year, high frequency cloud cover continuous remote sensing observations of the Mamirauá region in this particular period. However, (~90%) was observed, which restricts continuous remote sensing observations of the Mamirauá the probability of cloud-free images increases in July, August, and October, when the cloud cover region in this particular Hilker period.etHowever, thereported probability of cloud-free images pixels increases in July, decreased to 60%–80%. al. [76] also an increase of cloud-free (40%–60%) August, and October, when the cloud cover decreased to 60%–80%. Hilker et al. [76] also reported an in June, July and August based on MAIAC Terra observations from 2007 over the Amazon region increase of cloud-free pixels (40%–60%) in June, July and August based on MAIAC Terra and pointed out MAIAC improvements to detect small cloud-free areas compared with the previous observations fromUnder 2007 over Amazon the region and pointed out MAIAC improvements detect MOD09 product. thesethe conditions, temporal resolution of Sentinel 2 MSI imagestohas the small cloud-free areas compared with the previous MOD09 product. Under these conditions, the potential to increase the probability of cloud-free images over this tropical region thanks to a high temporal resolution of Sentinel 2 MSI images has the potential to increase the probability of cloud-free images over this tropical region thanks to a high five-day revisit scheduled for 2017. In parallel with cloud cover, AOD presents a remarkable seasonal variation in the first and second half of the year. In general, a low AOD (0.02–0.18) is typically observed throughout the year, however, the first half of the year registers the lowest AOD values (0.1–0.14), while the AOD values increase to
Remote Sens. 2017, 9, 322
13 of 23
five-day revisit scheduled for 2017. In parallel with cloud cover, AOD presents a remarkable seasonal variation in the first and second half of the year. In general, a low AOD (0.02–0.18) is typically observed throughout the year, however, the first half of the year registers the lowest AOD values (0.1–0.14), while the AOD values increase to 0.16–0.18 between August and November. Castro et al. [77] also found typical low AOD values in the Northern Amazon region (see TD1 region), and illustrated the variability between the first and second half of the year caused by local fires. Fires are the cheapest and most effective way for local communities to clear areas in order to introduce pasture and agricultural cultures [78] and can be intentionally used to dissipate insect pests. Therefore, the temporal variation of AOD values imposes particular conditions for atmospheric correction depending on the period, and needs further attention during the second half of the year.
Figure 6. Monthly average of aerosol optical depth (AOD) at 550 nm, water vapour content and cloud cover from MAIAC Terra (2000–2015) in Mamirauá region (see red-box in Figure 1).
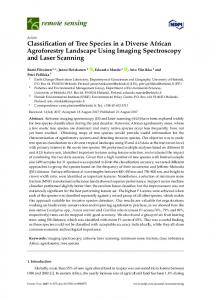
The Mamirauá region has high concentrations of water vapour (4.2–4.7 g/cm2 ), with quasi-permanent concentration throughout the year. Vermote et al. [70] showed that UH2O content (variation of 0.5–4.1 g/cm2 ) implicates on higher atmospheric effects on the reflectance magnitude in the NIR region (3.4%–14.0%) than those for visible bands (0.5%–3.0%) of the Landsat 5 TM bands. Therefore, remote sensing applications using NIR bands should consider the temporal variability of this constituent, for example to vegetation indices. Our field campaign was performed during August, with the lowest cloud cover conditions (~62%) of the year, despite facing the highest AOD and water vapour concentrations. To better understand the atmospheric and surface contributions, we conducted a TOA simulation using the average AOD over the four lakes for the dataset from August, as shown in Section 4.3. 4.3. TOA Simulation Analysis The contribution of atmosphere and surface reflectance from four Amazonian lakes to the TOA reflectance of MSI spectral bands was simulated using the AOD average of August (Figure 7). The major fraction of theTOA signal is due to atmospheric effects, whose contribution is higher than 75% and 50% over dark and bright lakes, respectively, for all MSI spectral bands. Because atmospheric scattering effects exponentially decay from shorter to longer wavelengths [79], deep blue and blue bands are affected the most by atmospheric signals—representing more than 84% of TOA reflectance. The highest lake surface contribution was observed for red (B4) and red-edge (B5) bands, where the scattering of suspended inorganic particles in the water column increases surface reflectance, which reached ~43% of the TOA reflectance in the Panta-leão Lake. On the other hand, the contribution of dark lakes to TOA reflectance reduced dramatically, mainly in the deep blue band, when compared with bright lakes. For example, the Buá-Buá reflectance had a critical fraction that reached ~4.8% in the deep
1
Remote Sens. 2017, 9, 322
14 of 23
blue band, which clearly shows the difficulty in accurately removing of atmospheric effects over these low-reflectance surfaces. These results suggest that caution is required when the TOA reflectance band ratio is used to retrieve water quality parameters, even when the algorithms present a better correlation using the TOA reflectance compared with surface reflectance [45]. The atmospheric effects among the bands are quite different, and band ratio therefore does not remove all atmospheric effects.
Figure 7. Simulation of TOA reflectance based on month average AOD in August (biomass burning model) and average of water reflectance from four Amazon floodplain lakes. The table at the top right shows the percentage of atmospheric and surface contribution in TOA reflectance simulated for MSI VNIR bands.
In fact, the atmospheric correction is a challenging issue for water quality studies, because inaccuracies of the surface reflectances propagate errors to water quality retrievals. For example, the mapping of CDOM concentration using blue and green bands [80] requires an efficient removal of scattering effects of these (most affected) bands, where atmospheric effects can contribute up to 80% of the TOA signal over dark lakes. On the other hand, red and red-edge bands applied to model TSS concentrations are less affected by atmospheric effects [81]. These examples thus illustrate that OACs modelling also requires a better understanding of atmospheric optical properties to derive accurate surface products. 4.4. Inter-Comparison of Atmospheric Correction Methods The atmospheric correction performances of three algorithms were assessed using the mean ratio (Rsur /Rw,situ ) and root mean square error (RMSE). The performances are better when the mean ratio is close to unity and RMSE is low. The mean ratio also expresses a relative error, when the values are higher than 2, or relative error is 100%, exceed the maximum bias accepted here. This threshold is important for bio-optical models, because the high inaccuracy of the reflectance affects, for example, the COA retrievals (see Odermatt et al. [82] for distinct bio-models). Figure 8 presents the comparison of the in-situ measurements acquired at four Amazon floodplain lakes with spectra results from the three atmospheric correction methods, while Figure 9 describes 1 the algorithm performance based on the mean ratio and RMSE. The three methods were capable of removing most of the atmospheric effects, where the reflectance magnitude mainly changed from TOA reflectance of ~12%–14% to surface of ~1%–2% of the deep blue and blue bands (Figure 8). Before atmospheric correction, TOA reflectance was a typical exponential spectrum dominated by Rayleigh
Remote Sens. 2017, 9, 322
15 of 23
and aerosol scattering effects. After correction, even with caveats, the MSI-corrected spectra (dark blue lines in Figure 8) presented a shape close to that of the in-situ measurements (light blue lines in Figure 8). The results showed that the quality of the MSI-corrected reflectance varies depending on the atmospheric correction method, spectral band, and lake characteristics. In general, Sen2Cor produced the smallest overall RMSE and the best MSI-corrected shape compared with in-situ data (Figure 9), while the spectral shape of ACOLITE showed a bias varying per sample station. The 6SV method provided a quite similar spectral shape in the visible region for bright lakes (RMSE < 0.006), but the reflectance magnitude was higher than that of the in-situ measurements (Figure 9c). Regarding the comparison among lakes, the MSI-corrected reflectance of bright lakes is closer to that of the in-situ measurements than to that of dark lakes; all methods have a mean ratio of ~0.5–1.5 in the visible bands (Figure 9a–c).
Figure 8. Comparison between MSI reflectance simulated from in-situ measurements, MSI TOA reflectance and MSI-corrected reflectance from three methods: 6SV model based on MAIAC product (a,b); ACOLITE (c,d); and Sen2Cor (e,f). The left column shows reflectance spectra from dark lakes (Buá-Buá and Mamirauá) and, the right column shows reflectance spectra from bright (Pirarara and Panta-Leão) lakes.
which affects the atmospheric correction accuracy of Sen2Cor algorithm. Toming et al. [12] found the shape similarity of MSI-corrected dataset using the Sen2Cor algorithm compared with a historical dataset (2011–2013), although the MSI reflectance spectra were overestimated by the algorithm. In the Amazon context, the presence of forest surfaces benefits AOD retrievals by the Sen2Cor algorithm, however, Remote Sens. 2017, 9, 322 this surface neighbour also implies in severe adjacency contamination on 16 ofthe 23 water spectrum measured by orbital sensors.
Figure 9. The mean ratio and RMSE for atmospheric correction methods from: dark lakes (a,b); and Figure 9. The mean ratio and RMSE for atmospheric correction methods from: dark lakes (a,b); bright lakes (c,d). The left column shows the mean ratio (Rsur RW,situ ), with better cases being and bright lakes (c,d). The left column shows the mean ratio (R sur /RW,situ ), with better cases being close tounity, unity,and andthe theright right column shows mean square (RMSE). that all mean close to column shows thethe rootroot mean square errorerror (RMSE). NoteNote that all mean ratio ratio values higher than maximum bias accepted here are represented as 2. values higher than maximum bias accepted here are represented as 2.
In dark lakes, ACOLITE and Sen2Cor showed quite similar RMSE values in the blue, green and red bands (RMSE ~0.006) (Figure 9b), while 6SV was clearly limited under these low reflectance conditions (RMSE ~0.011), with a mean ratio exceeding the maximum threshold (>2) for all spectral bands (Figure 9a). In contrast, the MSI-reflectance corrected by the 6SV model had a lower RMSE (~0.006) and mean ratio of ~1.2–1.50 (overestimation) in the visible bands over bright lakes, compared with the in-situ measurements (Figure 9c). The generic design of 6SV model includes standard aerosol types for land applications, such as biomass burning, urban, continental, desert, and maritime. Bassani et al. [83] highlighted the impact of the reflectance accuracy on coastal water when the standard 6SV aerosol use does not characterize the local aerosol microphysics. In our case, a complex mixture of natural biogenic and biomass burning particles over the central Amazon [78] imposes a constraint for standard aerosol use, which might explain some limitations of the radiative transfer simulation in order to remove atmospheric effects. In addition, satellite aerosol retrievals are susceptive to several uncertainty sources, such as sensor calibration, cloud screen, aerosol models and surface properties [84], which also help to explain the errors derived from the 6SV correction based on MAIAC product. Since most bio-optical models apply water surface reflectance mainly to visible bands (B1–B5) [8], Sen2Cor and 6SV results produce a reasonable spectral shape compared with the in-situ measurements for bright lakes; although they overestimate the reflectance magnitude (Figure 8b–f). In the visible bands, the ACOLITE method produced a distinct reflectance accuracy among the lakes, where water reflectance was overestimated (mean ratio ~1.1–1.5, except for B1) for dark lakes (Figure 9a) and underestimated (mean bias ~0.63–0.8, except for B1) for bright lakes (Figure 9c). A strong influence of the per-pixel correction was also observed; the random spatial error contributed to biases in the MSI-corrected reflectance for each sample station, while the 6SV produced a spatially correlated error due to the assumption of homogeneous atmospheric effects on lakes. The ACOLITE-SWIR approach requires a high signal-to-noise ratio (SNR) for the accurate
Remote Sens. 2017, 9, 322
17 of 23
quantification of the aerosol effect on TOA reflectance particularly because the effective aerosol scattering is relatively lower at longer wavelengths [85] and accurate aerosol reflectance can be affected by a low SNR. Thus, the propagation of noisy aerosol reflectance from SWIR bands (SNR of 100, see Table 1) to the atmospheric correction of visible bands might explain the spatial variability of error in ACOLITE reflectance retrievals. Therefore, an optional smooth window applied to SWIR bands becomes essential to filter and minimize undesirable effects [21]. Although the ACOLITE produced variable errors in this study, the algorithm has been extensively used for the atmospheric correction of OLI images with satisfactory experiences in coastal and maritime water, for example, sediment plume mapping in the Florida offshore, USA [86], and for turbidity quantification in the Wadden Sea, Germany [87]. Our assessment represents preliminary experience with ACOLITE applied to Sentinel 2 MSI over floodplain water, and further evaluations could contribute to consolidate this image-based approach. The Sen2Cor algorithm achieves very similar errors for both types of lakes, with RMSE between ~0.003–0.011 for all spectral bands (Figure 9b–d), and better mean ratio for blue, green and red bands (grey marker in Figure 9a–c). In fact, the presence of dense forest close to Amazon floodplain lakes provides feasible areas required for DDV application used by the Sen2Cor algorithm. Although an extensive validation has not been performed yet, first results of the comparison between Sen2Cor AOD retrievals over DDV areas and ground measurements led to an AOD uncertainty of about 0.03 [88], which affects the atmospheric correction accuracy of Sen2Cor algorithm. Toming et al. [12] found the shape similarity of MSI-corrected dataset using the Sen2Cor algorithm compared with a historical dataset (2011–2013), although the MSI reflectance spectra were overestimated by the algorithm. In the Amazon context, the presence of forest surfaces benefits AOD retrievals by the Sen2Cor algorithm, however, this surface neighbour also implies in severe adjacency contamination on the water spectrum measured by orbital sensors. 4.5. Adjacency Effect Correction Large differences between forest and water reflectance contribute to strong adjacency effects on the water spectrum in the NIR region. For spectral bands above 705 nm, Sen2Cor correction minimizes the adjacency effects over dark lakes leading to a lower RMSE ( 0.013) (Figure 9b–d). Nevertheless, none of the methods presented a suitable performance to remove forest adjacency effects in the NIR region, with a mean ratio exceeding 2 (Figure 9a–c). Dornhofer et al. [11] evaluated the Sen2Cor and ACOLITE performances for bio-optical models in marine water and found an underestimation of the surface reflectance in the visible region for both methods and adjacency effects on the NIR bands due to sand surface of the shoreline. The adjacency correction applied by Sen2Cor is limited over low reflectance surfaces; methods focusing on water surfaces are required for a high spatial resolution [69]. Figure 10 presents the adjacency correction based on LSU model applied to the MSI water reflectance from dark and bright lakes. The results showed that the adjacency correction improves the quality of water reflectance of all spectral bands. In both dark and bright lakes, MSI reflectance exhibits a better agreement with in-situ measurements, especially for MSI bands above 705 nm (B6–B8), where the RMSE decreases from ~0.023 to lower than 0.006 in dark lakes and from ~0.015 to lower than 0.004 in bright lakes (Figure 10). Evidently, the LSU approach solves the unmixing problem of the water spectrum and reduces the discrepancy caused by forest adjacency. However, note that results have limitations to an extensive application, because we assume that only the forest surface causes adjacency effects and the water endmember was based on prior knowledge of radiometric collection over lakes. These assumptions limit the operational correction to reservoir and lakes with historical radiometric collection or to cases where water endmember can be derived from the image itself. Furthermore, adjacency effects typically depend on the surface types in the scene, which makes it reasonable to consider that unmixing problems are caused by other surfaces. Recently, Sterckx et al. [30] proposed a generic-sensor adjacency correction based on the NIR similarity spectrum
Remote Sens. 2017, 9, 322
18 of 23
for water studies, and showed positive or neutral effects on the reflectance accuracy depending on environmental conditions. In general, adjacency correction is a complex procedure that should consider a variety of environmental conditions. Our positive experience using the LSU model is a preliminary assessment to advance towards a more sophisticated image-based approach.
Figure 10. Comparison between MSI TOA reflectance (grey), MSI-corrected reflectance from 6SV model (dark blue), and MSI-adjacency corrected reflectance (purple) and MSI reflectance simulated from in-situ measurements (light blue) from dark (a,c) and bright lakes (b,d). RMSE bars before (6SV) and after adjacency correction (6SV + adj. cor.) applied to MSI image from 12 August 2016.
5. Conclusions Sentinel 2 MSI images represent a new opportunity for monitoring small inland aquatic systems. However, to derive an accurate surface reflectance over complex water and consequently produce better water quality products, efforts must focus on the development of efficient atmospheric correction methods. Although our results present a variation in the surface reflectance accuracy along the spectral range, it is important to highlight the complexity of environmental condition in our study area, such as the water reflectance (