remote sensing Article
Identification of Structurally Damaged Areas in Airborne Oblique Images Using a Visual-Bag-of-Words Approach Anand Vetrivel *, Markus Gerke, Norman Kerle and George Vosselman Faculty of Geo-Information Science and Earth Observation (ITC), University of Twente, Enschede 7500 AE, The Netherlands;
[email protected] (M.G.);
[email protected] (N.K.);
[email protected] (G.V.) * Correspondence:
[email protected]; Tel.: +31-654-257-742 Academic Editors: Zhenhong Li, Roberto Tomas and Prasad S. Thenkabail Received: 22 December 2015; Accepted: 4 March 2016; Published: 11 March 2016
Abstract: Automatic post-disaster mapping of building damage using remote sensing images is an important and time-critical element of disaster management. The characteristics of remote sensing images available immediately after the disaster are not certain, since they may vary in terms of capturing platform, sensor-view, image scale, and scene complexity. Therefore, a generalized method for damage detection that is impervious to the mentioned image characteristics is desirable. This study aims to develop a method to perform grid-level damage classification of remote sensing images by detecting the damage corresponding to debris, rubble piles, and heavy spalling within a defined grid, regardless of the aforementioned image characteristics. The Visual-Bag-of-Words (BoW) is one of the most widely used and proven frameworks for image classification in the field of computer vision. The framework adopts a kind of feature representation strategy that has been shown to be more efficient for image classification—regardless of the scale and clutter—than conventional global feature representations. In this study supervised models using various radiometric descriptors (histogram of gradient orientations (HoG) and Gabor wavelets) and classifiers (SVM, Random Forests, and Adaboost) were developed for damage classification based on both BoW and conventional global feature representations, and tested with four datasets. Those vary according to the aforementioned image characteristics. The BoW framework outperformed conventional global feature representation approaches in all scenarios (i.e., for all combinations of feature descriptors, classifiers, and datasets), and produced an average accuracy of approximately 90%. Particularly encouraging was an accuracy improvement by 14% (from 77% to 91%) produced by BoW over global representation for the most complex dataset, which was used to test the generalization capability. Keywords: damage detection; feature representation; oblique airborne images; supervised learning; texture; UAV; Visual-Bag-of-Words
1. Introduction Rapid damage assessment after a disaster event such as an earthquake is critical for efficient response and recovery actions. Direct manual field inspection is labor intensive, time consuming, and cannot assess the damages in inaccessible areas. Remote sensing technology is the most predominant and early source to provide data for performing such assessments, either manually or using automated image analysis procedures [1,2]. Various kinds of remote sensing data such as optical, synthetic aperture radar (SAR), and LiDAR are being used for the damage assessment process [1]. However, optical data are often preferred as they are relatively easy to interpret [1]. Moreover, optical remote sensing provides very high resolution images ranging from the decimeter to the centimeter scale through various platforms such as satellites, manned aircrafts, and unmanned aerial vehicles
Remote Sens. 2016, 8, 231; doi:10.3390/rs8030231
www.mdpi.com/journal/remotesensing
Remote Sens. 2016, 8, 231
2 of 22
(UAVs) [3–5]. This allows for performing comprehensive damage assessment through identifying different levels of damage evidence, ranging from complete collapse to cracks on the building roof or façades, by choosing images at appropriate scales. Particularly oblique airborne images are recognized as the most suitable source, as they facilitate the damage assessment on both roofs and lateral elements [6,7]. For example, even extensive building damage such as inter-story collapse or pancake collapse can be identified reliably only with oblique view images, while conventional nadir views at best provide damage proxies such as external debris [1,7,8]. Although current remote sensing yields images at a vast range of views and scales, automatic recognition of even heavy damages to buildings is still challenging [1]. This is due to various reasons such as the complexity of the scene, uncertain characteristics of damage patterns, and the varying scale problem in oblique view images. Generally, the regions corresponding to heavy damage are determined through the identification of damage patterns corresponding to rubbles piles, debris, and spalling in an image region (refer to Figure 1) [8]. Those damage evidences have a specific meaning and play a major role in damage classification. For example, the presence of significant amounts of debris/rubble piles around the building is the strong indication of (partial) building collapse. Spalling is an indicator of minor damage or partially broken structural elements. The recognition process of those damage patterns can be performed by analyzing features extracted either at the pixel or the region level [1,9,10]. However, the pixel level analysis is not meaningful for very high spatial resolution images, particularly in the context of damage assessment, as the evidences are identified based on the characteristics of their radiometric distribution pattern, which can be captured more precisely at a region level. However, in region-level classification the critical step is to define the region that is appropriate to identify the specific damage patterns. Generally, image regions are obtained either through a gridding approach or though image segmentation [11]. The most simple, efficient, and straightforward strategy is the gridding approach, where the image is split into uniform rectangular cells. However, the regions derived from gridding are often cluttered, as they may comprise different kinds of objects. For example, a single cell may contain trees, building elements, cars, road sections, debris, etc. Moreover, oblique images are more complex compared to nadir images, since they also capture façades that frequently comprise various elements, such as windows, balconies, staircases, etc. They generally also look more cluttered than nadir images containing largely roofs, and reveal façade information only at the image border, depending on the lens opening angle. It is quite challenging to identify the damage patterns in such a cluttered region. This can be alleviated by using a segmentation approach, which segments the damaged portions and other objects in the scene as separate regions. However, the selection of appropriate features and a segmentation algorithm that is suitable for a given damaged and cluttered environment is a challenging problem, one that requires substantial semantic analysis. Apart from clutter, the regions obtained from oblique images vary in scale. Nevertheless, the identification of damage patterns regardless of image scale is an important prerequisite in damage assessment. For example, damage at a building level such as inter-story collapse can be captured better at coarser scales (e.g., 100 ˆ 100 pixel region in an image of the decimeter scale), while minor damages such as spalling at a building element level require finer scales (e.g., 100 ˆ 100 pixel region in an image of the centimeter scale). Therefore, a robust method is required to recognize the damage pattern in a defined region irrespective of the scale and clutter. This is an analogue of the human visual pattern recognition system, which is extremely proficient at identifying the damage patterns regardless of the scale and complexity of the scene.
Remote Sens. 2016, 8, 231
3 of 22
Remote Sens. 2016, 8, 231
3 of 22
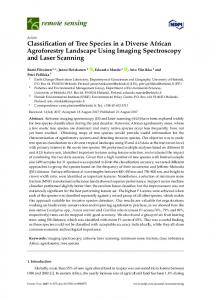
Figure 1. An example of debris, rubble piles, and spalling.
Figure 1. An example of debris, rubble piles, and spalling.
In the field of computer vision, various methods have been reported for pattern recognition tasks Invarious the field of computer methods been reported forscene pattern recognition in applications, suchvision, as objectvarious categorization, facehave recognition, and natural classification tasks[12–14]. in various applications, such as object categorization, face recognition, and natural scene These methods are mostly based on supervised learning approaches, which work well for classification [12–14]. methods are mostlyHowever, based onthe supervised learning approaches, which conventional imageThese classification applications. overall performance of the learning depends the discriminative power However, of the image (features) of workapproach well for completely conventional imageon classification applications. the descriptors overall performance considered for the classification Generally, images are described through either global (e.g., the learning approach completely [15]. depends on the discriminative power of the image descriptors textures) or local features, like point descriptors such as Scale Invariant Feature Transform (SIFT) (features) considered for the classification [15]. Generally, images are described through either global However, most global features are very sensitive to scaleasand clutter [17]. In contrast, local (e.g.,[13,16]. textures) or local features, like point descriptors such Scale Invariant Feature the Transform descriptors are robust to clutter but cannot capture the global characteristics of the image [18,19]. An (SIFT) [13,16]. However, most global features are very sensitive to scale and clutter [17]. In contrast, the alternate feature representation strategy, such as Visual-Bag-of-Words (BoW), captures the global local descriptors are robust to clutter but cannot capture the global characteristics of the image [18,19]. characteristics of the image through encoding a set of local features, which makes them robust to An alternate feature representation strategy, such as Visual-Bag-of-Words (BoW), captures the global scale and clutter [20,21]. For example, in texture-based classification, the global texture pattern of the characteristics of the by image through encoding a set of local features, whichpatterns. makes them robust image is captured the frequencies of the co-occurrence of the local texture This kind of to scalefeature and clutter [20,21]. For example, in texture-based classification, the global texture pattern representation outperforms the conventional global feature representation approaches in of the image is captured [22]. by the frequencies of the co-occurrence local texture patterns.hasThis image classification Apart from general image classification,of thethe Bag-of-Words framework kindbeen of feature representation outperforms the conventional global feature representation approaches demonstrated as a potential approach in many image-based domain specific applications in image classification [22]. [23], Apart fromaction general classification, the Bag-of-Words including image retrieval human andimage facial expression recognition [24,25], imageframework quality assessment [26], and medical image annotation [27]. Conceptually, thus, the BoW approach seems to has been demonstrated as a potential approach in many image-based domain specific applications be appropriate for identifying the damaged regions in airborne oblique images, which generally look including image retrieval [23], human action and facial expression recognition [24,25], image quality cluttered[26], andand varymedical in scale. image annotation [27]. Conceptually, thus, the BoW approach seems to assessment Pattern recognition methods includingregions BoW are on aoblique supervised learning approach thatlook be appropriate for identifying the damaged in based airborne images, which generally attempts to learn the underlying relationship between the image-derived features and the pattern of cluttered and vary in scale. a specific category, in this case the damage pattern. Therefore, apart from a feature representation Pattern recognition methods including BoW are based on a supervised learning approach that strategy, the choice of features that best discriminate the damaged and non-damaged regions is also attempts to learn the underlying relationship between the image-derived features and the pattern of a key element. Numerous studies reported that textures are the most influential feature for damage a specific category, in this case the damage pattern. apart a feature pattern recognition, as the damaged regions tend to Therefore, show uneven and from peculiar texture representation patterns, in strategy, the choice of featuresregions that best discriminate the damaged and non-damaged is also contrast to non-damaged [28–30]. Many damage classification studies usedregions statistical a keytextures element. Numerous studies reported that textures are the most influential damage such as grey level co-occurrence matrix (GLCM)-based features for the feature damagefor pattern pattern recognition, as the damaged regions to show andhave peculiar patterns, recognition [10,31,32]. However, other texturetend measures suchuneven as wavelets been texture recognized as superiortotonon-damaged GLCM in manyregions pattern [28–30]. recognition problems, including land cover classification [33]. in contrast Many damage classification studies used statistical Particularly region-level pattern classification problems, descriptors as Histogram of textures such asfor grey level co-occurrence matrix (GLCM)-based featuressuch for the damage pattern Gradient[10,31,32]. OrientationHowever, (HoG), Gabor SIFT and Speeded-Up Robusthave Features have as recognition otherwavelets, texture measures such as wavelets been(SURF) recognized led totogood results [34–36].pattern All these features describe the pattern of the given region in a unique[33]. superior GLCM in many recognition problems, including land cover classification way, based on the magnitude of gradient along various orientations and scales. Vetrivel et al. [37] Particularly for region-level pattern classification problems, descriptors such as Histogram of Gradient demonstrated the potential of HoG and Gabor features to classify the damaged regions in very Orientation (HoG), Gabor wavelets, SIFT and Speeded-Up Robust Features (SURF) have led to good high resolution UAV images. However, they found limitations with the conventional global results [34–36]. All these features describe the pattern of the given region in a unique way, based on representation of HoG and Gabor features, especially with respect to generalization. So far, the magnitude gradient along orientations and scales. Vetrivel et al.in[37] demonstrated however, toof our knowledge novarious work exists that combines the named features a BoW fashion for the potential of mapping. HoG and Gabor features to classify the damaged regions in very high resolution UAV damage
images. However, they found limitations with the conventional global representation of HoG and 3 Gabor features, especially with respect to generalization. So far, however, to our knowledge no work exists that combines the named features in a BoW fashion for damage mapping.
Remote Sens. 2016, 8, 231
4 of 22
The objective of this paper is thus to develop a robust method based on the BoW approach that is suitable especially (but not only) for oblique images to identify the damage patterns related to rubble piles, debris, and spalling, regardless of the scale and the clutter of the defined region in an image. Following the above argumentation, a grid-based region definition is pursued. The robustness of the developed method based on this BoW approach is analyzed by comparing the performance of various learning algorithms and image descriptors (Gabor and HoG) under both the conventional and the BoW approach. Also, the generalization capability of the developed method is analyzed, by testing it on a variety of images corresponding to various scales, camera views, capturing platforms, and levels of scene complexity. 2. Methods For the identification of damaged regions in an image, as a preparation step we provide reference data. That is, the given image is split into M ˆ N regions, which are termed image patches. The image patches are manually labeled as damaged if any kind of damage pattern related to debris, spalling, and rubble piles is observed in them. The automatic detection of those damage patterns within the patches is carried out using two different feature representation approaches: global and BoW representation. The feature descriptors and learning algorithms considered for both the global and BoW-based damage classification process are described in the respective sub-sections. 2.1. Damage Classification Based on Global Representation of Features This process includes two steps: (1) extraction of image descriptors that provide the global description of the given image patch; and (2) classification of the given image patch as damaged or non-damaged, based on the extracted feature descriptors using a supervised learning algorithm. 2.1.1. Extraction of Feature Descriptors The HoG and Gabor wavelets-based feature descriptors are considered for the global feature representation-based damage classification process. (a)
Histogram of Gradient Orientation (HoG)
The standard approach is used to extract the HoG features (e.g., Dalal Triggs [38]), where the given image patch is split into a number of overlapping blocks, and histograms of gradient orientation derived for each block are concatenated to form a feature vector. This gives the global representation of the image patch. Procedure: (1) (2) (3) (4) (5)
(6)
(7)
Derive gradient magnitude and its orientation for each pixel in the image patch. Split the gradient image into A ˆ B cells. Again split the gradient image into a number of overlapping blocks, where each block contains C ˆ D cells with 50% of overlapping cells between the blocks. Define the bin size for the histogram of gradient orientation, where each bin corresponds to a specific orientation (the bin size remains fixed for all experiments later). For each cell, compute the histogram of gradient orientation by adding the magnitude of the gradient to its corresponding orientation bin. Therefore, the size of the feature description of each cell is equal to the number of bins. Concatenate the histograms of gradient orientation of all cells within each block to get the block level description. Normalize the histograms’ magnitude within the block to compensate for the local illumination variations [39]. Concatenate all block level descriptors to form the global descriptor of the patch.
Remote Sens. 2016, 8, 231
(b)
5 of 22
Gabor wavelets descriptors
The Gabor wavelets descriptors are obtained by convolving the image with a set of Gabor wavelet filters. These filters are derived by appropriate rotation and scaling of the mother Gabor wavelet function, where each filter is tuned to capture the pixel information at a specific orientation and frequency. The detailed procedure for Gabor wavelets filter generation can be found in Arivazhagan et al. [40]. After obtaining the Gabor filter responses for each pixel in the image patch, the region-level Gabor wavelet descriptor is represented by the histogram of magnitude of filter responses for all combinations of orientations and frequencies (cf. Jun Fei [41]). This histogram is computed for three consecutive pyramid levels of image patches, in order to capture the variation across scales, in addition to the variation across frequencies and orientations. The procedure used for extracting the global Gabor feature descriptors for an image patch is described below. Procedure: (1) (2) (3) (4)
(5) (6)
Generate I ˆ J number of 2D Gabor wavelet filters, where I and J are the number of frequencies and number of orientations used to generate the Gabor wavelet filters, respectively. Convolve the image patch with the generated filter banks, which results in I ˆ J number of feature images. Normalize each feature image using l2 normalization. Compute the histogram of Gabor filter responses, where each histogram bin corresponds to a specific frequency and orientation. Therefore, the number of histogram bins is equal to I ˆ J, which is the size of the final feature vector. Also, extract the Gabor wavelet features for the other two pyramid levels of the image patch, by subsampling it to ½ and ¼ of the image patch size. Feature vectors derived at different scales are concatenated to form the final feature vector. Therefore, this final feature vector will comprise features extracted at multiple scales, multiple frequencies, and multiple orientations.
2.1.2. Damage Classification Using the Derived Global Feature Descriptors Supervised learning approaches are adopted to classify the given image patch as damaged or non-damaged, based on the global feature descriptors. Three state-of-the-art and widely used supervised learning algorithms, Support Vector Machines (SVM) [42], Random Forests (RF) [43], and Adaboost [44], are considered for the damage classification process. These learning algorithms belong to the families of different learning paradigms, which learn the underlying relationship between the input features and the output label in a unique way. Three different learning paradigms are considered in order to analyze whether the considered feature descriptors are independent of the supervised algorithm, i.e., how the classification task is solved independently of the applied learning strategy. Also, each learning algorithm has a number of tunable parameters, referred to as hyper-parameters, which have a significant impact on the performance of the learning model [45]. Therefore, the hyper-parameters are tuned for the best model by searching the parameter space using the grid space search approach [46]. This approach constructs a number of learning models for different settings of the hyper-parameters, using the training set. The performance of each model is assessed using a cross-validation procedure. The best performing model is selected as the final model with tuned hyper-parameters, and then evaluated using the testing set. 2.2. Damage Detection Using Visual-Bag-of-Words The standard BoW framework is adopted for the damage classification process. The BoW framework comprises different components, such as feature point detection, feature descriptors, visual word dictionary, and a classifier. The algorithms used for each component and the overall procedure are described below.
Remote Sens. 2016, 8, 231
6 of 22
Overall, the BoW-based damage classification process is carried out in two stages: (1) construction of visual word dictionary; and (2) representation of the image in terms of BoW (histogram of visual words), and training the classifier based on them. Stage 1: (a) Feature point detection The basic idea behind this step is that an image can be described by a small number of significant pixels (salient points). For example, pixels corresponding to edges and corners contain the most significant information compared to pixels of homogenous regions. Salient point descriptors that are invariant to scale and orientation are most appropriate to build an image classification model that is robust to scale and rotation. Numerous such salient point detection methods are available, with SIFT and SURF commonly being used in the BoW context [19]. In this study, SURF was used since it is faster than SIFT and its descriptor is suitable to be used as the feature in the BoW framework, as discussed in the following sub-section. A description of the SURF points detection process can be found in Bay et al. [47]. (b) Feature extraction The purpose of this step is to extract the local feature descriptor for each salient point in the given image patch. The feature descriptors HoG and Gabor wavelets, which are used in the global representation-based damage classification, are also considered here for the local description of salient points in the BoW-based damage classification. This allows us to compare the potential of BoW and global feature representation irrespective of the features. In the BoW approach the SURF descriptor is additionally used to describe the salient points. This is because SURF is a well-proven point descriptor (local descriptor), widely used in BoW-based image classification processes [48]. Furthermore, SURF descriptors are based on wavelet responses, which also describe the image region in terms of textures, similar to HOG and Gabor feature descriptors. Therefore, the three feature descriptors HoG, Gabor wavelets, and SURF are used independently to describe each salient point in the given image patch for the BoW-based damage classification. The local pattern description for each salient point is derived by considering a local neighborhood of P ˆ Q pixels around the salient point. The same procedure as described in Section 2.1.1 is followed to extract the Gabor and HoG features. The standard procedure is used to extract the SURF feature descriptor (cf. Bay et al. [47]). (c) Visual words dictionary construction The feature descriptors of salient points from all image patches (regardless of their class) are concatenated into a single feature vector. Numerous feature encoding methods have been reported for visual word dictionary construction [49]. We adopted the most commonly used iterative k-means clustering algorithm [48]. The obtained feature vector is clustered into k clusters using the iterative k-means clustering [50]. Each cluster center is considered as the visual word, and the cluster centers are collectively referred to as a visual word dictionary. Stage 2: (a) Image description based on visual words To represent the given image patch in terms of BoW (histogram of visual words), the salient points in the image patch are detected and feature descriptors are obtained for each point. The detected points in the image are assigned to their closest visual word in the dictionary. Subsequently, the frequency of occurrence of the visual words in the image is represented as a single histogram, which is referred to as the BoW representation of the image, which will be fed into the classifier in the next step.
Remote Sens. 2016, 8, 231
7 of 22
(b) Classification of visual words using machine learning algorithms Again, the three learning algorithms SVM, RF, and Adaboost are used as classifiers for classifying the damage and non-damaged image patches based on BoW. The procedure described in Section Remote Sens. 2016, 8, 231 7 of 22 2.1.2 is followed to develop the supervised learning models based on the BoW features. The overall workflow BoW-baseddamage damage classification classification process depicted in Figure 2. 2. The overall workflow of of BoW-based processis is depicted in Figure
Figure 2. Overallprocess processof of the the BoW-based classification. Figure 2. Overall BoW-baseddamage damage classification.
3. Experiments and Results
3. Experiments and Results
The damage classification method was evaluated using four different datasets, with each
The damage classification method was evaluated using four different datasets, with each differing differing in its image characteristics such as scale, camera view, capturing platform, and scene in itscomplexity. image characteristics as scale, camera view,for capturing platform, and process scene complexity. Each data setsuch was independently analyzed the damage classification based Each on data wasfeature independently for wavelets, the damage process based on the theset three descriptorsanalyzed HoG, Gabor and classification SURF. The performances of HoG andthree feature descriptors Gaborclassification wavelets, and SURF. The by performances HoG wavelets for Gabor waveletsHoG, for damage were analyzed representingof them in and both Gabor a conventional andclassification BoW framework. Also the by potential of thethem SURFin descriptor was analyzed for damage damage were analyzed representing both a conventional and BoW framework. classification by representing it in a BoW framework and comparing it with BoW-based Gabor and it in Also the potential of the SURF descriptor was analyzed for damage classification by representing HoG. a BoW framework and comparing it with BoW-based Gabor and HoG. Three supervised learning algorithms, SVM, RF, and Adaboost, were used for analyzing the performance of the feature descriptors. Therefore, each dataset was tested with different combinations of feature descriptors and supervised learning algorithms, as depicted in Figure 3. 7
Remote Sens. 2016, 8, 231
8 of 22
Three supervised learning algorithms, SVM, RF, and Adaboost, were used for analyzing the Remote Sens. 2016, 8, 231 8 of 22 performance of the feature descriptors. Therefore, each dataset was tested with different combinations feature descriptors and supervised algorithms, as depicted inprocess Figure 3. include a number of Theofconducted experiments for learning the damage classification The conducted experiments for the damage classification process include a number of algorithms, algorithms, and each algorithm was associated with a number of parameters. The values used for the and each algorithm was associated with a number of parameters. The values used for the parameters parameters of algorithm the algorithm are in shown Table 1. The hyper-parameters for tuning the of the are shown Table in 1. The hyper-parameters considered forconsidered tuning the learning learning algorithms algorithms Section are described (cf.(cf. Section 2.1.2)2.1.2) are described in Table 2.in Table 2.
3. Combinations of feature descriptors and and learning algorithms tested for each Figure 3.Figure Combinations of feature descriptors learning algorithms tested fordataset. each dataset.
Table 1. Definition of parameters associated with each algorithm/method used in the experiment. Table 1. Definition of parameters associated with each algorithm/method used in the experiment.
Algorithm/Method Parameter Values Algorithm/Method Parameter Values Image patch M = 100; N = 100 Image patch M = 100; N = 100 generation generation A = 25; B = 25 A = 25; B = 25 C =C4;=D HoG procedure 4; = D 4= 4 HoG procedure bin bin sizesize = 9= 9 Gabor wavelet
Gabor wavelet descriptor descriptor Feature extraction
Visual word dictionary word construction
for damage classification
Supervised model for damage classification
Reference
To generate 100 × 100 image patches
To generate 100 ˆ 100 image patches
Section 2
Section 2
Cell size A × B–25 × 25 pixels
Cell size A ˆ B–25 ˆ 25 pixels Block C ׈D–4 Block size Csize ˆ D–4 4 cells× 4 cells Section 2.1.1 Bin size of histogram of thethe gradient Bin size of histogram of gradient orientations
P = 10; Q = 10
Gabor wavelet filters 10 ˆ 10 local neighborhood is considered for deriving descriptorisfor Section 2.2 10 × 10 local neighborhood considered each salient point for deriving descriptor for each salient
k = 500
k = 500 10-fold cross validation
10-fold validation Thecross dataset is split into 70% and 30% for training and testing, respectively
The dataset is split into 70% and 30% for training and testing, respectively
Section 2.1.1
orientations
I = 5; J = 8
P = 10; Q = 10
Visual dictionary construction Supervised model
Reference
I, J are the number of frequencies and I, J are the number of frequencies and orientations respectively to generate the Section 2.1.1 orientations respectively Gabor wavelet filters to generate the
I = 5; J = 8
Feature extraction
Description
Description
point
k value for k-means clustering
Section 2.2
Section 2.2
k value for k-means clustering
Cross-validation to identify the optimal hyper-parameters for a learning model based on the grid search approachthe Cross-validation to identify
Section 2.1.1
Section 2.2
Section 2.1.2
optimal Training set is used to train model model hyper-parameters for the a learning and also for cross-validation for tuning based on the grid search approach the hyper-parameters. Testing set is Training set is the used to train the model used for evaluating trained model. and also for cross-validation for tuning the hyper-parameters. Testing set is used for evaluating the trained model.
Section 2.1.2
Remote Sens. 2016, 8, 231
9 of 22
Table 2. Definition of grid search space for tuning the hyper-parameters of the classifiers. Supervised Classifier
SVM
RF
Hyper-Parameter
Grid Search Space
Description
C
0.001 to 100, step size—multiples of 10
Regularization parameter which has a significant effect on the generalization performance of the classifier.
Kernel
Linear, radial basis function (RBF) and histogram intersection
The function used to compute the kernel matrix for classification.
gamma
0.0001 to 1.0, step size—multiples of 10
Regularization parameter used in RBF kernel (Gaussian kernel function) which has significant impact in the performance of the kernel.
N_estimators
3 to 20, step size 2
Number of trees in the forest.
Max_depth
1 to 5, step size 1
Maximum depth of the tree.
Min_samples_split
1 to 4, step size 1
Minimum number of samples required to split a node.
Min_samples_leaf
1 to 3, step size 1
Minimum number of samples required in newly created leaf after the split.
N_estimators
100 to 1000, step size 100
The maximum number of estimators that can be used to build the ensemble learning model.
Learning rate
0.01 to 0.1, step size 0.01
Regularization parameter that scales the contribution of each weak estimator.
Adaboost
3.1. Dataset 1: UAV Images UAV images captured over two different areas were considered: (1) a small region around a church (“Church of Saint Paul”) in Mirabello, Italy, damaged by a 2012 earthquake; (2) a small region around a partly demolished industrial facility in Gronau, Germany. Both regions possess similar characteristics, and they contain only a few buildings that are largely disconnected. One building in each region was partially collapsed and produced a significant quantity of debris and rubble piles (cf. top left image in Figure 4—UAV image-subset of the Mirabello church). The UAV images were captured at different heights, positions, and views (nadir and oblique) with a spatial resolution of 1–2 cm. The images of both regions corresponding to various orientations and heights were split into 100 ˆ 100 pixel rectangular image patches for framing of the training and testing datasets for the damage classification process. The patches are labeled as damage if at least 25% of their area represents damage evidences (debris/rubble or spalling) that are unambiguously recognizable by human analyst. For example, the samples of damaged and undamaged image patches of each dataset are shown to provide better insights (refer to Sections 3.1–3). Since the image resolution is very high, the defined rectangular patches cover only a small region (approximately 1 m2 ) and, therefore, most of them contain only either damage evidences or single homogenous object, i.e., the defined regions are mostly uncluttered; refer to the image training samples in Figure 4. In total 966 samples (482 damaged, 484 non-damaged) each of size 100 ˆ 100 pixels, were considered. The dataset was constructed by selecting the specific samples across different regions within the scene that highly vary in their characteristics to avoid a large number of repetitive samples. The damage classification was performed for this dataset based on different combinations of feature descriptors and learning algorithm as described above, and the results are reported in Table 3.
Remote Sens. 2016, 8, 231 Remote Sens. 2016, 8, 231
10 of 22 10 of 22
Figure 4. Samples of image patches in dataset 1—UAV images.
Figure 4. Samples of image patches in dataset 1—UAV images. Table 3. Performance of feature descriptors when associated with different learning algorithms for dataset 1 comprising patches from the UAV images (training samples = 676, testing Table 3. Performance of feature descriptors when associated with different learning algorithms samples = 290)—bold numbers indicate best performance per indicator. for dataset 1 comprising patches from the UAV images (training samples = 676, testing samples = 290)—bold numbers indicate best performance per indicator. SVM RF Adaboost Dataset1 SVM Accuracy Precision Recall RF Accuracy PrecisionAdaboost Recall Accuracy Dataset1 Precision Recall Precision Recall Accuracy Precision Recall Accuracy Precision Recall Accuracy Gabor 0.91 0.87 0.90 0.99 0.92 0.95 0.81 0.76 0.79 Gabor 0.92 0.95 0.81 0.76 0.79 HoG 0.87 0.91 0.86 0.87 0.860.90 0.940.99 0.93 0.93 0.71 0.67 0.69 HoG 0.93 0.93 0.71 0.67 0.69 BoW-Gabor 0.96 0.87 0.93 0.86 0.950.86 0.990.94 0.98 0.98 0.96 0.71 0.83 BoW-Gabor 0.98 0.96 0.97 0.93 0.980.95 0.98 0.98 0.96 0.71 0.83 BoW-HOG 0.970.99 0.95 0.95 0.95 0.87 0.90 BoW-SURF 0.900.97 0.88 0.90 0.80 0.81 0.81 BoW-HOG 0.97 0.98 0.92 0.97 0.940.98 0.87 0.90 0.95 0.95 0.95 BoW-SURF 0.97 0.92 0.94 0.90 0.88 0.90 0.80 0.81 0.81
3.2. Dataset 2: Oblique View Manned Aircraft Images 3.2. Dataset 2: Oblique View Manned Aircraft Images The airborne oblique images (Pictometry) with a Ground Sampling Distance (GSD) between 10 cm The airborne oblique images (Pictometry) with a Ground Sampling Distance (GSD) between 10 cm (foreground) and 16 cm (background) captured over Port-au-Prince after the 2010 Haiti earthquake (foreground) andThe 16 cm (background) captured over city, Port-au-Prince the 2010 Haiti earthquake were considered. images cover almost the entire and containafter numerous buildings ranging weresimple considered. The images cover almost the entire city,clustered and contain numerous buildings ranging from to complex. Most of the buildings are densely in such a way that it is difficult to from simpleeach to complex. the buildings areimages. denselyNumerous clustered buildings in such a way that it iscovered difficult differentiate buildingMost evenofvisually from the are partially to differentiate eachtall building even visually from ofthe Numerous arebuildings partially with densely leafed trees, adding to the clutter theimages. scene. A significantbuildings number of covered with ranging denselyfrom leafed tall trees, adding to thetoclutter the scene. A significant number of are damaged, complete/partial collapse heavyofspalling on the intact elements of the buildings(cf.are damaged, from complete/partial collapse to heavy spalling intact building Figure 5). Theranging images are split into 100 ˆ 100 pixel images/patches to frameon thethe training elements ofdatasets the building (cf.damage Figure 5). The imagesprocess. are splitThe intodefined 100 × 100 pixelpatches images/patches to and testing for the classification image are highly 2 frame theastraining anda testing datasets for10 the classification process. definedsuch image cluttered they cover large area (at least m damage ) and comprise different kindsThe of objects, as patches are highly cluttered theysections, cover a large area (at 10 m and dataset comprise different kindsby of trees, building elements, cars,asroad and debris (cf.least Figure 5).2) The was constructed objects, such as trees, building elements, cars, road sections, and debris (cf. Figure 5). The dataset was selecting the specific samples across different regions within the city that vary highly in terms of their constructed by selecting the specific samples across different regions within the city that vary highly
10
Remote RemoteSens. Sens.2016, 2016,8,8,231 231
1111ofof2222
in terms of their characteristics. Again, the selection of samples was driven by the idea of covering characteristics. Again, the selection of samples was up driven by the idea of covering different different damage characteristics rather than piling redundant information. In total 1256damage samples characteristics rather than piling up redundant information. In total 1256 samples (698 damaged, (698 damaged, 558 non-damaged) were selected and tested for the damage classification based on the 558 non-damaged) were tested for of the damage classification on theare developed developed approach. Theselected patchesand cover an area approximately 13,000 m2based . The results reported 2 . The results are reported in Table 4. approach. The patches cover an area of approximately 13,000 m in Table 4.
Figure 5. Samples of image patches in dataset 2, images © Pictometry.
Figure 5. Samples of image patches in dataset 2, images © Pictometry. Table 4. Performance of feature descriptors when associated with different learning algorithms for dataset 2, comprising patches from Pictometry images (training samples = 879, testing samples = 377). Table 4. Performance of feature descriptors when associated with different learning algorithms for dataset 2, comprising patches from Pictometry images (training samples = 879, testing SVM RF Adaboost samples = 377). Dataset2 Precision Recall Accuracy Precision Recall Accuracy Precision Recall Accuracy SVM RF Adaboost Gabor 0.76 0.79 0.82 0.76 0.79 0.78 0.61 0.72 Dataset2 0.81 Precision0.61 Recall Accuracy Precision Recall HoG 0.78 0.72 0.67 0.61 Accuracy 0.66 Precision 0.62 Recall 0.58Accuracy 0.63 Gabor 0.89 0.81 0.860.76 0.79 0.82 0.76 0.79 0.78 0.610.79 0.72 0.79 BoW-Gabor 0.88 0.88 0.88 0.88 0.80 HoG 0.93 0.78 0.890.61 0.72 0.67 0.61 0.66 0.62 0.580.69 0.63 0.75 BoW-HOG 0.91 0.85 0.83 0.84 0.80 BoW-Gabor0.91 0.89 0.890.86 0.88 0.88 0.88 0.80 0.790.78 0.79 0.80 0.88 BoW-SURF 0.90 0.84 0.82 0.83 0.80 BoW-HOG 0.93 0.89 0.91 0.80 0.85 0.83 0.84 0.69 0.75 BoW-SURF 0.89 0.80 0.80 0.91 0.90 0.84 0.82 0.83 0.78
3.3. Dataset 3: Street View Images
Street view close-range images of damaged buildings captured by hand-held cameras after 3.3. Dataset 3: Street View Images earthquakes in different geographic locations were used. These images were collected from two Street view close-range images of damaged buildings captured by hand-held cameras after sources: (1) Governmental organization: the German Federal Agency for Technical Relief, THW; earthquakes in different geographic locations were used. These images were collected from two (http://www.thw.de); and (2) the Internet (various websites). The collected images vary in scale; sources: (1) Governmental organization: the German Federal Agency for Technical Relief, THW; however, the actual scale is unknown. Therefore, the 100 ˆ 100 pixel patches generated from those (http://www.thw.de); and (2) the Internet (various websites). The collected images vary in scale; images may cover small areas (e.g., an element of the building) or large areas (e.g., entire or major however, the actual scale is unknown. Therefore, the 100 × 100 pixel patches generated from those portion of the building). The collected images contain buildings with various kinds of damages, such images may cover small areas (e.g., an element of the building) or large areas (e.g., entire or major
11
RemoteSens. Sens.2016, 2016,8,8,231 231 Remote
1212ofof2222
portion of the building). The collected images contain buildings with various kinds of damages, such as as complete complete collapse, collapse, partial partial collapse, collapse, inter-story inter-story collapse, collapse, and and heavy heavy spalling. spalling. In In total total 887 887samples samples (384 considered to to construct andand evaluate the the supervised model for (384damaged, damaged,503 503non-damaged) non-damaged)were were considered construct evaluate supervised model the classification. Sample image patches used forused the training testingand of the supervised for damage the damage classification. Sample image patches for theand training testing of the model are depicted in Figure 6. The results6.are in Table 5. in Table 5. supervised model are depicted in Figure Thereported results are reported
Figure 6. Samples of image patches in dataset 3: street view images. Figure 6. Samples of image patches in dataset 3: street view images. Table 5. Performance of feature descriptors when associated with different learning algorithms for Table 5. of feature associated different algorithms for dataset 3, Performance comprising patches fromdescriptors street viewwhen images (training with samples = 620,learning testing samples = 267). dataset 3, comprising patches from street view images (training samples = 620, testing samples = 267). SVM RF Adaboost Dataset 3 SVM RF Adaboost Accuracy Precision Recall Accuracy Precision Recall Accuracy Dataset 3 Precision Recall Gabor Gabor HoG BoW-Gabor HoG BoW-HOG BoW-Gabor BoW-SURF BoW-HOG
Precision
Recall
0.89 0.89 0.95 0.99 0.95 1.0 0.99 0.99
0.85 0.85 0.74 0.91 0.74 0.93 0.91 0.89
1.0
0.93
Accuracy
0.87 0.87 0.86 0.95 0.86 0.96 0.95 0.94 0.96
Precision
0.88 0.88 0.94 0.92 0.94 0.98 0.92 0.98
Recall
0.80 0.80 0.81 0.77 0.81 0.94 0.77 0.82
Accuracy
0.85 0.85 0.89 0.86 0.89 0.96 0.86 0.91
Precision
0.91 0.91 0.84 0.92 0.84 0.98 0.92 0.98
Recall
0.85 0.85 0.84 0.72 0.84 0.82 0.72 0.77
Accuracy
0.89
0.89 0.85
0.84 0.85 0.90
0.84 0.89
0.98
0.94
0.96
0.98
0.82
0.90
0.99 1, 2, 0.89 3.4.BoW-SURF Dataset 4: Datasets and 3 Are0.94 Combined 0.98
0.82
0.91
0.98
0.77
0.89
The samples from datasets 1, 2, and 3, which vary in scale, camera view, and platform and scene 3.4. Dataset 4: Datasets 1, 2, and 3 Are Combined complexity, were combined into a single dataset in order to assess the generalization capability of the Theclassification samples from datasetsIn1,total 2, and 3, which vary in damaged, scale, camera and platform and scene damage methods. 3109 samples (1564 1545view, non-damaged; subsequently complexity, were combined into a single dataset in order to assess the generalization capability the termed COM3109 ) were used to develop and test the supervised models for damage classification.ofThe damage classification methods. In total 3109 samples (1564 damaged, 1545 non-damaged; results are reported in Table 6. For visual analysis, an UAV image of dataset 1 and a Pictometry image subsequently termed COMfor 3109)the were used detection to develop and the testbest the performing supervised model models(BoW-Gabor for damage of dataset 2 were classified damage using classification. The results are reported in Table 6. For visual analysis, an UAV image of dataset 1 and with SVM). The classified images are depicted in Figure 7. The classification is quite accurate, showing a Pictometry image of dataset 2 were classified for the damage detection using the best performing only very few false positives and false negatives, which are also highlighted in the classified images model (BoW-Gabor with SVM). The depicted in Figure 7. The classification (cf. Figure 7). The false positives and classified negativesimages are the are examples where our assumption fails: i.e., ais quite accurate, showing only very few false positives and false negatives, which are also highlighted surface with unusual radiometric characteristics is assumed to be damaged, while manmade objects in the classified images (cf. Figure false positives and negatives areFor theexample, examplesinwhere are assumed to have a regular shape 7). andThe uniform radiometric characteristics. Figureour 7b assumption fails: i.e., a surface with unusual radiometric characteristics is assumed to be damaged, while manmade objects are assumed to have a regular shape and uniform radiometric characteristics.
12
Remote Sens. 2016, 231 Remote Sens. 2016, 8,8, 231
1313 of of 2222
For example, in Figure 7b the leaf-off tree was misdetected as damage, since it shows a strong the leaf-off tree waspattern. misdetected as damage, since it shows a strong irregular texture pattern. Similarly, irregular texture Similarly, the damaged regions are not detected as they show smooth the damaged regions are not detected as they show smooth texture. texture.
(a)
(b)
(c) Figure classificationof ofimages imagesbased based best performing supervised model: (a) UAV Figure7.7. Damage Damage classification onon best performing supervised model: (a) UAV image image of dataset 1 (left); detected damaged regions highlightedininred, red, and and the of dataset 1 (left); detected damaged regions arearehighlighted the false falsepositives positivesare are highlighted using yellow circles (right); (b) Subset of Pictometry image of dataset 2 (left); detected highlighted using yellow circles (right); (b) Subset of Pictometry image of dataset 2 (left); detected damaged damagedregions regionsare arehighlighted highlightedininred, red,and andthe thefalse falsepositives positivesand andfalse falsenegatives negativesare arehighlighted highlighted using yellow and green circles, respectively (right). Images © Pictometry; (c) Street view using yellow and green circles, respectively (right). Images © Pictometry; (c) Street viewimage imageofof dataset dataset3 3(left); (left);detected detecteddamaged damagedregions regionsare arehighlighted highlightedininred, red,and andthe thefalse falsepositives positivesand andfalse false negatives are highlighted using yellow and green circles, respectively (right). negatives are highlighted using yellow and green circles, respectively (right).
13
Remote Sens. 2016, 8, 231
14 of 22
Table 6. Performance of feature descriptors when associated with different learning algorithms for dataset 4 (COM3109 ) comprising patches from UAV, Pictometry, and street-view images (training samples = 2176, testing samples = 933). SVM
Dataset 4 Precision Gabor HoG BoW-Gabor BoW-HOG BoW-SURF
0.79 0.81 0.95 0.89 0.90
Recall 0.75 0.62 0.88 0.87 0.84
RF Accuracy Precision 0.77 0.73 0.91 0.88 0.87
0.76 0.79 0.93 0.83 0.83
Recall 0.64 0.64 0.79 0.76 0.77
Adaboost Accuracy Precision 0.72 0.71 0.86 0.80 0.80
0.62 0.71 0.64 0.80 0.79
Recall
Accuracy
0.58 0.57 0.68 0.64 0.75
0.62 0.61 0.67 0.74 0.77
4. Observations and Analysis For convenient analysis of the results, datasets 1 and 3, which were not cluttered and less affected by shadows and trees, are referred to as non-complex datasets, while datasets 2 and 4, where the image patches were mostly cluttered and severely affected by shadows and trees, are referred to as complex datasets. Also for convenience, the datasets are named based on the image characteristics and number of samples as described in Table 7. Table 7. Naming of datasets based on the image characteristics and number of samples. Dataset
Name
Description
Dataset 1 Dataset 2 Dataset 3
UAV966 PIC1256 SVI887
Dataset 4
COM3109
966 image patches generated from UAV images. 1256 image patches generated from Pictometry images. 887 image patches generated from street view images. Comprehensive dataset, where datasets 1, 2 & 3 are combined, containing 3109 image patches.
Scene Complexity Non-complex Complex Non-complex Complex
4.1. Global Representation of HoG and Gabor Wavelet for Damage Classification The results show that the global representations of HoG and Gabor wavelet feature descriptors have great potential to identify the damaged regions in the image, if the defined image patches are non-complex. For example, the supervised models constructed for UAV966 (non-complex) based on the global representation of Gabor wavelet and HoG features resulted in accuracies of 95% and 93%, respectively (Table 3). However, the same feature descriptors Gabor and HoG produced accuracies of 82% and 72%, respectively for PIC1256 (Table 4), where the defined image patches were mostly complex. Moreover, the same features Gabor and HoG produced highly inferior results for COM3109 , which was more complex than the other datasets (Table 6). This clearly indicates that the robustness of the global representation of HoG and Gabor features declines with an increase in image patch complexity. This is because in the global representation the radiometric characteristics of the complex region (e.g., clutter, shadows, and trees) resemble the radiometric characteristics of damaged regions, which are generally more non-uniform than radiometric patterns of non-damaged regions (cf. Figure 8). Consider an image patch that contains different objects with different dominant orientations. The global description of this image patch based on gradient orientation is the aggregation of all gradient orientation information within this patch. In such a case the image patch would seem to possess gradient orientations in many directions, which resembles the radiometric characteristics of damaged regions. For example, consider Figure 8a as an image patch that contains four different objects (annotated as A, B, C, and D) with different gradient orientation patterns. The gradient pattern derived locally for each object was overlaid on the corresponding object with a black background. These local patterns show that each object possesses dominant orientations that were more uniform. However, the global gradient pattern derived for the whole image patch was non-uniform and resembles the characteristics of damaged regions (cf. Figure 8a). Thus, it is difficult to classify an image patch based on global features in case it
(annotated as A, B, C, and D) with different gradient orientation patterns. The gradient pattern derived locally for each object was overlaid on the corresponding object with a black background. These local patterns show that each object possesses dominant orientations that were more uniform. However, the global gradient pattern derived for the whole image patch was non-uniform and Remote Sens. 2016, 8, 231 15 of 22 resembles the characteristics of damaged regions (cf. Figure 8a). Thus, it is difficult to classify an image patch based on global features in case it is cluttered. Also, trees and shadows possess irregular is cluttered. Also, trees and shadows possess irregular shapes and non-uniform gradient orientations, shapes and non-uniform orientations, which alsodamaged resemble the radiometric characteristics of which also resemble gradient the radiometric characteristics of the regions. Hence, global feature the damaged regions.damage Hence, global did feature descriptors-based classification descriptors-based classification not efficiently classify the imagedamage patches that were strongly did not affected by trees shadow. efficiently classify theand image patches that were strongly affected by trees and shadow.
(a) Local global gradientpattern pattern of patch that contains four objects Figure Figure 8. (a) 8. Local and and global gradient ofananimage image patch that contains fourwith objects with different dominant orientations; (b) gradient pattern of damaged regions. different dominant orientations; (b) gradient pattern of damaged regions.
4.2. BoW-Based Feature Representation for Damage Classification
4.2. BoW-Based Feature Representation for Damage Classification
The Gabor and HoG features produced superior results for all datasets when represented in a BoW framework than represented in conventional global scale for damage classification. The Gabor and HoG features produced superior results for all datasets whenAlthough represented in a the BoW approach produced superior results to the conventional approach, there was no significant BoW framework than represented in conventional global scale for damage classification. Although in the performance between them when the considered image regions were not complex, e.g., the BoWdifference approach produced superior results to the conventional approach, there was no significant UAV966 (cf. Table 3). However, in complex image regions there was a significant performance difference difference in the performance between them when the considered image regions were not complex, between the BoW and conventional feature representation. This is evident from the results for PIC1256 , e.g., UAV 966 (cf. Table 3). However, in complex image regions there wasand a significant performance where the BoW-based Gabor and HoG produced maximum accuracies of 88% 91%, respectively, which are 9% and than the accuracies obtained by those features when represented at the a results difference between the 19% BoWhigher and conventional feature representation. This is evident from global scale (cf. Table 4). This shows that BoW-based Gabor and HoG features are more robust to clutter, for PIC1256, where the BoW-based Gabor and HoG produced maximum accuracies of 88% and 91%, trees and shadows than when they are represented at a global scale. The following characteristics respectively, which are 9% and 19% higher than the accuracies obtained by those features when made the BoW approach more robust compared to the global representation: represented(1) atUnlike a global scale (cf. Table 4). This shows that BoW-based Gabor and HoG features are the global representation, the BoW approach does not aggregate the radiometric more robust clutter, trees patch. and shadows than when theypatch are based represented at a global patternstowithin the image Instead, it describes the image on the number of salientscale. The points, where each pointmade is described the local radiometricmore pattern robust derived from its neighborhood. following characteristics the byBoW approach compared to the global Therefore, in case of no damage, the image patch will be represented by points with a uniform representation: pattern (gradient orientation), even if the image patch contains objects with different (1)radiometric Unlike the global representation, the BoW approach does not aggregate the radiometric dominant orientations. On the other hand, if the image patch contains damage it will be represented patternsbywithin the image patch. Instead, it describes the image patch based on the number of salient the points with non-uniform gradient orientations. The final damage classification is performed by points, where each by the radiometric pattern derived frompatch. its neighborhood. analyzing the point patternisofdescribed the occurrences of local local radiometric patterns within the image This
Therefore, in case of no damage, the image patch will be represented by points with a uniform radiometric pattern (gradient orientation), even if the image patch contains objects with different dominant orientations. On the other hand, if the image patch contains damage it will be represented 15
Remote Sens. 2016, 8, 231
16 of 22
Remote Sens. 2016, 8, 231
16 of 22
by the points with non-uniform gradient orientations. The final damage classification is performed by analyzing the pattern of the occurrences of local radiometric patterns within the image patch. This eliminatesthe the ambiguity ambiguitycaused causedby bymixed mixedradiometric radiometricpattern patterntypical typicalfor forthe theglobal globalrepresentation, representation, eliminates making the BoW comparatively more robust. making the BoW comparatively more robust. (2) The The BoW BoW approach approach considers considers only only the the salient salient points pointsas asrepresentatives representatives to to describe describe the the image image (2) patch. The salient point selection method based on SURF mostly did not consider the pixels of shadows patch. The salient point selection method based on SURF mostly did not consider the pixels of and treesand as salient points. Figure 9a,b show 9a,b the strongest SURF points in the image, most shadows trees as salient points. Figure show the300 strongest 300 SURF points inwhere the image, of the detected are notpoints corresponding to trees and shadows. the BoW approach where most of points the detected are not corresponding to treesThus, and shadows. Thus, thelargely BoW eliminates the shadows and trees in the damage classification process, which was one the major approach largely eliminates the shadows and trees in the damage classification process,ofwhich was problems in the global descriptors-based damage classification. Moreover, the pixels corresponding to one of the major problems in the global descriptors-based damage classification. Moreover, the pixels the damaged regions were often detected as salient points, as they show a stronger gradient than other corresponding to the damaged regions were often detected as salient points, as they show a stronger objects (cf. Figure 9a). This ensures that theThis number of points corresponding to the corresponding damaged portion gradient than other objects (cf. Figure 9a). ensures that the number of points to willdamaged always beportion proportional to thebe number of points to the non-damaged even the will always proportional to corresponding the number of points correspondingobjects, to the nonif only a small portion the image patch is damaged (cf. Figure This specific characteristic of damaged objects, even of if only a small portion of the image patch9a,b). is damaged (cf. Figure 9a,b). This the SURF points made the BoW-based damage classification approach invariant to scale, clutter, and specific characteristic of the SURF points made the BoW-based damage classification approach scene complexity. invariant to scale, clutter, and scene complexity.
(a)
(b)
Figure 9. Detected SURF points are plotted on the image. (a) Strongest 300 SURF points among 4032 Figure 9. Detected SURF points are plotted on the image. (a) Strongest 300 SURF points among × 3024 pixels; (b) strongest 300 SURF points among 977 × 835 pixels. Images © Pictometry. 4032 ˆ 3024 pixels; (b) strongest 300 SURF points among 977 ˆ 835 pixels. Images © Pictometry.
4.3. Impact of Choice of Learning Algorithm 4.3. Impact of Choice of Learning Algorithm The results show that the choice of learning algorithm has a significant impact on damage The results show that the choice of learning algorithm has a significant impact on damage classification performance, since the feature descriptors performed differently for different datasets classification performance, since the feature descriptors performed differently for different datasets when associated with different learning algorithms. The accuracies produced by SVM, RF, and when associated with different learning algorithms. The accuracies produced by SVM, RF, and Adaboost for all datasets when they were associated with different feature descriptors are depicted Adaboost for all datasets when they were associated with different feature descriptors are depicted in Figure 10. The plot shows that (1) SVM and RF mostly outperformed Adaboost; (2) using the global in Figure 10. The plot shows that (1) SVM and RF mostly outperformed Adaboost; (2) using the feature descriptors the performances of RF and SVM varied with the datasets: RF produced superior global feature descriptors the performances of RF and SVM varied with the datasets: RF produced results compared to SVM for UAV966 and SVI887, whereas it produced inferior results than SVM for superior results compared to SVM for UAV966 and SVI887 , whereas it produced inferior results than PIC1256 and COM3109. This shows that the performance of the learning algorithm is highly dependent SVM for PIC1256 and COM3109 . This shows that the performance of the learning algorithm is highly on the characteristics of the datasets, with SVM performing well for complex datasets and RF dependent on the characteristics of the datasets, with SVM performing well for complex datasets performing well for non-complex dataset. However, using the BoW approach the SVM mostly and RF performing well for non-complex dataset. However, using the BoW approach the SVM outperformed RF in the classification for all datasets, irrespective of the feature descriptors (cf. Figure mostly outperformed RF in the classification for all datasets, irrespective of the feature descriptors 10). One overall conclusion from this is that the SVM-based, supervised models were more reliable (cf. Figure 10). One overall conclusion from this is that the SVM-based, supervised models were and mostly showed better generalization performance than RF, particularly for the complex datasets. more reliable and mostly showed better generalization performance than RF, particularly for the complex datasets.
16
Remote Sens. 2016, 8, 231 Remote Sens. 2016, 8, 231
17 of 22 17 of 22
Figure10. 10.The Theaccuracy accuracyproduced producedby bythe thefeature featuredescriptors descriptorsfor foreach eachdataset datasetwhen whenassociated associatedwith with Figure different classifiers. different classifiers.
Discussion 5.5. Discussion Theprimary primaryobjective objectiveofofthis thispaper paperwas wasto todevelop developaadamage damageclassification classificationmethod methodthat thatclassifies classifies The a given image patch as damaged or non-damaged, irrespective of scale, image characteristics, and a given image patch as damaged or non-damaged, irrespective of scale, image characteristics, and scene complexity. The damage classification method was developed by considering various feature scene complexity. The damage classification method was developed by considering various feature descriptors(HoG, (HoG,Gabor, Gabor,and andSURF), SURF),different differentfeature featuredescriptor descriptorrepresentations representations(Global (Globaland andBoW), BoW), descriptors different learning algorithms (SVM, RF, and Adaboost) and image datasets with different levels different learning algorithms (SVM, RF, and Adaboost) and image datasets with different levels ofof scaleand andscene scenecomplexity. complexity. was shown that feature representation a significant impact on scale It It was shown that thethe feature representation has has a significant impact on the the performance the damage classification compared to other components such descriptors as features performance of the of damage classification compared to other components such as features descriptors and learning algorithms. For all datasets, the BoW-based damage classification models and learning algorithms. For all datasets, the BoW-based damage classification models performed performed well for all combinations of feature descriptors andalgorithms, learning algorithms, to the well for all combinations of feature descriptors and learning comparedcompared to the models models developed based on global representation. Particularly, concerning COM 3109 (the developed based on global representation. Particularly, concerning COM3109 (the comprehensive comprehensive dataset), the accuracy obtained with the best-performing feature descriptor (Gabor) dataset), the accuracy obtained with the best-performing feature descriptor (Gabor) and learning and learning algorithm (SVM) with the global representation improved 14% (from when 77% totested 91%), algorithm (SVM) with the global representation improved by 14% (from by 77% to 91%), when tested with the BoW representation (cf. Table 6). The choice of learning algorithm was found with the BoW representation (cf. Table 6). The choice of learning algorithm was found to be theto be the significant second significant in the performance of theclassification damage classification the SVM second factor in factor the performance of the damage model: themodel: SVM produced produced significantly results RF and all feature descriptors in the BoW significantly better resultsbetter than RF and than Adaboost for Adaboost all feature for descriptors in the BoW representation representation (cf. Table 6). The considered feature descriptors performed equally well hence, (cf. Table 6). The considered feature descriptors performed equally well and, hence, theand, choice of the choice of feature was least found to have impact on the of Gabor the model. The feature descriptor wasdescriptor found to have impact on least the performance of performance the model. The features Gabor features ledimprovement to a 3% andin4% improvement intoaccuracy to HoG and SURF, led to a 3% and 4% accuracy compared HoG andcompared SURF, respectively, when the respectively, when the image patches were classified with SVM in the BoW framework. This small image patches were classified with SVM in the BoW framework. This small improvement also may be improvement also may be due to the additional information that Gabor features possess compared to HoG. For example, in Gabor, the gradient orientations information is extracted based on five 17
Remote Sens. 2016, 8, 231
18 of 22
due to the additional information that Gabor features possess compared to HoG. For example, in Gabor, the gradient orientations information is extracted based on five different frequency scales, whereas in HoG the gradient orientation information is extracted at only one frequency scale (cf. Section 2.1.1). However, these improvements are significantly more modest when compared to the 14% improvement in accuracy between BoW and global representation (cf. Table 6). This highlights the importance of feature representation, regardless of the potential of features. Overall, SVM associated with Gabor feature descriptors in the BoW framework was found to produce the most robust and generalized damage classification model. Even visually, the damage classification was found to be more accurate when the images of different scales, camera views, and capturing platforms, and different levels of scene complexity, were classified by the best performing model (cf. Figure 7). Shadowed areas continue to pose a major problem in damage classification. Since the damaged regions covered by shadows show low contrast, they were not detected by our BoW-based approach (no SURF points in those areas). However, it is important to identify the damages in low-contrast regions as well; therefore, further tuning of the methods or identifying the optimal strategy that can make our approach work even in low contrast regions is required to increase the robustness of the model. The BoW framework consists of various components such as feature descriptors, learning algorithms, and the visual word dictionary construction. The algorithms used for each component are associated with a number of parameters (cf. Table 1). The performance of the BoW-based damage classification model might be further improved by tuning the parameters of the algorithm or modifying/replacing the algorithm of the specific component. For example, the iterative k-means clustering was used to construct the visual word dictionary, whereas other feature encoding methods such as auto-encoders (e.g., Vincent et al. [51]), which encode the features differently compared to k-means, may produce a better visual word dictionary and thereby can potentially improve the performance of the model as well. Concerning the feature descriptors, all three-feature descriptors were used independently to construct the damage classification models, whereas the combined use of feature descriptors may also improve the performance of our model. Similarly, concerning the learning algorithm we used a single kernel-based SVM for constructing the damage classification model, whereas the multiple-kernel (e.g., Bucak et al. [52]) based learning may improve the performance of the model as well. We did not attempt to fine-tune the model by exploring all those possible approaches, because the principal focus of this paper was to analyze the potential of the BoW framework in damage classification. The developed method can identify the damages related to debris/rubble piles that are strong indicators of building collapse or severe structural damage, which would be very useful for first responders involved in disaster response, but also other stakeholders such as governmental agencies assessing post-disaster construction needs, or insurance companies. However, for detailed building level damage assessment, this evidence alone is not sufficient to infer the complete damage state of the building, nor the total damage cost, as the latter also depends on internal (invisible) damage, and on building functions being affected, which is not always visible. However, along with other damage evidences such as cracks, inclined elements, etc., this evidence is also important in the damage classification process. From a practical point of view, especially, the observations we made using the combined dataset 4 (COM3109 ) are very interesting. Although the used patches vary significantly in terms of scale and complexity, an overall accuracy of around 90% was reached (cf. Table 6). Transferred to an actual disaster scenario, where quick interpretation of image data is needed, this would mean that an already existing database can be used to train a model and new images can be readily classified, and a similar overall accuracy might be expected. Hence, at least for a first damage assessment, the tedious manual referencing might not be necessary. 6. Conclusions and Outlook A damage classification based on BoW was developed to classify a given image patch as damaged or non-damaged, irrespective of scale, image characteristics, and scene complexity. Various
Remote Sens. 2016, 8, 231
19 of 22
combinations of image features (Gabor wavelets, HoG, and SURF) and supervised classifiers (SVM, RF, and Adaboost) are tested in both the BoW framework and conventional global feature representation approach using four different datasets. The BoW framework outperformed conventional global feature representation approaches in all scenarios (i.e., for all combinations of feature descriptors, classifiers, and datasets) and produced an average accuracy of approximately 90%. Although the developed model can identify the damaged regions in the images well, it cannot classify the detected damaged regions into specific types, such as debris, rubble piles, spalling, and inter-story collapse. We need contextual information and 3D geometric features such as shape, location, characteristics of the neighboring elements, and local height variation of the damaged region to identify the actual category of damage. For example, the damage patterns on large intact planar elements could be classified as spalling, whereas the damage pattern on the ground with large local height variations and no large 3D segments could be classified as debris. Therefore, the potential extension of this work will be the development of methods for classification of the detected damaged regions into actual damage categories. As stated earlier, the feature descriptor component in the BoW framework has a significant impact on the performance of the model. Here, the texture features are chosen to examine our BoW framework as their potential in damage detection has been demonstrated well by previous studies, as highlighted in the Introduction. However, recent studies report that supervised feature learning methods such as convolutional neural networks (CNN) could learn the feature and its representation directly from the image pixel values chosen for a specific application [53]. Hence, these features are referred to as data-adaptive features and are found to be superior to well-proven handcrafted features such as Gabor and HoG for many computer vison applications including image classification [54,55]. Therefore, we intend to explore the potential of CNNs for damage classification in the future. Acknowledgments: This work was funded by the EU-FP7 project RECONASS (Reconstruction and Recovery Planning: Rapid and Continuously Updated Construction Damage and Related Needs Assessment; grant no 312718). We thank Pictometry, Inc. for providing the imagery used in this study. Author Contributions: Anand Vetrivel and Markus Gerke conceived the design and implementation of the method and wrote the manuscript. Norman Kerle and George Vosselman helped to improve the method and experiments, and also reviewed and improved the manuscript structure and writing. Conflicts of Interest: The authors declare no conflict of interest.
References 1. 2. 3. 4. 5. 6. 7.
8.
Dong, L.; Shan, J. A comprehensive review of earthquake-induced building damage detection with remote sensing techniques. ISPRS J. Photogramm. Remote Sens. 2013, 84, 85–99. [CrossRef] Dell’Acqua, F.; Gamba, P. Remote sensing and earthquake damage assessment: Experiences, limits, and perspectives. IEEE Proc. 2012, 100, 2876–2890. [CrossRef] Adams, S.M.; Levitan, M.L.; Friedland, C.J. High resolution imagery collection utilizing unmanned aerial vehicles (UAVs) for post-disaster studies. Adv. Hurric. Eng. 2012. [CrossRef] Gerke, M.; Kerle, N. Automatic structural seismic damage assessment with airborne oblique pictometry imagery. Photogramm. Eng. Remote Sens. 2011, 77, 885–898. [CrossRef] Li, P.; Xu, H.; Guo, J. Urban building damage detection from very high resolution imagery using OCSVM and spatial features. Int. J. Remote Sens. 2010, 31, 3393–3409. [CrossRef] Gerke, M. Supervised classification of multiple view images in object space for seismic damage assessment. In Photosgrammetric Image Analysis; Springer: Berlin, Germany, 2011; pp. 221–232. Fernandez Galarreta, J.; Kerle, N.; Gerke, M. UAV-based urban structural damage assessment using object-based image analysis and semantic reasoning. Nat. Hazards Earth Syst. Sci. 2015, 15, 1087–1101. [CrossRef] Kerle, N.; Hoffman, R.R. Collaborative damage mapping for emergency response: The role of Cognitive Systems Engineering. Nat. Hazards Earth Syst. Sci. 2013, 13, 97–113. [CrossRef]
Remote Sens. 2016, 8, 231
9.
10. 11.
12. 13. 14.
15. 16. 17. 18. 19. 20. 21. 22.
23.
24. 25.
26. 27. 28.
29. 30.
20 of 22
Kaya, G.T.; Ersoy, O.K.; Kamasak, M.E. Spectral and spatial classification of earthquake images by support vector selection and adaptation. In Proceedings of the 2010 International Conference of Soft Computing and Pattern Recsognition (SoCPaR), Paris, France, 7–10 December 2010; pp. 194–197. Miura, H.; Midorikawa, S.; Kerle, N. Detection of building damage areas of the 2006 Central Java, Indonesia, earthquake through digital analysis of optical satellite images. Earthq. Spectra 2013, 29, 453–473. [CrossRef] Xiaoshuang, M.; Huanfeng, S.; Jie, Y.; Liangpei, Z.; Pingxiang, L. Polarimetric-spatial classification of SAR images based on the fusion of multiple classifiers. IEEE J. Sel. Top. Appl. Earth Obs. Remote Sens. 2014, 7, 961–971. [CrossRef] Jin, Y.; Ruan, Q.Q. Face recognition using Gabor-based improved supervised locality preserving projections. Comput. Inf. 2012, 28, 81–95. Zhang, J.; Marszałek, M.; Lazebnik, S.; Schmid, C. Local features and kernels for classification of texture and object categories: A comprehensive study. Int. J. Comput. Vis. 2007, 73, 213–238. [CrossRef] Yang, J.; Yu, K.; Gong, Y.; Huang, T. Linear spatial pyramid matching using sparse coding for image classification. In Proceedings of the IEEE Conference on Computer Vision and Pattern Recognition (CVPR), Miami, FL, USA, 20–26 June 2009; pp. 1794–1801. Di, H.; Chao, Z.; Yunhong, W.; Liming, C. HSOG: A novel local image descriptor based on histograms of the second-order gradients. IEEE Trans. Image Process. 2014, 23, 4680–4695. Oliva, A.; Torralba, A. Building the gist of a scene: The role of global image features in recognition. Prog. Brain Res. 2006, 155, 23–36. [PubMed] Carneiro, G.; Jepson, A.D. The quantitative characterization of the distinctiveness and robustness of local image descriptors. Image Vis. Comput. 2009, 27, 1143–1156. [CrossRef] Zuo, Y.; Zhang, B. Robust hierarchical framework for image classification via sparse representation. Tsinghua Sci. Technol. 2011, 16, 13–21. [CrossRef] Lou, X.; Huang, D.; Fan, L.; Xu, A. An image classification algorithm based on bag of visual words and multi-kernel learning. J. Multimed. 2014, 9, 269–277. [CrossRef] Ferraz, C.T.; Pereira, O.; Rosa, M.V.; Gonzaga, A. Object recognition based on bag of features and a new local pattern descriptor. Int. J. Pattern Recognit. Artif. Intell. 2014, 28, 1–32. [CrossRef] Lu, Z.; Wang, L. Learning descriptive visual representation for image classification and annotation. Pattern Recognit. 2015, 48, 498–508. [CrossRef] Zhuang, X.; Wu, S.; Natarajan, P. Compact bag-of-words visual representation for effective linear classification. In Proceedings of the 21st ACM International Conference on Multimedia, Barcelona, Spain, 21–25 October 2013; pp. 521–524. Wu, Z.; Ke, Q.; Sun, J.; Shum, H.Y. A multi-sample, multi-tree approach to bag-of-words image representation for image retrieval. In Proceedings of the 12th IEEE International Conference on Computer Vision, Kyoto, Japan, 29 September–2 October 2009; pp. 1992–1999. Wang, Y.; Mori, G. Human action recognition by semilatent topic models. IEEE Trans. Pattern Anal. Mach. Intell. 2009, 31, 1762–1774. [CrossRef] [PubMed] Zisheng, L.; Imai, J.; Kaneko, M. Face and expression recognition based on bag of words method considering holistic and local image features. In Proceedings of the International Symposium on Communications and Information Technologies (ISCIT), Tokyo, Japan, 26–29 October 2010; pp. 1–6. Peng, Y.; Doermann, D. No-reference image quality assessment using visual codebooks. IEEE Trans. Image Process. 2012, 21, 3129–3138. [CrossRef] [PubMed] Bouslimi, R.; Messaoudi, A.; Akaichi, J. Using a bag of words for automatic medical image annotation with a latent semantic. Int. J. Artif. Intel. Appl. 2013, 4, 51–61. [CrossRef] Ma, J.; Qin, S. Automatic depicting algorithm of earthquake collapsed buildings with airborne high resolution image. In Proceedings of the IEEE Geoscience and Remote Sensing Symposium (IGARSS), Munich, Germany, 22–27 July 2012; pp. 939–942. Radhika, S.; Tamura, Y.; Matsui, M. Use of post-storm images for automated tornado-borne debris path identification using texture-wavelet analysis. J. Wind Eng. Ind. Aerodyn. 2012, 107, 202–213. [CrossRef] Yamazaki, F.; Matsuoka, M. Remote sensing technologies in post-disaster damage assessment. J. Earthq. Tsunami 2007, 1, 193–210. [CrossRef]
Remote Sens. 2016, 8, 231
31.
32. 33. 34. 35.
36.
37.
38.
39. 40. 41.
42. 43. 44. 45. 46.
47. 48. 49.
50. 51.
52.
21 of 22
Reinartz, P.; Jiaojiao, T.; Nielsen, A.A. Building damage assessment after the earthquake in Haiti using two post-event satellite stereo imagery and DSMs. In Proceedings of the 2013 Joint Urban Remote Sensing Event (JURSE), Sao Paulo, Brazil, 21–23 April 2013; pp. 57–60. Sui, H.; Tu, J.; Song, Z.; Li, Q. A novel 3D building damage detection method using multiple overlapping UAV images. ISPRS-Int. Arch. Photogramm. Remote Sens. Spat. Inf. Sci. 2014, 40, 173–179. [CrossRef] Stavrakoudis, D.; Theocharis, J.; Zalidis, G. A boosted genetic fuzzy classifier for land cover classification of remote sensing imagery. ISPRS J. Photogramm. Remote Sens. 2011, 66, 529–544. [CrossRef] Conde, C.; Moctezuma, D.; Martín De Diego, I.; Cabello, E. HoGG: Gabor and HoG-based human detection for surveillance in non-controlled environments. Neurocomputing 2013, 100, 19–30. [CrossRef] Yuanqing, L.; Fengjun, L.; Shenghuo, Z.; Ming, Y.; Cour, T.; Kai, Y.; Liangliang, C.; Huang, T. Large-scale image classification: Fast feature extraction and SVM training. In Proceedings of the IEEE Conference on Computer Vision and Pattern Recognition (CVPR), Providence, RI, USA, 20–25 June 2011; pp. 1689–1696. Khan, N.Y.; McCane, B.; Wyvill, G. SIFT and SURF performance evaluation against various image deformations on benchmark dataset. In Proceedings of the International Conference on Digital Image Computing Techniques and Applications (DICTA), Noosa, QLD, Australia, 6–8 December 2011; pp. 501–506. Vetrivel, A.; Gerke, M.; Kerle, N.; Vosselman, G. Identification of damage in buildings based on gaps in 3D point clouds from very high resolution oblique airborne images. ISPRS J. Photogramm. Remote Sens. 2015, 105, 61–78. [CrossRef] Dalal, N.; Triggs, B. Histograms of oriented gradients for human detection. In Proceedings of the IEEE Computer Society Conference on Computer Vision and Pattern Recognition (CVPR), San Diego, CA, USA, 25–25 June 2005; 2005; pp. 886–893. Déniz, O.; Bueno, G.; Salido, J.; De la Torre, F. Face recognition using histograms of oriented gradients. Pattern Recognit. Lett. 2011, 32, 1598–1603. [CrossRef] Arivazhagan, S.; Ganesan, L.; Priyal, S.P. Texture classification using Gabor wavelets based rotation invariant features. Pattern Recognit. Lett. 2006, 27, 1976–1982. [CrossRef] Jun, Y.; Fei, S. Histogram of log-gabor magnitude patterns for face recognition. In Proceedings of the IEEE International Conference on Acoustics, Speech and Signal Processing (ICASSP), Florence, Italy, 4–9 May 2014; pp. 519–523. Schölkopf, B.; Smola, A.J. Learning with Kernels: Support Vector Machines, Regularization, Optimization, and Beyond (Adaptive Computation and Machine Learning); MIT Press: Cambridge, MA, USA, 2001. Breiman, L. Random forests. Mach. Learn. 2001, 45, 5–32. [CrossRef] Rätsch, G.; Onoda, T.; Müller, K.R. Soft margins for AdaBoost. Mach. Learn. 2001, 42, 287–320. [CrossRef] Bergstra, J.; Bengio, Y. Random search for hyper-parameter optimization. J. Mach. Learn. Res. 2012, 13, 281–305. Bergstra, J.; Bardenet, R.; Bengio, Y.; Kégl, B. Algorithms for Hyper-Parameter Optimization. Available online: http://papers.nips.cc/paper/4443-algorithms-for-hyper-parameter-optimization.pdf (accessed on 22 December 2015). Bay, H.; Tuytelaars, T.; Van Gool, L. Surf: Speeded up robust features. In Computer Vision—ECCV 2006; Springer: Berlin, Germany, 2006; pp. 404–417. Tsai, C.-F. Bag-of-words representation in image annotation: A review. ISRN Artif. Intell. 2012, 2012. [CrossRef] Peng, X.; Peng, Q.; Qiao, Y.; Chen, J.; Afzal, M. A Study on Unsupervised Dictionary Learning and Feature Encoding for Action Classification. Available online: http://arxiv.org/abs/1309.0309 (accessed on 22 December 2015). Vattani, A. K-means requires exponentially many iterations even in the plane. Discrete Comput. Geom. 2011, 45, 596–616. [CrossRef] Vincent, P.; Larochelle, H.; Lajoie, I.; Bengio, Y.; Manzagol, P.-A. Stacked denoising autoencoders: Learning useful representations in a deep network with a local denoising criterion. J. Mach. Learn. Res. 2010, 11, 3371–3408. Bucak, S.S.; Jin, R.; Jain, A.K. Multiple kernel learning for visual object recognition: A review. IEEE Trans. Pattern Anal. Mach. Intell. 2014, 36, 1354–1369. [PubMed]
Remote Sens. 2016, 8, 231
53.
54.
55.
22 of 22
Szegedy, C.; Liu, W.; Jia, Y.; Sermanet, P.; Reed, S.; Anguelov, D.; Erhan, D.; Vanhoucke, V.; Rabinovich, A. Going deeper with convolutions. In Proceedings of the IEEE Conference on Computer Vision and Pattern Recognition, Boston, MA, USA, 8–10 June 2015; pp. 1–9. Karpathy, A.; Toderici, G.; Shetty, S.; Leung, T.; Sukthankar, R.; Fei-Fei, L. Large-scale video classification with convolutional neural networks. In Proceedings of the 2014 IEEE Conference on Computer Vision and Pattern Recognition, Columbus, OH, USA, 23–28 June 2014; pp. 1725–1732. Zuo, Z.; Wang, G.; Shuai, B.; Zhao, L.; Yang, Q.; Jiang, X. Learning discriminative and shareable features for scene classification. In Computer Vision–ECCV 2014; Springer: Berlin, Germany, 2014; pp. 552–568. © 2016 by the authors; licensee MDPI, Basel, Switzerland. This article is an open access article distributed under the terms and conditions of the Creative Commons by Attribution (CC-BY) license (http://creativecommons.org/licenses/by/4.0/).