This paper presents a first report from a long- term collaborative programme between Matrix. Polymers Limited and the Manchester. Metropolitan University.
REMOVING THE MYSTERY FROM ROTOMOULDING: New insights into the physiochemical processes involved leading to improved quality control NG Henwood, MA Roberts, A Quaratino, S Collins (Matrix Polymers Limited, Northampton, UK), P Sharifi, C Liauw, and GC Lees (Dalton Research Institute, Manchester Metropolitan University, Manchester, UK) Abstract This paper presents a first report from a longterm collaborative programme between Matrix Polymers Limited and the Manchester Metropolitan University. The purpose of the programme is to examine physiochemical mechanisms of the rotational moulding process using a variety of analytical techniques. The effect on the performance of polyethylene (PE) caused by variation of the rotomoulding cooking cycle is investigated using a combination of infrared spectroscopy and melt rheology. Analytical results are correlated with large scale performance characteristics, measured by established industrial assessment techniques such as low temperature impact strength, brittleness, part density development and yellowness index.
Introduction Rotational moulding, or rotomoulding, is a well-established process for the manufacture of large, hollow items. It differs from other types of plastic processing in a number of important ways: •
•
•
Rotomoulding is characterised by an absence of shear in the melt phase of the process. This means that many potential rotomoulding materials cannot be used because their viscosity characteristics do not lend themselves to what is essentially a sintering process that takes place under atmospheric pressure. The cooking cycle, during which the material enters a melt phase, tends to be of relatively long duration - typically >20 min in an industrial rotomoulding situation. This creates a relatively harsh environment and the possibility of severe degradation of the polymer. The apparent simplicity of rotomoulding belies a process of significant complexity and many process variables (eg the effect of ambient conditions) can be difficult to control.
Over the past two decades, significant progress has been made in characterising the two process stages of the rotomoulding process, cooking and cooling. Much of the previous work has concentrated on investigating the process at a macroscopic level. In this paper we seek to extend our existing knowledge base, by examining the process and its effects on the polymer being moulded at a more microscopic level. The results from industrial material characterisation techniques have been compared to those obtained from laboratory based polymer analysis methods.
Materials and Experimental Methods Material Tested The material tested was a widely available European roto grade of polyethylene (PE) from Matrix Polymers, Revolve® N-307. This is a linear medium density polyethylene (LMDPE), typically used for tanks and large mouldings, with the following basic specification: Melt Flow Rate (MFR): Density: Catalyst Type: Reactor Type: Comonomer Type: Powder Specification: Stabilisation:
3.5 g/10 min 0.939 g/cm3 Ziegler-Natta Unipol Gas Phase Hex-1-ene Standard 500 µm Full heat and UV
Material Characterisation Techniques Material characterisation techniques are used to show, on a macroscopic scale, the effects of process variables on final product performance. Current techniques are particularly useful as a method of comparing the performance of different grades of LMDPE. Of particular reference to the current work, the effects of cooking time on the impact strength of the final product can be tracked, along with the failure mode of the sample, whether brittle or ductile [1]. Typically, a series of mouldings are made at a standard oven temperature and with varying cook times. Sample plaques cut from the mouldings (approx. 20) are
ANTEC 2005 / 1003
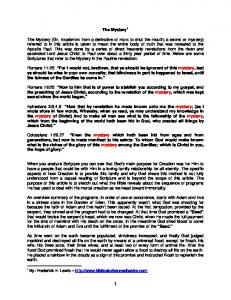
conditioned at –40ºC and then tested using a drop dart impact test established by the Association of Rotational Molders International [2]. The mode of failure of samples is examined and failed samples are classified as either brittle or ductile. In practice, the failure type is easy to determine visually (see Figure 1). A brittleness failure criterion is defined as follows: Brittle Failure Criterion (%BF) =100 x number of brittle failures total number of failures
(1)
The %BF provides a useful empirical definition of the processing window for a particular rotomoulding product, which can be defined as the range of cook times where the %BF is less than 20%. Samples from characterisation tests can also be evaluated for part density and yellowness. These parameters, tracked against cook time, can give valuable additional insights into the state of cure of the materials being rotomoulded. Part density was measured using a balance set up to weigh a small sample both in air and submerged in water. Yellowness was evaluated using a visible light spectrophotometer and expressed numerically as an index, YIE. Rotomoulded samples were made on a Ferry Rotospeed™ RS2-190 industrial sized rotomoulding machine, using two identical fabricated steel hexagon test moulds. Shot weight was 1.25 kg of powder for each mould, which produced mouldings of wall thickness 3 mm.
Analytical Techniques An infrared microscope (Nicolet Continuum with silicon ATR objective) was used to detect the presence of non-volatile carbonyl degradation species in sample plaques cut from the rotomoulded samples. All spectra were ATR corrected to compensate for the effect of wavelength on penetration depth. The viscosity of polyethylene samples taken from rotomoulded plaques was investigated using a Physica MCR300 oscillatory rheometer.
1004 / ANTEC 2005
Results and Discussion Material Characterisation Figure 2 is a plot of low temperature impact strength vs. cook time. It can be seen that, as cook time is increased, there is a progressive development of impact strength. The Peak Inner Air Temperature (PIAT) inside the mould is superimposed on the impact strength plot to serve as a cross-reference to the degree of cure. The concept of measuring PIAT has become well established in rotomoulding [3]; it has been demonstrated that, for PE roto grades, a PIAT of between 190ºC and 200ºC is indicative of optimum processing conditions. It will be seen that, on this basis, optimum cure has occurred at approx. 14 min in this case. In a seriously under-cured state (in this case, below 9 min cook time) very little impact strength can be developed because a full sinter has not been achieved. Above 9 min the impact strength rises and at optimum conditions an impact strength of approx. 100J has been achieved. As the processing conditions go into over-cook (above 15 min, above 200ºC PIAT) the impact strength continues to rise until, at 17 min cook, the impact strength drops rapidly. This behaviour is typical of materials of this type; there is a definite “hump” after optimum cure before catastrophic loss of properties occurs. The behaviour described above is further demonstrated in a plot of %BF vs. cook time. This is illustrated in Figure 3. It can be seen that samples fail in a wholly brittle fashion in both under- and over-cured states, in this case below 12 min and above17 min. In both cases, the change of failure mode is easy to see and, for this reason, %BF is a superior indicator of the processing “window” for the material being tested. Long experience of this type of testing shows that it is an excellent way of demonstrating how easy a particular PE roto grade will be to mould consistently in an industrial environment. Grades with wide processing windows will find favour in a practical moulding situation because there will be good retention of properties over a range of conditions. Figure 4 illustrates the variation of part density with cook time. Below 14 min the density of the part is reduced by the presence within the wall structure of gas bubbles. The bubbles are remnants of incomplete sintering. In the initial stages of cooking, bubbles of air are trapped between the interstices of the powder particles as they lay down and melt on to the mould surface. Given sufficient time at an elevated temperature, the gases within these bubbles will dissolve into the polymer melt.
Figure 4 also shows how yellowness index, (YIE), varies with cook time. Once optimum cure is achieved, the YIE starts to rise. This increase in YIE is mainly due to transformation of the primary antioxidant into quinone methides [4] that have light absorption characteristics that give a yellow colour.
the important role of oxygen in the degradation process for PE.
Infrared Spectroscopy Studies
Rheological Evaluation
Infrared spectroscopy was used to further study the processes of degradation indicated by the increase of YIE as cook time increases. A range of chemical species is formed during the thermal oxidative degradation of PE. These are mostly alcohols and ketones, together with small amounts of carboxylic acids and aldehydes; the carbonyl species absorb from 1700 – 1750 cm-1 [5, 6]. In order to evaluate the presence of degradation species, plaques cut from the walls of mouldings prepared at different cook times were examined by IR spectroscopy. Both the side of the plaque in contact with the mould surface (the mould side) and the opposite side in contact with air (the airside) were examined. A typical IR-spectrum for PE is given in Figure 8 and shows characteristic C-H stretching and deformation absorptions at 2919 cm-1, 2851 cm-1and 1463cm-1. At 20 minutes cook time the airside of the rotomoulded plaques yielded substantial carbonyl species, whereas reduced cook times afforded much reduced carbonyl growth. Equivalent data for the mould side showed insignificant carbonyl development, even at long cook times. The relative amounts of non-volatile carbonyl species were quantified by measuring the carbonyl index (CI) [6] using the C-H stretching absorptions as an internal standard. Peak area rather than absorbance was used in order to accommodate the range of carbonyl species formed. Figure 5 shows a plot of CI vs. cook time, for both the airside and the mould side of the sample plaques, superimposed on the earlier plot relating to YIE. This clearly illustrates that the observed initial rise in YIE (approx. 14 – 17 min cook time) is not due to the presence of carbonyl species. This indicates that PE oxidation only commences when stabiliser breakdown has reached a critical level. The plot also illustrates that degradation species are far more prevalent on the airside of overcooked mouldings than on the mould side. This confirms
Figure 6 further illustrates the effect by comparing impact strength and CI (airside) vs. cook time. The coincidence between loss of properties and increase in CI is clearly demonstrated. A typical rheometer frequency sweep is a plot of complex viscosity (η*) against angular frequency (ω). Small samples of material for rheological evaluation were obtained by shaving the mould side and airside of moulded plaques. Figure 7 shows frequency sweeps for mould side and airside at 13 min and 18 min cook times. The sweeps for mould side samples at both cook times and airside at the lower cook time virtually coincide. They exhibit visco-elastic behaviour typical of a semi-crystalline material such as PE. The sweep for airside at higher cook time exhibits an entirely different type of behaviour; there is no viscous component. This type of curve is typical of a crosslinked material.
Conclusions This investigation has successfully unified standard industrial material characterisation techniques with laboratory evaluation methods. Undercooked mouldings (PIAT < 190ºC) exhibit reduced density due to the presence of entrapped air bubbles, have high brittleness and underdeveloped impact strength. Optimally cooked mouldings develop a satisfactory level of impact strength and fail in ductile mode. The full development of their part density is another sign of adequate cure. The onset of over-cure can be identified in a number of ways. Sample plaques will continue to fail in a ductile mode, provided the material is well stabilised. The first sign of over-cure is an increase in YIE in the sample plaques. Further overcure results in PE oxidation as manifested by an increase in CI on the airside of the plaque. The CI in material on the mould side of sample plaques shows a relatively modest rise, even in conditions of severe overcook. In the later stages of overcook, rheological data indicates that the material on the airside becomes crosslinked
ANTEC 2005 / 1005
At the onset of overcook, the crosslinking of the material on the airside of the moulding increases the impact strength up to a maximum. However, with increasing overcook, chemical changes in the PE structure reduce its ability to absorb kinetic energy, causing a catastrophic loss of impact strength. Further investigations examining stabiliser consumption and changes in crystal structure of the PE are being currently being carried out and will be published soon.
Acknowledgements The work described in this paper is part of a long-term research project being carried out jointly by Manchester Metropolitan University (Manchester, UK) and Matrix Polymers Limited (Northampton, UK). The authors would like to thank Revolve® Group Limited for their permission to publish this paper.
Figure 1 140
300
PIAT
120
250
100
200
80 150 60
® Trademark of Revolve Group Limited ™ Trademark of Ferry Industries, Inc.
Impact
40
100 50
20 0
References
0 8
9
10
11
12
13
14
15
16
17
Cook Time (min)
1. 2. 3. 4. 5. 6.
st
Henwood, N.G., Proc., ARM 21 Fall Meeting, 1996. Association of Rotational Molders International, Low Temperature Impact Test Method. Crawford, RJ et al, Proc., BPF Rotomoulders’ Conference, 1991. PP Klemchuk, PL Horng, Polym. Degrad. Stability, 1991, 34, 333. F Gugamus, Polym. Degrad. Stability, 2002, 77, 147.F Gugamus, Polym. Degrad. Stability, 2002, 77, 147. N.Grassie G. Scott, Polymer Degradation and stabilisation, Cambridge, 1985.
Key Words Rotomoulding, polyethylene, degradation, rheometry
1006 / ANTEC 2005
Figure 2
18
19
20
21
22
140
100
120
80
100
0.4 CI-MS
Impact
0.3
%BF
80
60
0.2
60
40
40
20
Carbonyl Index
120
0.1
20 0 8
0
9 10 11 12 13 14 15 16 17 18 19 20 21 22
0 8 9 10 11 12 13 14 15 16 17 18 19 20 21 22 Cook time (min)
Cook time (min)
Figure 3
Figure 6 10
30
0.950 0.940
Pa·s
25
Density
20 15
0.920
10
YIE
0.910
10
4
YIE
0.930
5
|η*| 10
3
5
0.900
0 8
9 10 11 12 13 14 15 16 17 18 19 20 21 22
10
cook time (min)
2
0.1
1 Angular Frequency ω
10
1/s
100
Figure 7
Figure 4 0.35
30
20
0.25 0.2
15
0.15
10
0.1
5
YIE
CI-MS
0
CI
CI-AS
Absorbance
0.3
25
0.05 0
8 9 10 11 12 13 14 15 16 17 18 19 20 21 22
cook time
Figure 5
3000
2000
1000
Wave Number (cm-1)
Figure 8
ANTEC 2005 / 1007