which passed through a 100 ~m sieve. Dissolved ... contrast, the uncertainties in the Henry's Law .... 17 L. Haar, J.S. Gallagher and G.S. Kell, NBS/NRC Steam.
568
Earth and Planetary Science Letters', 105 (1991) 568-573 Elsevier Science Publishers B.V., A m s t e r d a m
[Clq
Reply to comment by T.M. Gerlach on "Mid-ocean ridge popping rocks: implications for degassing at ridge crests" David Graham a and Philippe Sarda b Department of Geological Sciences, University of California, Santa Barbara, CA 93106, U.S.A. h Laboratoire de Gdochimie et Cosmochiie, lnstitut de Physique du Globe Universit~ de Paris" VI, 4, place Jussieu, 75252 Paris, Cedex 05 France Received March 11, 1991: revision accepted June 4, 1991
I. I n t r o d u c t i o n
T.M. Gerlach [1] has raised an important point regarding the appropriate value for the bulk CO 2 concentration of Mid-Atlantic Ridge popping rocks, and we appreciate this opportunity to clarify several points. In our original paper [2] we inferred that these popping rocks, in contrast to typical mid-ocean ridge basalts (MORB), had undergone essentially no gas loss prior to eruption. Evidence for this includes (1) the extreme vesicularity ( - 1 7 % by volume) and relatively primitive nature of popping rocks compared to most M O R B (typically - 1% vesicularity); (2) the linear correlation of the logarithm of vesicle population density with decreasing vesicle size in the popping rocks; (3) a 4He/4°Ar ratio in popping rocks which is the lowest value measured in MORB [3] (and similar to the production ratio appropriate for the upper mantle), consistent with rare gas solubilities and varying degrees of pre-eruptive vesicle loss for MORB; (4) a 613C = - 3 . 8 % 0 , the highest value found in M O R B [4]; and (5) the highest rare gas and CO 2 concentrations yet found in MORB. Our main point was that most M O R B appear to be residual liquids which erupt after some gas loss has occurred, whereas popping rocks may represent a rare case where significant perturbations to bubble nucleation and growth have not occurred during m a g m a ascent. The major implication is that pre-eruptive gas loss may be a significant form of degassing for MORB, as suggested previously [5]. Prior to the discovery of popping rocks, it was speculated that degassing occurred at depths up to 0012-821X/91/$03.50
,~:~1991
50 km, because no MORBs contained enough He to account for the He flux at ridges estimated from the deep ocean excess of 3He. We measured He contents in excess of 50/~cm3 S T P / g in popping rocks from 1 4 ° N on the Mid-Atlantic Ridge [2,3], and emphasized that such a high [He] could provide the He flux solely by degassing of newly created ocean crust. While it was not the major point of our paper, we also used the measured [CO2] reported by a different laboratory for these same samples [4,6] to show that the calculated carbon flux was within the range of previous estimates. We felt that using a measured [CO2] rather than a calculated value was a better approach for this flux estimate, which we presented as an order of magnitude estimate only. (There has been a considerable debate over the precise value of the mid-ocean ridge C flux, estimates of which are based on somewhat different measurements and lines of reasoning [5,7 10].) Our calculations for nucleation and growth rate parameters used an estimated value for bulk CO 2 content of 1 wt.%. A value of - 1 wt.% for the initial CO 2 content is consistent with the vesicularity and depth of eruption [4,6]. We cited a value of 0.21 wt.% as the highest measured value for the bulk CO 2 content [6] (more recent measurements range up to 0.30 wt.% [4]). We did not suggest that 0.21 wt.% should be taken as representative of undegassed M O R B magma. Obviously the determination of a true bulk gas content in popping rocks is extremely difficult owing to their vesicular nature and the potential for gas loss during sample preparation. Our model calculations were presented to illustrate the generality of the approach in arriving at order of magnitude estimates for
Elsevier Science Publishers B.V. All rights reserved
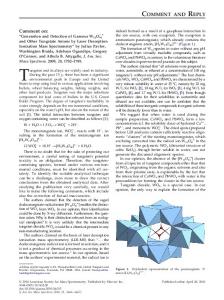
569 vesicle nucleation and growth rate parameters. As we pointed out, these estimates were probably uncertain by about a factor 5. In the following we present some new results and calculations which address the discrepancy noted by Dr. Gerlach in the calculated and measured bulk CO 2 contents. First, we show that some degree of gas loss by natural decrepitation of vesicles after quenching, or during sample preparation, seems unavoidable. Second, we demonstrate that the partitioning of He between gas and melt is close to equilibrium in these popping rocks. Therefore, at least part of the discrepancy between measured and calculated CO 2 contents may be related to sample preparation techniques. Third, we present a mass balance for a mixture of gas components (CO2-H20) and melt, which is constrained by new measurements of dissolved CO 2 and H 2 0 in these same popping rocks, and by the experimentally-determined real properties of these gases. From these considerations, bulk CO 2 and H20 contents of 0.8 and 0.6 wt.%, respectively, are the most appropriate values for these magmas. The measurement of dissolved [He], [H20 ] and [CO2] for the same samples allows a refined estimate to be made for the mid-ocean ridge C flux which closely agrees with that in [1], but we emphasize that the large uncertainties preclude the accuracy of this estimate to better than a factor of 3. 2. Post-eruptive gas loss Figure 1 shows the cumulative volume fraction vs. vesicle size for the popping rocks based on our original data [table A1, ref. 2]. The volume fractions were computed assuming that all vesicles within each size class are spheres with radii equal to the midpoint of the size class, and the plotted values therefore only represent approximations. Most of the volume fraction of gas is clearly in the larger vesicles despite their much smaller abundance, as we pointed out previously [2]. Thus, for sample sizes of < 1 g (as typically analyzed for bulk gas content) potential gas loss either naturally or during sample preparation may be significant. For example, for a sample size of 0.5 g, there are only - 10 vesicles in the largest 2 size classes (calculated from data in our original table 2). Decrepitation of vesicles in these size groups would
lead to a loss of - 2 5 % of the original bulk gas content. The problem is even worse if smaller samples are analyzed. This effect can be quantified following several assumptions about sample and vesicle geometry. Consider a cube of edge-length L, and assume that the bubbles are spheres randomly distributed throughout the cube. For a bubble of diameter D, the center of the bubble must be placed at least a distance (D/2 + 8), where 8 is very small, from the edge of the sample to ensure that the original vapor within the bubble is retained. Any bubbles closer to an edge than this will be opened to the atmosphere during sample preparation. The fraction of bubbles of size D which are not opened during preparation is given by
f~ (L-2(D/2+8))3_ (L-D) 3 L3
L3
Letting D = a L , f=(1-a) 3 or a = l - f l / 3 . Thus, to ensure that f > 0.95 for any given grain size requires c~ < 0.017. This means for example, that for retention of more than 95% of the bubbles in the 1 m m size class, the sample must be a cube with L = 59 m m (weight > 470 g). In this way we estimate that the amount of gas loss for each sample we have analyzed for [He] is 25-35%, based on the vesicle size distribution data [table A1, ref. 2] and the respective sample weights ( - 0.27-0.54 g; Table 1). Actual gas loss may be somewhat different from this rough estimate, because the calculation assumes a homogeneous distribution of vesicles, a simple geometry 1.0 -Q 0.8
"'.~.. "".....
Cumulative Volume 0.6 Fraction
",..... "....... "......
0.4
"'-........... 'B...
0.2
0.0 0.0
,
i 0.2
,
i 0.4
,
i 0.6
,
i 0.8
,
i
i
1.0
1,2
D, turn Fig. |. Cumulative volume fraction of vesicles vs. vesicle diameter in rnm.
570
for the samples analyzed, and the absence of microcracks.
TABLE 1 Helium in M A R popping rocks Sample
Wt.
Crushed [He]
Melted [He]
DG1
0.352 0.405 0.464 0.478 0.266 0.538
64.3 68.8 51.3 66.4 73.2 34.6
0.88 1.00 -
3. Helium and carbon in popping rocks
This leads to the question of sample variability. While we have not performed the CO 2 measurements, we suggest that the highest gas concentrations in these rocks should be accepted as being closest to the representative value, based on the above discussion. CO 2 analyses of a large number of these samples are currently in progress in the stable isotope laboratory of Prof. M. Javoy at the University of Paris, and these data will provide a more reliable basis on which to address the issue raised by Gerlach [1]. In addition, glass phase CO 2 and H 2 0 contents of the same samples analyzed for He have been measured at CalTech by FTIR spectroscopy. These samples have dissolved CO 2 contents of 180 ppm and H 2 0 contents of 0.51 wt.% (Jacqueline Dixon, pers. commun.). The value of 180 ppm is very close to the equilibrium CO 2 solubility in basalt at 1200°C and 360 bar [11]. We have attempted to address the questions of sample variability and vesicle decrepitation using He measurements. We performed repeated analyses of single glass chunks by crushing in vacuo, and also attempted to determine the state of He partitioning between glass and vesicle phases. If a large fraction of the vesicle gas has been lost by natural decrepitation or during sample preparation, He should appear to be concentrated in the glass phase in excess of the equilibrium partitioning value. Our He results are presented in Table 1. All samples were analyzed by crushing at least once. The total range in crushed helium content is about a factor of 2, similar to that observed earlier [2]. The mean of 6 analyses is 60 + 14 ( l o ) /~cm3STP/g; agreement for replicate analyses of subsamples from the same chunk is even better, e.g., DG1 and DG2 (Table 1). Each of these samples were also crushed in vacuum sequentially, with > 99.9% of the He released in the first crushing step. Immediately following this analysis, the powders produced by crushing were transferred to A1 foil boats and introduced to the all-metal sample loading system of a high-temperature rock furnace. (All the sample powder passed through a
DG2 PR-ya PR-xc
Dissolved [Hel 1.05 1.08 -
All analyses were performed at UCSB, on glass pieces recovered by dredge 2 ~ D 4 3 of the Akademik Boris Petrov, from 1 4 ° N on the Mid-Atlantic Ridge. Sample weight in g. [He] in /~cm3STP/g, determined by peak height comparison to laboratory running standards. Analytical precision is 2 x 10¹² tool/yr. These calculations demonstrate that somewhat different lines of reasoning using data from the same samples lead to calculated fluxes which differ by at least a factor of 3. At the present time we feel that vesicle distributions in MORB need more study, and the variability in C / 3 H e ratios for MORB, popping rocks and hydrothermal vent fluids from a variety of locations needs to be thoroughly assessed before we can constrain the mid-ocean ridge carbon flux more precisely.
References
Acknowledgments
We thank Jackie Dixon for sharing unpublished data, Frank Spera for insight into the thermodynamics of mixed volatiles, and an anonymous reviewer for constructive comments. Helium isotope work at UCSB is supported by grants to
1 T.M. Gerlach, Comment on "Mid-ocean ridge popping rocks: implications for degassing at ridge crests" by P. Sarda and D. Graham, Earth Planet. Sci. Lett. 105, 534 535, this volume, 1991, 2 P. Sarda and D. Graham, Mid-ocean ridge popping rocks: implications for degassing at ridge crests, Earth Planet. Sci. Lett. 97, 268-289, 1990. 3 T. Staudacher, P. Sarda, S.H. Richardson, C.J. All~gre, I. Sagna and L.V. Dmitriev, Noble gases in basalt glasses from a Mid-Atlantic Ridge topographic high at 14°N: geodynamic consequences, Earth Planet. Sci. Lett. 96, 119133, 1989. 4 M. Javoy and F. Pineau, MORB volatiles at 14°N on the mid-Atlantic Ridge, Abstracts of the 2nd V.M. Goldschmidt Conference, Baltimore, p. 56, 1990. 5 T.M. Gerlach, Degassing of carbon dioxide from basaltic magma at spreading centers: If. mid-ocean ridge basalts, J. Volcanol. Geotherm. Res. 39, 221-232, 1989. 6 M. Javoy, F. Pineau and H. Delorme, Carbon and nitrogen isotopes in the mantle, Chem. Geol. 57, 41-62, 1986. 7 M. Javoy, F. Pineau and C.J. Allagre, Carbon geodynamic cycle, Nature 300, 171-173, 1982. 8 D.J. Des Marais and J.G, Moore, Carbon and its isotopes in mid-oceanic basaltic glasses, Earth Planet. Sci. Lett. 69, 43-57, 1984. 9 B. Marty and A. Jambon, C/3He in volatile fluxes from the solid Earth: implications for carbon geodynamics, Earth Planet. Sci. Lett. 83, 16-26, 1987. 10 D.J. Des Marais, Carbon exchange between the mantle and the crust, and its effect upon the atmosphere: today compared to Archean time, in: The Carbon Cycle and Atmospheric CO2: Natural Variations Archean to Present. Geophys. Monogr. 32, Am. Geophys. Union, pp. 602-611, 1985. 11 E.M. Stolper and J.R. Holloway, Experimental determination of the solubility of carbon dioxide in molten basalt at low pressure, Earth Planet. Sci. Lett. 87, 397-408. 12 M.D. Kurz and W.J. Jenkins, The distribution of helium in oceanic basalt glasses, Earth Planet. Sci. Lett. 53, 41-54, 1981. 13 D.W. Graham, A. Zindler, M.D, Kurz, W.J. Jenkins, R. Batiza and H. Staudigel, He, Pb, Sr and Nd isotope constraints on magma genesis and mantle heterogeneity beneath young Pacific seamounts, Contrib. Mineral. Petrol. 99, 446-463, 1988. 14 F.J. Spera, Carbon dioxide in igneous petrogerlesis III. Role of volatiles in the ascent of alkaline magma with special reference to xenolith-bearing mafic lavas, Contrib. Mineral. Petrol. 88, 217-232, 1984. 15 J.F. Stebbins, I.S.E. Carmichael and L,K. Moret, Heat capacities and entropies of silicate liquids and glasses, Contrib. Mineral, Petrol. 86, 131-148, 1984. 16 Y. Bottinga and P. Richet, High pressure and temperature equation of state and calculation of the thermodynamic
573 properties of carbon dioxide, Am. J. Sci. 281, 615-660, 1981. 17 L. Haar, J.S. Gallagher and G.S. Kell, N B S / N R C Steam Tables: thermodynamic and transport properties and computer programs for vapor and liquid states of water in SI units, Hemisphere Publ. Corp., 1984. 18 H. Craig, W.B. Clarke and M.A. Beg, Excess 3He in deep
water on the East Pacific Rise, Earth Planet. Sci. Lett. 26, 125-132, 1975. 19 J. Lupton and D. Graham, Comment on "A ten-year decrease in the atmospheric helium isotope ratio possibly caused by human activity" by Y. Sano et al., Geophys. Res. Lett. 18, 482-485, 1991.