Clin Chem Lab Med 2001; 39(4):324–332 © 2001 by Walter de Gruyter · Berlin · New York
Reporting Cerebrospinal Fluid Data: Knowledge Base and Interpretation Software
Hansotto Reiber1, Markus Otto1, Christian Trendelenburg2 and Arno Wormek3 1 Neurochemisches Labor der Neurologischen Klinik, Universität Göttingen, Germany 2 Institut für Laboratoriumsmedizin der Städtischen Kliniken, Frankfurt a.M.-Höchst, Germany 3 Software Solutions in Medicine, ESL.wormek, Gerbrunn, Germany
The compilation of cerebrospinal fluid (CSF) patient data together with a graphic display of immunoglobulin patterns in a single CSF report has two main advantages: analytical and clinical plausibility control of a complex set of data improves quality assessment and allows improved clinical specificity and sensitivity for recognition of disease-related “typical” data patterns. The widespread use of automated on-line evaluation programs can now be combined with knowledge-based programs for interpretation by clinical chemists and neurologists. These programs are based on knowledge of neuroimmunology, blood-CSF barrier function and dysfunction, influence of CSF flow on concentrations of blood-derived and brain-derived proteins in CSF, specific intrathecal antibody synthesis and relevance of brain proteins for differential diagnosis of degenerative diseases. The relevance of hyperbolic discrimination functions in quotient diagrams for the detection of intrathecal immunoglobulin synthesis is compared with earlier, still frequently used, linear interpretation functions. Differences found in commercially available interpretation software are discussed. Key words: Cerebrospinal fluid: interpretation software; Neurological diseases; Software. Abbreviations: AD, Alzheimer’s disease; AI, antibody index; CNS, central nervous system; CJD, CreutzfeldtJakob disease; CSF, cerebrospinal fluid; IF, intrathecal fraction; QAlb, albumin CSF/serum quotient; sICAM, soluble intercellular cell adhesion molecule; VZV, varicella zoster virus.
1. The CSF Data Report The cerebrospinal fluid (CSF) data report in Figure 1 is representative for many on-line evaluation programs and includes the following parts: • Demographic data of the patient and the differential diagnostic question • Information from visual inspection of CSF • Cytology (total cell count and cell differentiation)
• Protein data from CSF and serum for albumin, IgG, IgA and IgM evaluated as CSF/serum quotients, numerically and graphically • CSF/serum quotient diagrams with hyperbolic discrimination lines for IgG, IgA and IgM (Reibergram) • Qualitative analysis of oligoclonal IgG • Intrathecal antibody synthesis detected by antibody index (AI) • Information about brain-derived proteins as markers for degenerative diseases or tumor metastasis • Lactate concentration in CSF • The reference range-related interpretation of single analytical data • Diagnosis-oriented interpretations of the complex data patterns Reviews including many of these aspects have been published (1–6). 2. Knowledge Base for Interpretation 2.1 CSF flow rate and blood-CSF barrier function The CSF flow rate has been recognized as the basic modulator of blood-derived and brain-derived proteins in CSF (7–9). The so-called blood-CSF barrier dysfunction corresponds to a decreased CSF flow rate and a subsequently increased CSF/serum albumin quotient. The earlier “leakage” models for blood-CSF barrier dysfunction have been replaced by a biophysical model which shows the nonlinear relation between reduced CSF flow rate and increased molecular flux of blood proteins into CSF. The blood-derived proteins in CSF follow a hyperbolic function which depends primarily on the molecular size of the proteins. Figure 2 shows mean concentrations of blood-derived proteins in CSF changing with decreasing CSF flow rate, i.e. increasing albumin quotient (QAlb). The clinically relevant discrimination between a brain-derived fraction of these proteins and the blood-derived fraction refers to the upper hyperbolic limit of the reference ranges. This is shown for IgG, IgA and IgM in logarithmic graphs in Figure 1 and Figure 3. The dynamics of brain-derived proteins (8, 9) depends critically on their origin. Proteins from neurons or glial cells like tau protein, neuronspecific enolase, and S100 protein all enter CSF primarily in the ventricular and cisternal space. Their concentration between normal ventricular and lumbar CSF decreases (in contrast to blood proteins), and in the case of a pathological decrease in CSF flow rate, the mean concentration in lumbar CSF remains unchanged (Figure 4). The concentrations of the primarily leptomeningeal proteins,
Reiber et al.: Interpretation of CSF results
Fig. 1 CSF Report as developed in the Neurochemistry Laboratory, University of Göttingen. The components of the report are summarized in the text. This type of integrated CSF data report is implemented in the on-line evaluation program of Dade Behring (Marburg, Germany; DSS-Com) or in the CSF-Report of Beckman Coulter (Krefeld, Germany). The data originate from a patient with AIDS . Together with chronic HIV encephalitis an opportunistic toxoplasmosis with increased albumin quotient and three-class humoral immune response
325
can be observed. At time of diagnostic puncture the clinician suggested an opportunistic infection. A two- or three-class response with or without barrier dysfunction, or a severe barrier dysfunction alone as well as a high cell count (rare) point to an opportunistic infection, with subsequent request for specific antibody analysis, or search for the microorganism using PCR. In the case of an isolated intrathecal IgM synthesis without further inflammatory signs in CSF, lymphoma should be considered (2).
326
Reiber et al.: Interpretation of CSF results
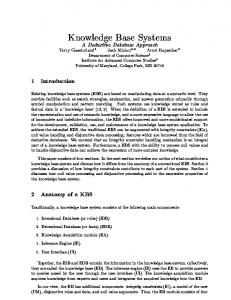
Fig. 2 Blood-derived proteins and blood-CSF barrier dysfunction. The hyperbolic curves show the mean CSF/serum quotient, Q, of blood-derived proteins with different molecular size as a function of decreasing CSF flow rate (7), as indicated by increasing albumin CSF/serum quotient, QAlb. The theoretical, calculated blood-derived fraction of transthyretin (TT) is shown by the dashed line with 45 °, due to its size similar to albumin (TT passes the barrier associated with the retinol binding protein) (8, 9). Empirical mean quotients for prothrombin (Proth) (10), carcinoembryonic antigen (CEA) and immunoglobulins IgG, IgA, IgM (7) are shown together with their molecular weights (kDa). Hyperbolic functions are a consequence of nonlinear interaction of molecular flux with CSF flow rate as derived from the laws of diffusion (7) with the general equation: QIgG = (erfc z (DIgG : DAlb) 0.5 / erfc z) · QAlb. This function shows that the relationship depends only on the ratio of diffusion coefficients (DIgG : DAlb), i.e. on the different size of the molecules. The hyperbolic functions for individual proteins are characterized empirically by three variables (a, b, c) in a more usual form of the hyperbolic function: QIg = a/b (Q Alb)2 + b2 – c.
Fig. 3 CSF/serum quotient diagrams for IgG, IgA, IgM with hyperbolic graphs according to Reiber (7). For practical reasons a double logarithmic plot is used. The reference ranges of blood-derived IgG, IgA, IgM fractions in CSF (range 1 and 2) include between upper (QLim) and lower hyperbolic discrimination lines 99% (+/–3SD) of the 4300 patients investigated. The upper hyperbolic curves (thick lines) of the reference range represent the discrimination between brain-derived and blood-derived immunoglobulin fractions in CSF, called QLim (Lim from limit). Values above QLim represent intrathecal fractions (IF) in percent of total CSF concentration as IgGIF, IgAIF, or IgMIF. These intrathecal fractions can be conveniently read from the quotient diagrams with lines for 20, 40, 60 and 80% intrathecal synthesis with the upper discrimination line (QLim) as 0% synthesis. The example shows IgMIF = 40%. The limit of the reference range for QAlb between normal and increased CSF protein concentration (blood-CSF barrier dysfunction) is indicated by the age-dependent vertical line, which in this case is for a patient aged 60 years. A general function describing the upper limit of the age groups above 5 years is QAlb = (4 + age/15) · 10–3.
In the diagrams (Figures 1 and 5), three vertical lines are shown at Q Alb = 5 · 10–3 (up to 15 years); at Q Alb = 6.5 · 10 –3 (up to 40 years); at QAlb = 8 · 10–3 (up to 60 years). The diagrams depict five ranges: 1 = normal; 2 = pure blood-CSF barrier dysfunction (i.e., reduced CSF turnover); 3 = intrathecal Ig synthesis with a reduced CSF turnover and 4 = intrathecal Ig synthesis without change in CSF turnover. Values below the lower hyperbolic line, in range 5, indicate a methodological fault. The characterization of the hyperbolic functions has taken into account the analytical imprecision with coefficients of variation between 3–8% for the quotients of albumin, IgG, IgA and IgM (11) Due to larger variations between laboratories, intrathecal Ig synthesis should be considered elevated if the intrathecal fraction IgIF is larger than 10%. For construction of diagrams, see Ref. (2). Patient example: the clinical information supplied (facial nerve palsy) together with the data in the diagrams (intrathecal IgM fraction of IgMIF = 40% and oligoclonal IgG [with IgGIF = 0]) led to further analysis of Borrelia-specific Antibody Index. The Borrelia (IgG) AI = 4.3 and Borrelia (IgM) AI = 3.2 indicates Borrelia as the cause of the disease.
Reiber et al.: Interpretation of CSF results
327
Fig. 4 Dynamics of brain-derived proteins in lumbar CSF. The relative protein concentrations are shown as a function of the albumin CSF/serum concentration quotient, QAlb , increasing with blood CSF barrier dysfunction, i.e. decreased CSF flow rate (9). The mean slopes for the predominantly leptomeningeal proteins β-trace and cystatin C are derived from the data in (9). The lumbar concentration of glial and neuronal proteins which enter CSF in the ventricular and cisternal space, e.g. tau protein, neuronspecific enolase and S100 protein, are constant in cases of blood-CSF barrier dysfunction, i.e. reduced CSF flow rate (9). Dynamics of the brain-derived proteins are derived from the laws of diffusion and CSF flow as shown in (9).
β-trace protein and cystatin C (former γ-trace protein) increase between normal ventricular and lumbar CSF, and in the case of pathologically reduced CSF flow rate, they increase linearly in lumbar CSF (Figure 4). Proteins with particular conditions, including additional blood-derived fractions like transthyretin or soluble intercellular cell adhesion molecule (sICAM), need to be evaluated with reference to the albuminCSF/serum quotient to avoid misinterpretation (9). 2.2 CSF/serum quotient diagrams, “Reibergrams“ Figure 3 shows an example of a quotient diagram, with additional comments, which provides a clinically relevant interpretation of CSF data with evaluation of blood-CSF barrier function and dysfunction. For detection of an intrathecal synthesis of IgG, IgA or IgM we have to take into account the blood-derived modification of the CSF values. This is done in particular by the formation of the CSF/serum concentration quotient. The quotient “Q” is a dimensionless measure of the CSF concentration, independent of the blood level variation (a higher CSF value corresponds to the higher serum concentration and the quotient remains constant). The generally accepted parameter for the barrier function, the albumin quotient, must be an age-related evaluation using the function given in the legend to Figure 3 (2). These diagrams can be applied for all blood-derived proteins with a correspondingly modified hyperbolic function. Also, some brain-derived proteins need reference to the albumin quotient for reliable interpretation (9).
Fig. 5 Dynamics of systemic and intrathecal IgG and IgM synthesis in a patient with neuroborreliosis (21). CSF samples were obtained at 3 (j), 4, 6, 10, 16 and 83 weeks after tick bite with the sequence of data indicated by arrows; cell counts were 132/µl, 100/µl, 39/µl, 90/µl, 15/µl and 3/µl, respectively. Borrelia AI (IgM) = 31 and Borrelia (IgG) AI = 42 were found at time of first puncture. The intrathecal fraction of IgM (IgMIF) is constant between the 4th and 16th week after tick bite (2nd to 5th puncture) and is independent of serum variations of IgM (lower diagram). In contrast to relative intrathecal fraction IgMIF, the absolute CSF concentration, IgMLoc in mg/l, varies with the albumin quotient (CSF flow rate) (2). The lower diagram shows the relative serum concentrations of IgM and IgG depending on time after infection. In spite of decreasing IgM and increasing IgG in serum at time of first diagnostic CSF sampling, this is not reflected in CSF/serum quotients, i.e., the intrathecal synthesis does not show this IgM/IgG switch which is present in blood.
328
Reiber et al.: Interpretation of CSF results
2.3 Neuroimmunology: immune reactions in the brain Immune reactions in the brain are detectable in CSF by • changes of cell count • immunoglobulin synthesis of IgG-, IgA- and IgMclasses • intrathecal synthesis of specific antibodies • presence of microorganisms A basic feature of the immune reaction in brain is the lack of switch from IgG- to IgM-class response, as demonstrated in Figure 5 for a patient with a neuroborreliosis. In this case we observe in blood the initial IgMclass response with a subsequent change to an IgGclass response (lower diagram in Figure 5). In the case of a neuroborreliosis, in contrast to the uniform dynamics in blood, the intrathecal synthesis shows a constant relation of IgG- to IgM-class response over many months, typical only for this disease. This particular property of the intrathecal immune response is the base of disease-related, “typical” CSF data patterns. These patterns depend on the causative organism as well as on the dynamic of the pathomechanisms of the particular disease (3). The polyspecific, oligoclonal immune response in CNS has a particular impact on the diagnosis of neurological diseases (1–3), either by analysis of oligoclonal IgG or as detection of intrathecal specific antibody synthesis (see below). The long-lasting intrathecal immune response with a slow decay (2), sometimes over two to three decades, has to be taken into account for interpretations (paragraph 3.7). 2.4 Comparison of evaluation programs for intrathecal IgG synthesis Earlier studies comparing clinical relevance of calculations for assessing intrathecal synthesis of IgG, in particular IgG synthesis rate (13, 14) and IgG index (38), were frequently based on multiple sclerosis patients with characteristically normal or only slightly increased albumin quotients. Consequently, the serious limitations of a linear approach when QAlb is strongly increased, as in many neurological diseases, were not detected (16–18). The hyperbolic discrimination line avoids the false-positive results yielded by the Tourtellotte formula and the Link’s IgG Index when QAlb is elevated (Figure 6). The restricted data set shown in Figure 6 is representative of the 4300 patients investigated in (7). These patients with, e.g. Guillain-Barré polyradiculitis, early bacterial meningitis or spinal canal stenosis, had no oligoclonal IgG, i.e., no intrathecal IgG synthesis. Figure 6 shows that the evaluation of such patients based only on IgG synthesis rate or IgG Index gives many false-positive results for intrathecal IgG synthesis. The statistical re-evaluation (see legend to Figure 6) of the earlier data from patients with large albumin quotients (Figure 2 in (7)) showed that up to 90% samples with high albumin quotients (severe barrier dysfunction) had falsely elevated IgG synthesis rate and up to 50% had false-positive IgG indices.
Fig. 6 Comparison of different discrimination lines (upper border of the reference range for blood- derived IgG in CSF) to detect intrathecal IgG synthesis. R = Reiber’s hyperbolic discrimination line, QLim (where IgGIF = 0) (7). L = Link’s IgG Index (15). Graphical representation of the usually numerical evaluation with a discrimination line for I = 0.7 (unit-less). T = Tourtellotte‘s IgG synthesis rate ( 13, 14). The daily production rate (in 500 ml) can be multiplied by two to get the concentration per liter. The discrimination line for zero intrathecal synthesis (IgGSyn = 0) is calculated from the mathematically transformed function as: QIgG = 0.43 · QAlb + 0.00084. The data points represent the restricted range of Q Alb = 20 to 30 ·10–3 from the earlier clinical study with 4300 patients (7). These are data from patients without an intrathecal IgG synthesis, e.g., cases of a Guillain Barré polyradiculitis, bacterial meningitis (first day) or a spinal canal stenosis (typically without oligoclonal IgG). A representative patient (d ) with a spinal canal stenosis without any signs of inflammation (normal cell count, no oligoclonal IgG) yielded a false-positive result if the intrathecal IgG synthesis were evaluated by IgG synthesis rate (T ) or by IgG Index (L), but would not be false positive with the hyperbolic discrimination line (R). The statistical re-evaluation of the data in Figure 2 of Ref. (7) for large albumin quotients Q Alb = 60 or 120 · 10 3 showed that as many as 11/14 or 16/17 respectively of the cases would be false positive with IgG synthesis rate and 6/ 14 or 8/17 with the IgG Index would be false positive for intrathecal IgG synthesis.
3. Disease-related CSF Data Patterns 3.1 Acute inflammatory diseases In Figures 1, 3, and 5 we show three examples out of a large number of examples in the literature (1–6, 11, 19–25 ). The complete data report in Figure 1 shows the typical picture of an opportunistic infection in a patient with AIDS. The severe blood-CSF barrier dysfunction or a two- or three-class immune response always point to an opportunistic infection. In the patient shown in Figure 1, further analysis of specific antibodies indicated toxoplasma gondii as the causative microorganism (Toxoplasma AI = 4.5). In the case of a suggested cytomegalovirus (CMV) infection or tuberculosis the direct detection of the microorganism by PCR has a high sensitivity (26, 27). Figure 3 shows a patient with a facial nerve palsy.
Reiber et al.: Interpretation of CSF results
The immunoglobulin pattern with an intrathecal IgM synthesis prompted further analysis, in this case the detection of specific antibodies against borrelia. In the case of a normal immunoglobulin pattern, a varicella zoster virus (VZV) which caused facial nerve palsy could have been expected, detectable with high sensitivity by the specific detection of VZV antibodies (2). Figure 5 shows some of the data from a patient with an acute neuroborreliosis, described in detail in an earlier publication (21). The typical humoral three-class immune response with dominance of the IgM-class, together with the barrier dysfunction, has a high diagnostic sensitivity and specificity for this disease. Other typical patterns, e.g. for neurotuberculosis with dominant intrathecal IgA-synthesis combined with a barrier dysfunction, increased lactate and an intermediate pleocytosis, can be found in the literature (1–6, 11, 19–25). 3.2 Chronic inflammatory diseases Some chronic inflammatory diseases such as multiple sclerosis or autoimmune diseases with involvement of the central nervous system (CNS) often present intrathecal IgG-synthesis, detected most sensitively by qualitative isoelectric focusing for oligoclonal IgG. This analysis as part of a laboratory-based diagnosis can be improved by the detection of the polyspecific intrathecal synthesis of antibodies against a set of neurotropic viruses (28), in particular measles, rubella and/or varicella zoster antibodies. In multiple sclerosis (29, 33) or autoimmune diseases with involvement of the CNS (30), the presence of this combined antibody response indicates a chronic, autoimmune type disease already at the stage of first clinical symptoms. 3.3 IgA and IgM analysis As shown in the literature (1–6, 11, 19–25), the increased complexity of the data set with additional analysis of IgA and IgM contributes to the clinical specificity and sensitivity of CSF analysis. A summary is given in Table 1. The recent developments are in particle amplified assays, sufficiently sensitive for IgA- and
Tab. 1
IgM-analysis in CSF (Beckman Coulter, Krefeld, Germany; Dade Behring, Marburg, Germany). 3.4 Oligoclonal IgG The results are reported according to the International Consensus (31) for the following 5 types of patterns in isoelectric focussing: Type 1: Normal CSF (no oligoclonal IgG detectable). Type 2: Oligoclonal IgG restricted to CSF (example in Figure 1). Type 3: Oligoclonal IgG in CSF with additional identical bands in CSF and serum (combination of type 2 and 4). Type 4: Identical oligoclonal bands in CSF and serum. Type 5: Monoclonal bands in CSF and serum (myeloma or monoclonal gammopathy). The detection of type 3 and 4 is of particular relevance to the systemic processes. 3.5 Intrathecal antibody synthesis: antibody index (AI) Besides the above application in chronic diseases, the detection of intrathecal antibody synthesis by the AI (1–3, 20, 32, 33) helps to find the causative microorganism in acute and subacute neurological diseases.The quality of this analysis depends on the parallel analysis of CSF and serum sample and the reference to the relevant IgG quotient (32). Absolute titers or quotients from titer values are not sensitive enough to detect intrathecal antibody synthesis (3,11). 3.6 Detection of the microorganisms in CSF In viral infections the detection of antibody reaction is to late to support initial diagnostic decisions. In these cases, direct detection of the causative microorganism by PCR (26, 34) is the method of choice (3). Among the bacterial infections, PCR has a very high clinical sensitivity for the diagnosis of tuberculous meningitis (27).
Humoral immune response patterns in CNS at time of first, diagnostic lumbar puncture.
Reaction type
Diagnosis
No IgG, IgA, IgM IgG predominant
Early bacterial meningitis and viral encephalitis, Guillain Barré polyradiculitis Multiple sclerosis (lower frequency of IgM, 25%, and IgA, 9%) Neurosyphilis (low frequencies of increased IgM, no IgA) Chronic HIV encephalitis Neurotuberculosis (IgA dominant with weak IgG response) Brain abscess Adrenoleukodystrophy Lyme neuroborreliosis (IgM dominant: IgMIF>IgAIF>IgGIF) Mumps meningoencephalitis (IgM dominant) Non-Hodgkin lymphoma involving CNS (isolated IgMIF > 0) Opportunistic infections (CMV, toxoplasmosis)
IgA predominant
IgM predominant
IgG + IgA + IgM
329
330
Reiber et al.: Interpretation of CSF results
3.7 Interpretation of humoral immune response in the brain An intrathecal humoral immune response (intrathecal fraction, IF > 0, oligoclonal IgG positive or antibody index, AI > 1.5) allows three different interpretations (1–3): • Subacute/acute inflammatory disease (during the first days of an infectious disease an intrathecal antibody synthesis is absent due to delayed humoral immune response). The main signs in CSF of an acute, active disease of CNS are the increased CSF cell count and blood-CSF barrier dysfunction (increased QAlb). • Scar from an earlier inflammatory process without an acute clinical relevance. • Chronic inflammatory process of the CNS (autoimmune type). 3.8 Cytology Total cell count, and as far as possible, a differential cell count (review in (4)), remain a central part of CSF analysis. Total cell count represents the key information for detecting an acute inflammatory disease, only supported by an increased albumin quotient. The differential cell count is crucial for characterization of an intracerebral hemorrhage or for characterization of tumor cells.
4. Summary of Interpretations The evaluation of the CSF data based on the reference ranges can result in the following standard interpretations (see also Figure 1): • normal CSF (including normal cell count) • normal CSF protein concentration • increased cell count • blood/CSF barrier dysfunction • intrathecal specific antibody synthesis • inflammatory process in CNS • intrathecal tumor/metastases 4.1 Acute and chronic inflammatory processes These interpretations are based on the following definitions: Blood-CSF barrier dysfunction Increased (age-related) QAlb values reflect mechanical and inflammatory restrictions of CSF turnover as well as hemorrhage. These cases can be distinguished via differential cell counts. Inflammatory process This interpretation relates to all specimens that show either increased cell count > 20/µl or activated B-lymphocytes (>0.1% of lymphocytes) and any humoral immune reaction in CNS.
Humoral immune reaction A humoral immune reaction in CNS is defined as QIgG > QAlb, IgG IF > 0, oligoclonal IgG in CSF (type 2 and 3) or any organism-specific AI >1.5; both of these are possible in spite of IgIF = 0. A local IgA or IgM synthesis in CNS is suggested if IgAIF > 10%, IgM IF > 10% or QIgA > QIgG or QIgM > QIgA. 4.2 Analysis of brain proteins in the differential diagnosis of degenerative diseases Early discrimination of different causes of dementia (Alzheimer’s disease (AD), Creutzfeldt-Jakob (CJD) disease, multi-infarct dementia or depressive pseudodementia) is facilitated by a set of brain-derived proteins detectable in CSF and serum. Alzheimer’s disease AD can be differentiated from non-AD diseases like multi-infarct dementia, if tau protein values are increased and combined β-amyloid values are decreased in CSF (35). However there is a large overlap of tau-protein and β-amyloid levels in CSF of patients with different causes of dementia (36–38). Thus, in an individual case an etiological classification relying only on the tau-protein and β-amyloid level is not reliable. Tau protein is non-specifically increased in many other neurological diseases. Creutzfeldt-Jakob disease CJD exhibits rapidly progressive dementia and at least two of the following clinical findings: myoclonus, visual and/or cerebellar signs, pyramidal and extrapyramidal signs and akinetic mutism. The detection of protein 14-3-3 (39) can change the diagnosis from possible to probable CJD. The EEG signs are of equivalent relevance but some patients without a typical EEG are positive for protein 14-3-3. Very high tau protein values (> 1300 pg/ml) and S100B levels in CSF and serum also point to this diagnosis (38, 40). Increased concentrations of neuronspecific enolase in CSF further suggest rapidly progressive neuronal degeneration (39, 41, 42 ). Immunoglobulin data pattern (in Reibergrams) are usually normal and oligoclonal IgG is rare in AD and CJD, i.e., the detection of oligoclonal IgG is not sufficient to exclude the diagnosis of CJD or AD.
5. Software for On-Line Test Results, Result Interpretation and Quality Assessment An increasing number of commercially available evaluation programs, in particular for a printed CSF report with integrated Reibergrams, support the efforts of clinical chemists and neurochemists to integrate the CSF analysis into a laboratory data system. The on-line programs can be directly nephelometer-associated with more or less sophisticated external data input. The interpretation of the results must be inserted manually (CSF-COM, BNA-COM from Dade Behring). Other
Reiber et al.: Interpretation of CSF results
programs (Beckman Coulter) are connected to a knowledge-based software, computing the test result interpretation (43, 44). Using this software, a reference range-related data interpretation is integrated automatically and comments for the clinical chemist are given to recognize data combinations that are not plausible or to point to further differential diagnostic efforts. An English version of the evaluation program with knowledge-based interpretation was developed for the International CSF Consensus Group (45). This program is available at http://www.wormek.de. A third approach has been developed for the communication between nephelometer and a large host. Data in the host database are converted into an intermediate database format from which the CSF and serum data can be imported into local program (DSS-COM, COMED, Soest, Germany and Dade Behring).This program can be installed in any PC for additional integration of demographical and external analytical data on the single patient. These programs have a strong impact on the general quality assessment in CSF analysis (12). As a contribution to quality assessment recently a CD ROM on the basic principles of CSF analysis was developed for staff training (19). References for these programs can be found at http://www.comed.com, http://www.wormek.de, http://www.trendelenburg.de or Beckman Coulter, Krefeld and Dade Behring, Marburg.
References 1. Reiber H. Cerebrospinal fluid – physiology, analysis and interpretation of protein patterns for diagnosis of neurological diseases. Multiple Sclerosis 1998; 4:99–107. 2. Reiber H, Peter JB. Cerebrospinal fluid analysis: diseaserelated data patterns and evaluation programs. J Neurol Sci 2000; 184:101–22. 3. Reiber H, Sindic CJM, Thompson EJ. Cerebrospinal fluid – clinical neurochemistry of neurological diseases. Heidelberg: Springer-Verlag, 2001. In press. 4. Zettl UK, Lehmitz R, Mix E, editors. Klinische Liquordiagnostik. Berlin: Walter de Gruyter, 2001. In press. 5. Felgenhauer K. Laboratory diagnosis of neurological diseases, In: Thomas L, editor. Clinical laboratory diagnostics – use and assessment of clinical laboratory results. Frankfurt: TH-Books, 1998:1308–26. 6. Reiber H. Liquordiagnostik. In: Berlit P, editor. Klinische Neurologie. Heidelberg: Springer, 1999:148–77. 7. Reiber H. Flow rate of cerebrospinal fluid (CSF) – a concept common to normal blood-CSF barrier function and to dysfunction in neurological diseases. J Neurol Sci 1994; 122:189–203. 8. Reiber H. CSF flow – its influence on CSF concentration of brain-derived and blood-derived proteins. In: Teelken A, Korf J, editors. Neurochemistry. NewYork: Plenum Press, 1997:51–72. 9. Reiber H. Dynamics of brain proteins in cerebrospinal fluid. Clin Chim Acta 2001. In press. 10. Lewczuk P, Reiber H, Ehrenreich H. Prothrombin in normal human cerebrospinal fluid originates from blood. Neurochem Research 1998; 23:1027–30.
331
11. Reiber H. Die diagnostische Bedeutung neuroimmunologischer Reaktionsmuster im Liquor cerebrospinalis. Lab Med 1995; 19:444–62. 12. Reiber H. External quality assessment in clinical neurochemistry: survey of analysis for cerebrospinal fluid (CSF) proteins based on CSF/serum quotients. Clin Chem 1995; 41:256–63. 13. Tourtellotte WW. On cerebrospinal fluid immunoglobulinG (IgG) quotients in multiple sclerosis and other diseases. A review and a new formula to estimate the amount of IgG synthesized per day by the central nervous system. J Neurol Sci 1970; 10:279–304. 14. Tourtellotte WW, Tumani, H. Multiple sclerosis cerebrospinal fluid. In: Raine CS, McFarland HF, Tourtellotte WW, editors. Multiple sclerosis. New York: Chapman and Hall, 1997:57–79. 15. Link H, Tibbling G. Principles of albumin and IgG disorders. Evaluation of IgG synthesis within the central nervous system in multiple sclerosis. Scan J Clin Lab Invest 1977; 37:397–401. 16. Souverijn JHM, Serrée HMP, Peet R, Grenzebach Smit W, Bruyn GW. Intrathecal immunoglobulin synthesis. Comparison of various formulae with the ”gold standard” of isoelectric focusing. J Neurol Sci 1991; 102:11–6. 17. Öhman S, Ernerudh J, Forsberg P, Henriksson A, von Schenck H, Vrethem M. Comparison of seven formulae and isoelectrofocusing for determination of intrathecally produced IgG in neurological diseases. Ann Clin Biochem 1992; 29:405–10. 18. Peter JB, Bowman RL. Intra-blood-brain-barrier synthesis of IgG: comparison of IgG synthesis formulae in a computer model and in 1,629 consecutive specimens. Neurology 1992; 42:510–15 19. Reiber H. Grundlagen der Liquoranalytik mit Fallbeispielen neurologischer Erkrankungen. CD-ROM Beckman Coulter 2000, Krefeld, Germany (versions are also in English and Spanish). 20. Felgenhauer K, Reiber H. The diagnostic significance of antibody specifity indices in multiple sclerosis and herpes virus induced diseases of the nervous system. Clin Invest 1992; 70:28–37. 21. Tumani H, Nölker G, Reiber H. Relevance of cerebrospinal fluid variables for early diagnosis in neuroborreliosis. Neurology 1995; 45:1663–70. 22. Dorta-Contreras A J. Reibergramas: elemento esencial en el analisis inmunológico del líquido cefalorraquideo. Rev Neurol 1999; 28:996–8. 23. Korenke GC, Reiber H, Hunnemann DH, Hanefeld F. Intrathecal IgA synthesis in X-linked cerebral adrenoleukodystrophy. J Child Neurol 1997; 12:314–20. 24. Dorta AJ, Reiber H. Intrathecal synthesis of immunoglobulins in eosinophilic meningoencephalitis due to angiostrongylus cantonensis. Clin Diagn Lab Immunol 1998; 5:452–55. 25. Christen HJ, Hanefeld F, Eiffert H, Thomssen R. Epidemiology and clinical manifestations of lyme borreliosis in childhood. Acta Paediatr Suppl 1993; 386:1–76. 26. Cinque P, Scarpellini P, Vago L, Linde A, Lazzarin A. Diagnosis of CNS complications in HIV infected patients: cerebrospinal fluid analysis by the polymerase chain reaction. AIDS 1997; 11:1–17. 27. Monteyne P, Sindic CJM. The diagnosis of tuberculous meningitis. Acta Neurol Belg 1995; 95:80–7. 28. Felgenhauer K, Schädlich HJ, Nekic M, Ackermann R. Cerebrospinal fluid virus antibodies. A diagnostic indicator for multiple sclerosis? J Neurol Sci 1985; 71:291–9. 29. Reiber H, Ungefehr S, Jacobi C. The intrathecal, polyspe-
332
Reiber et al.: Interpretation of CSF results
cific and oligoclonal immune response in multiple sclerosis. Multiple Sclerosis 1998; 4:111–7. 30. Graef IT, Henze I, Reiber H. Polyspezifische Immunreaktion im ZNS bei Autoimmunerkrankungen mit ZNS-Beteiligung. Z Ärztl Fortbild 1994; 88:587–91. 31. Andersson M, Alvarez-Cermeño J, Bernardi G, Cogato P, Fredman P, Frederiksen J, et al. Cerebrospinal fluid in the diagnosis of multiple sclerosis: A Consensus Report. J Neurol Neurosurg Psychiatry 1994; 57:897–902. 32. Reiber H, Lange P. Quantification of virus-specific antibodies in cerebrospinal fluid and serum: sensitive and specific detection of antibody synthesis in brain. Clin Chem 1991; 37:1152–60. 33. Sindic C, Monteyne P, Laterre E. The intrathecal synthesis of virus-specific oligoclonal IgG in multiple sclerosis. J Neuroimmunol 1994; 54:75–80. 34. Cinque P, Cleator GM, Weber T, Monteyne P, van Loon A, Sindic CJM. The role of laboratory investigation in the diagnosis and management of patients with suspected herpes encephalitis: a consensus report. J Neurol Neurosurg Psychiatry 1996; 61:339–45. 35. Hulstaert F, Blennow K, Ivanoiu A, Schoonderwaldt HC, Riemenschneider M, De Deyn PP, et al. Improved discrimination of AD patients using β-amyloid (1–42) and tau levels in CSF. Neurology 1999; 52:1555–62. 36. Andreasen N, Vanmechelen E, Van de Voorde A, Davidsson P, Hesse C, Tarvonen S, et al. Cerebrospinal fluid tau protein as a biochemical marker for Alzheimer´s disease: a community based follow up study. J Neurol Neurosurg Psychiatry 1998; 64:298–305. 37. Otto M, Esselmann H, Schulz-Schaeffer W, Neumann M, Schroter A, Ratzka P, et al. Decreased beta-amyloid 1–42 in cerebrospinal fluid of patients with Creutzfeldt-Jakob disease. Neurology 2000; 54:1099–102. 38. Otto M, Wiltfang J, Tumani H, Zerr I, Lantsch M, Kornhuber J. Elevated levels of tau protein in cerebrospinal fluid of
patients with Creutzfeld-Jakob disease. Neurosci Lett 1997; 225:210–2. 39. Zerr I, Bodemer M, Gefeller O, Otto M, Poser S, Wiltfang J, et al. Detection of 14-3-3 protein in the cerebrospinal fluid supports the diagnosis of Creutzfeld-Jakob disease. Ann Neurol 1998; 43:32–40. 40. Otto M, Wiltfang J, Schütz E, Zerr I, Otto A, Pfahlberg A, et al. Diagnosis of Creutzfeld-Jakob disease by measurement of S100 protein in serum prospective case-control study (see comments). Biol Med J 1998; 316:577–82. 41. Jacobi C, Reiber H. Clinical relevance of increased neuronspecific enolase concentration in cerebrospinal fluid. Clin Chim Acta 1988; 177:49–54. 42. Zerr I, Bodemer M, Räcker S, Grosche S, Poser S, Kretzschmar HA, et al. Cerebrospinal fluid concentration of neuronspecific enolase in diagnosis of Creutzfeldt-Jakob disease. Lancet 1995; 345:1609–10. 43. Faber R, Trendelenburg C. Interpretation of CSF quantities with the knowledge-based system Pro.M.D. – cerebrospinal fluid diagnostics. J Lab Med 1997; 21:257–82. 44. Trendelenburg C, Colhoun O, Wormek A, Massey KL. Knowledge-based test result interpretation in laboratory medicine. Clin Chim Acta 1998; 278:229–42. 45. Shaw P, Reiber H, Brennan C. European Cerebrospinal Fluid Consensus Group – a TeamRoom (Lotus Notes)Based Communication Network. Clin Chem Lab Med 2000; 38:747–51. Received 29 November 2000, accepted 30 January 2001 Corresponding author: Prof. Dr. Hansotto Reiber, Neurochemisches Labor, Robert-Koch-Straße 40, 37075 Göttingen, Germany Tel: +49-551/39 66 19, Fax: +49-551/39 20 28 E-mail:
[email protected]