RESEARCH Reporting of sample size calculation in randomised controlled trials: review Pierre Charles, research fellow in epidemiology, specialist registrar in internal medicine,1,2,3 Bruno Giraudeau, assistant professor of statistics,1,4,5,6 Agnes Dechartres, research fellow in epidemiology,1,2,3 Gabriel Baron, statistician,1,2,3 Philippe Ravaud, professor of epidemiology1,2,3 1
INSERM, U738, Paris, France Université Paris 7 Denis Diderot, UFR de Médecine, Paris 3 AP-HP, Hôpital Bichat, Département d’Epidémiologie, Biostatistique et Recherche Clinique, Paris 4 INSERM Centre d’Investigation Clinique 202, Tours, France 5 Université François Rabelais, Tours 6 CHRU de Tours, Tours Correspondence to: P Ravaud, Département d’Epidémiologie, Biostatistique et Recherche Clinique, Secteur Claude Bernard, Hôpital Bichat Claude Bernard, 75877 Paris, cedex 18, France
[email protected] 2
Cite this as: BMJ 2009;338:b1732 doi:10.1136/bmj.b1732
BMJ | ONLINE FIRST | bmj.com
ABSTRACT Objectives To assess quality of reporting of sample size calculation, ascertain accuracy of calculations, and determine the relevance of assumptions made when calculating sample size in randomised controlled trials. Design Review. Data sources We searched MEDLINE for all primary reports of two arm parallel group randomised controlled trials of superiority with a single primary outcome published in six high impact factor general medical journals between 1 January 2005 and 31 December 2006. All extra material related to design of trials (other articles, online material, online trial registration) was systematically assessed. Data extracted by use of a standardised form included parameters required for sample size calculation and corresponding data reported in results sections of articles. We checked completeness of reporting of the sample size calculation, systematically replicated the sample size calculation to assess its accuracy, then quantified discrepancies between a priori hypothesised parameters necessary for calculation and a posteriori estimates. Results Of the 215 selected articles, 10 (5%) did not report any sample size calculation and 92 (43%) did not report all the required parameters. The difference between the sample size reported in the article and the replicated sample size calculation was greater than 10% in 47 (30%) of the 157 reports that gave enough data to recalculate the sample size. The difference between the assumptions for the control group and the observed data was greater than 30% in 31% (n=45) of articles and greater than 50% in 17% (n=24). Only 73 trials (34%) reported all data required to calculate the sample size, had an accurate calculation, and used accurate assumptions for the control group. Conclusions Sample size calculation is still inadequately reported, often erroneous, and based on assumptions that are frequently inaccurate. Such a situation raises questions about how sample size is calculated in randomised controlled trials.
calculations must be reported and justified in published articles.1-4 The aim of an a priori sample size calculation is mainly to determinate the number of participants needed to detect a clinically relevant treatment effect.5 6 Some have asserted that oversized trials, which expose too many people to the new therapy, or underpowered trials, which may fail to achieve significant results, should be avoided.7-12 The usual conventional approach is to calculate sample size with four parameters: type I error, power, assumptions in the control group (response rate and standard deviation), and expected treatment effect.5 Type I error and power are usually fixed at conventional levels (5% for type I error, 80% or 90% for power). Assumptions related to the control group are often pre-specified on the basis of previously observed data or published results, and the expected treatment effect is expected to be hypothesised as a clinically meaningful effect. The uncertainty related to the rate of events or the standard deviation in the control group13 14 and to treatment effect could lead to lower than intended power.6 We aimed to assess the quality of reporting sample size calculation in published reports of randomised controlled trials, the accuracy of the calculations, and the accuracy of the a priori assumptions.
INTRODUCTION The importance of sample size determination in randomised controlled trials has been widely asserted, and according to the CONSORT statement these
Selection of relevant articles We included all two arm, parallel group superiority randomised controlled trials with a single primary outcome. We excluded reports for which the study design
MATERIALS AND METHODS Search strategy We searched MEDLINE via PubMed with the search terms “randomized controlled trials” and “randomised controlled trials” for articles published in six general journals with high impact factors: New England Journal of Medicine, Journal of the American Medical Association (JAMA), The Lancet, Annals of Internal Medicine, BMJ, and PLoS Medicine between 1 January 2005 and 31 December 2006. One of us (PC) screened titles and abstracts of retrieved articles to identify relevant articles, with the help of a second reviewer (AD) if needed.
page 1 of 6
RESEARCH
References (n=1070) Articles excluded on basis of title and abstract (n=696): No trials (e.g. letters, review) (n=494) Randomised trials (n=202): More than two arms (n=112) Cluster (n=39) Equivalence (n=18) Cost-efficacy (n=17) Cross-over (n=9) Factorial design (n=7) Articles selected (n=374) Articles excluded on basis of full text (n=159): Follow-up studies (n=29) More than one trial (n=1) Not randomised (n=1) Exclusion because of design: Equivalence or non-inferiority (n=35) Factorial design (n=11) More than 2 arms (n=10) Cluster (n=3) Cost-efficacy (n=2) Two randomisations (n=1) Exclusion because of primary outcome: More than one primary outcome (n=62) No primary outcome (n=4)
continuous outcomes). Any justification for assumptions made was also recorded. Observed data as reported in the results section: number of patients randomised and analysed was recorded, and results for the control group. We also noted whether the results of the trial were statistically significant for the primary outcome. In the online extra material or study design article We recorded the target sample size and all the required parameters for sample size calculation if different from those reported in the article. In the trial registration website We noted the target sample size and all the required parameters for sample size calculation. One of us (PC) independently completed all data extractions. A second member of the team (AD) reviewed a random sample of 30 articles for quality assurance. The κ statistic provided a measure of interobserver agreement. The reviewers were not blinded to the journal name and authors.
Articles for analysis (n=215)
Fig 1 | Study screening process
was factorial, cluster, or crossover. We selected the first report that presented the results for the primary outcome. We excluded follow-up studies. Data abstraction For all selected articles, we systematically retrieved and assessed the full published report of the trial, any extra material or appendices available online, the study design article, if cited, and the details of online registration of the trial, if mentioned. A standardised data collection form was generated on the basis of a review of the literature and a priori discussion and tested by the research team. We recorded the following data.
In the full text of the articles General characteristics of the studies: including the medical area, whether the trial was multicentre, the type of treatment (pharmacological, non-pharmacological, or both), the type of primary endpoint (dichotomous, time to event, continuous), and the funding source (public, private, or both). Details of the a priori sample size calculation as reported in the materials and methods section: we noted whether the sample size calculation was reported and, if so, the target sample size. We also collected all the parameters used for the calculation: type I error, one or two tailed test, type II error or power, type of test, assumptions in the control group (rate of events for dichotomous and time to event outcomes and standard deviation for continuous outcomes), and the predicted treatment effect (rate of events in the treatment group for dichotomous and time to event outcomes, mean difference or effect size [defined in appendix 1] for page 2 of 6
Data analysis Replication of sample size calculation We replicated the sample size calculation for each article that provided all the data needed for the calculation. If parameters for replicating the sample size were missing in the article and if the calculation was described elsewhere (in the online extra material or study design article) we used the parameters given in this supplemental material. If the missing values were only the α risk or whether the test was one or two tailed, we hypothesised an α risk of 0.05 with a two tailed test to replicate the calculation. Sample size calculations were replicated by one of us (PC) with nQuery Advisor version 4.0 (Statistical Solutions, Cork, Ireland). For a binary endpoint, the replication used the formulae adapted for a χ2 test or Fisher’s exact test if specified in the available data. For a time to event endpoint the replication used the formulae adapted for a log rank test, and for a continuous endpoint the replication used the formulae adapted for Student’s t test. The formulae used for the replication are provided and explained in appendix 1. If the absolute value of the standardised difference between the recalculated sample size and the reported sample size was greater than 10%, an independent statistician (GB) extracted the data from the full text independently and replicated the sample size calculation again. Any difference between the two calculations was resolved by consensus. The standardised difference between the reported sample size calculation and the replicated one is defined by the reported sample size calculation minus the recalculated sample size divided by the reported sample size calculation.
Comparisons between a priori assumptions and observed data To assess the accuracy of a priori assumptions, we calculated relative differences between hypothesised BMJ | ONLINE FIRST | bmj.com
RESEARCH
parameters for the control group reported in the materials and methods sections of articles and estimated ones reported in the results sections. We calculated relative differences for standard deviations if the outcome was continuous (standard deviation in the materials and methods section minus standard deviation in the results section divided by standard deviation in the materials and methods section) or for event rates for a dichotomous or time to event outcome (event rates in the materials and methods section minus event rates in the results section divided by event rates in the materials and methods section). The relation between the size of the trial and the difference between the assumptions and observed data was explored by use of Spearman’s correlation coefficient, and its 95% confidence interval was estimated by bootstrap. Statistical analyses were done with SAS version 9.1 (SAS Institute, Cary, NC), and R version 4.1 (Free Software Foundation’s GNU General Public License). RESULTS Selected articles Figure 1 summarises selection of articles. The electronic search yielded 1070 citations, including 281 reports of parallel group superiority randomised controlled trials with two arms. We selected 215 articles (appendix 2) that reported only one primary outcome.
Percentage of articles
Description of trials Table 1 describes the characteristics of the included studies. The median sample size of the trials was 425
25
Dichotomous and time to event outcomes
20 15 10 5 0 0
Percentage of articles
Continuous outcomes: standardised effect size
20 15 10 5 0 0
0.1 0.2 0.3 0.4 0.5 0.6 0.7 0.8 0.9 1.0 1.1 1.2 Expected effect size
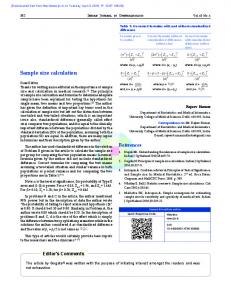
Fig 2 | Histogram of assumptions of treatment effect. For dichotomous and time to event outcomes: relative difference of event rates (larger rate minus smaller rate, divided by rate in control group). For continuous outcomes: standardised effect size. BMJ | ONLINE FIRST | bmj.com
Characteristic
N (%)
Journal of publication New Engl J Med
80 (37)
Lancet
46 (21)
JAMA
39 (18)
BMJ
36 (17)
Ann Intern Med
12 (6)
PLoS Med
2 (1)
Year of publication 2005 2006 Median number of randomised patients (IQR) Multicentre trial
109 (51) 106 (49) 425 (158-1041) 163 (76)
Intervention Pharmacological
131 (61)
Nonpharmacological
74 (34)
Both
10 (5)
Outcome Dichotomous
100 (47)
Time to event
67 (31)
Continuous
48 (22)
Funding Only public
126 (59)
Only private
49 (23)
Both public and private
38 (18)
Unclear
2 (1)
IQR=interquartile range.
(interquartile range [IQR] 158-1041), and 112 reports (52.1%) claimed significant results for the primary endpoint. Seventy-six percent were multicentre trials, with a median of 23 centres (IQR 7-59). The three most frequent medical areas of investigation were cardiovascular diseases (26%; n=56 articles), infectious diseases (11%; n=24), and haematology and oncology (10%; n=22). Interobserver agreement in extracting the data from reports was good; κ coefficients ranged from 0.76 to 1.00.
10 20 30 40 50 60 70 80 90 100 110 120 Expected treatment effect (%)
25
Table 1 | Characteristics of 215 included studies
Reporting of required parameters for a priori sample size calculation Ten articles (5%) did not report any sample size calculation. Only 113 (53%) reported all the required parameters for the calculation. Table 2 describes the reporting of necessary parameters for sample size calculation. The median of the expected treatment effect for dichotomous or time to event outcomes (relative difference of event rates) was 33.3% (IQR 24.8-50.0) and the median of the expected effect size for continuous outcomes was 0.53 (0.40-0.69) (fig 2). The design of 35 of the 215 trials (16%) was described elsewhere. In two, the primary outcome described in the report differed from that in the design article. In 31 articles (89%), the data for sample size calculation were given. For 16 articles (52%) the reporting of the assumptions differed from the design article. page 3 of 6
RESEARCH
Table 2 | Reporting of parameters required for a priori sample size calculation for the 215 articles Parameter
Reporting frequency (%)
α risk
191 (93)
0.05
183 (96)
Two tailed test
119 (65)
One tailed test
7 (4)
Unspecified
57 (31)
0.025 for one tailed test
2 (1)
Adapted for interim analyses
6 (3)
Power
200 (98)
80%
107 (54)
85%
9 (5)
90%
66 (33)
95%
4 (2)
Other values
14 (7)
Comparisons between a priori parameters and corresponding estimates in results section A comparison between the a priori assumptions and observed data was feasible for 145 of the 157 articles reporting enough parameters to recalculate the sample size and reporting the results of the authors’ calculations.
165 (81)
Justification of assumptions
81 (49)
Results from previous trial
54 (67)
Preliminary study
15 (19)
Observational data
6 (7)
Results of systematic review
2 (3)
Others
4 (5)
Assumptions for the treatment effect
186 (91)
Justification of the assumptions
50 (27)
Analogy to another trial or treatment
41 (82)
Clinical relevance
7 (14)
Observational data
1 (2)
Results of a meta-analysis
1 (2)
All parameters required for sample size calculation
113 (53)
Reporting of sample size calculation in online trial registration database Of the 215 selected articles, 113 (53%) reported registration of the trial in an online database. Among them, 87 (77%) were registered in ClinicalTrials.gov, 23 (20%) in controlled-trials.com (ISRCTN registry), and three (3%) in another database. For 96 articles (85%), an expected sample size was given in the online database and was equal to the target sample size reported in the article in 46 of these articles (48%). The relative difference between the registered and reported sample size was greater than 10% in 18 articles (19%) and greater than 20% in five articles (5%). The parameters for the sample size calculation were not stated in the online registration databases for any of the trials. Replication of sample size calculation We were able to replicate sample size calculations for 164 articles: 113 reported all the required parameters, and 51 that omitted only the α risk or whether the test was one or two tailed. We were able to compare our recalculated sample size and the target sample size for 157 articles, since seven did not report any target sample size. The sample size recalculation was equal to the authors’ target sample size for 27 articles (17%) and close (absolute value of the difference 10% different from target sample size (n=164)
Articles replicating sample size calculations