Representations for Evolutionary Algorithms
Franz Rothlauf University of Mainz D-55099 Mainz/Germany
[email protected] GECCO 2007, July 7, 2007 slides can be downloaded at http://wi.bwl.uni-mainz.de/Bilder_allgemein/rothlauf-tutorial.pdf
Scope of the Tutorial • Illustrate the influence of representations on the performance of EAs. • Illustrate the relationship between problem difficulty and used representation/operator. • Review design guidelines for high-quality representations. • Focus on some properties of representations – Redundant representations and neutral search spaces – Synonymous and non-synonymous redundancy – Locality of representations – (Exponentially scaled alleles)
Representations for Evolutionary Algorithms
Page 1
Structure of the Tutorial • A Short Introduction to Representations – Defining Representations – Representations, Operators, and Metrics – Direct and Indirect Representations • Design Guidelines for Representations • Properties of Representations – Redundant Representations and Neutral Networks – High-Locality Representations – Domino Convergence and Genetic Drift
Representations for Evolutionary Algorithms
Page 2
Defining Representations • A representation assigns genotypes to corresponding phenotypes. • Every search and optimization algorithms needs a representation. • The representation allows to represent a solution to a specific problem. • Different representations can be used for the same problem. • Performance of search algorithm depends on properties of the used representation and how suitable is the representation in the context of the used genetic operators.
A Short Introduction to Representations
Page 3
Defining Representations (2)
• There are many different representations. • Standard representations are binary, real-valued vectors, messy encodings, tree structures,... • ... and we assume that everybody has some experience at least with some of them.
A Short Introduction to Representations
Page 4
Defining Representations (3) An optimization problem f (x) can be separated into a genotypephenotype mapping fg and a phenotype-fitness mapping fp: fg (xg ) : Φg → Φp, fp(xp) : Φp → R, where f = fp ◦ fg = fp(fg (xg )). A change of fg also changes the properties of f . The genetic operators mutation and crossover are applied to xg , whereas the selection process is based on the fitness of xp. fp(xp) determines the difficulty and complexity of a problem. fg (xg ) is the used representation. There are ||Φg ||! different representations. A Short Introduction to Representations
Page 5
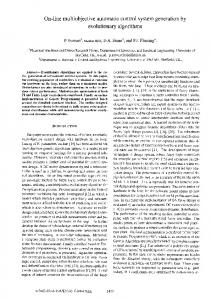
Defining Representations (4)
fitness
• Representations change the character and difficulty of optimization problems. • For example fp = xp, where xp ∈ N. • Different problem depending on the used representations (Gray versus binary).
4 3 2 binary
fitness
1 0 000 001 010 011 100 xg
4 3 2
fitness Gray
1
4
0 1
2
3
4
x p
3 2 1 0 000 001 010 011 100 xg
A Short Introduction to Representations
Page 6
Defining Representations (5)
• Phenotypic problem easy to solve for hill-climber. • When using bit-flipping GA the Gray-encoded problem is easier to solve than the binary-encoded problem. • Gray encoding induces less local optima when used on problems of practical relevance (compare Free Lunch theorem (Whitley, 2000)). • Resulting problem difficulty depends on used search method. If other search methods (e.g. other operators) are used, then problem difficulty is different (compare (Reeves, 2000)).
A Short Introduction to Representations
Page 7
Representations, Operators, Metrics Representation, metric defined on Φg and Φp, and genetic operators depend on each other and are closely related. • A representation is just a mapping from Φg to Φp. It assigns any possible xg ∈ Φg to an xp ∈ Φp. • In both search spaces, Φg and Φp, a metric is or has to be defined. The metric determines the distances between the individuals and is the basis for measuring similarities between individuals. In general, the metric used for Φp is defined by the considered problem. The metric used for Φg is determined by the used search operators. • Genotypic operators like mutation and crossover are defined based on the used metric.
A Short Introduction to Representations
Page 8
Representations, Operators, Metrics (2)
Mutation: The application of mutation to an individual results in a new individual with similar properties. There is a small distance betwen offspring and parent. Crossover: Crossover combines the properties of two or more parents in an offspring. The distance between offspring and parent should be smaller than the distance between both parents (basic idea of “geometric crossover” from (Moraglio and Poli, 2004); compare also (Surry and Radcliffe, 1996a), (Liepins and Vose, 1990), or (Rothlauf, 2002))
A Short Introduction to Representations
Page 9
Representations, Operators, Metrics (3)
Results: • Metric on Φg and used operators depend on each other. The one determines the other. • Representations transform the metric on Φg to the (problemdependent) metric on Φp. (Compare locality, causality, and distance distortion)
A Short Introduction to Representations
Page 10
Direct Representations If the genetic operators are applied directly to the phenotypes it is not necessary to specify a representation and the phenotypes are identical with the genotypes: fg (xg ) : Φg → Φg , fp(xp) : Φg → R. This means, fg is the identity function fg (xg ) = xg . Using direct representations do not neccessarily make life easier: • Design of proper operators is difficult • How can we apply specific types or EAs (like EDAs)? • Representation issues are not important any more (Φg = Φp and fg (xg ) = xg ). A Short Introduction to Representations
Page 11
Direct Representations - Genetic Programming
Representation issues are also relevant to Genetic Programming. Phenotypes: Programs, logical expressions. Genotypes: Parse trees, bitstrings, linear structures, ... Neglecting proper genotype-phenotype mappings can result in low performance of GP approaches. E.g.: Standard GP (expression tree representation and sub-tree swapping crossover) cannot solve problems where optimal solutions require very full or very narrow trees (Daida et al., 2001). This is due to problems of the representation (interplay between genotypes and used search operators) (Hoai et al., 2006).
A Short Introduction to Representations
Page 12
Indirect Representations The use of an explicite genotype-phenotype mapping has some benefits: • Specific constraints can be considered. • Standardized genetic operators with known behavior and properties can be used. • An indirect representation is necessary if problem-specific operators are either not available or difficult to design. • Representation can make problem easier by incorporating problem-specific knowledge.
A Short Introduction to Representations
Page 13
Indirect Representations - Specific Constraints Example: Tree optimization problems A tree is a fully connected graph with exactly n − 1 links (for an n node network). There are no circles in a tree. A graph can be represented by its characteristic vector. A
C
B
D
E
m 0 A-B
1 A-C
0 A-D
0 A-E
0 B-C
A Short Introduction to Representations
1 B-D
0 B-E
1 C-D
0 C-E
1 D-E
Page 14
Indirect Representations - Specific Constraints (2)
Pr¨ ufer numbers are a one-to-one mapping between trees and a sequence of integers (like other Cayley codes). A tree with n nodes is represented by a string of length n − 2 over an alphabet of n symbols.
2
Prüfer number: 2 2 3 3
1
3 4
5
6
Therefore, using Pr¨ ufer numbers allows to consider the constraint that the graph is a tree (For other representations repair operators are necessary).
A Short Introduction to Representations
Page 15
Indirect Representations - Standardized Operators • When mapping many different types of phenotypes on only a few types of different genotypes (binary, integer, or continuous representations), it is possible to use standardized operators. • Behavior of EAs for standard representations like binary (simple GAs) or continuous (evolution strategies) representations well understood. • Mapping phenotypes on binary genotypes allows the use of schemata and effective linkage learning GAs (under the assumption that the problem still remains decomposable and that binary encodings allow a natural encoding of the problem).
A Short Introduction to Representations
Page 16
Indirect Representations - Problem-specific Operators
• Developing of problem-specific operators is difficult and often additional repair mechanisms must be used to ensure a valid solution. • For some real-world problems there are no problem-specific operators available.
(from (Raidl, 2000))
A Short Introduction to Representations
Page 17
Indirect Representations - Problem-specific Operators (2)
For some types of problems no problem-specific operators exist that can be applied to direct representations.
A Short Introduction to Representations
Page 18
Indirect Representations - Problem-specific Knowledge Incorporating problem-specific knowledge in the representations to increase GA performance: • Increase the initial supply of solutions that are similar to the optimal solution. • Use high-locality representations for easy problems. • Consider specific properties of the optimal solution (e.g. stars and trees). • Use representations that make a problem easier for a specific optimization method.
A Short Introduction to Representations
Page 19
• A Short Introduction to Representations • Design Guidelines for Representations • Properties of Representations – Redundant Representations and Neutral Networks – High-Locality Representations – Domino Convergence and Genetic Drift
Design Guidelines for Representations
Page 20
Goldberg’s Recommendations
• Principle of meaningful building blocks: The schemata should be short, of low order, and relatively unrelated to schemata over other fixed positions. • Principle of minimal alphabets: The alphabet of the encoding should be as small as possible while still allowing a natural representation of solutions (qualified by (Goldberg, 1991)) from (Goldberg, 1989))
Design Guidelines for Representations
Page 21
Goldberg’s Recommendations (2)
• The recommendations caused a lot of critics (Radcliffe, 1997; Fogel and Stayton, 1994). • What is a natural representation of a problem? (For example, is using binary representations for encoding real-valued phenotypes a natural representation?) • Principles mainly aimed at binary representations and crossoverbased GAs that process schemata. Not big help for other search methods like evolution strategies or evolutionary programming as these search methods do not process schema.
Design Guidelines for Representations
Page 22
Radcliffe’s Recommendations Representation and operators belong together and can not be separated from each other (Radcliffe, 1992). Design of representation-independent evolutionary algorithms is possible if the following properties are considered (Surry and Radcliffe, 1996b): • Respect: Offspring produced by recombination are members of all formae to which both their parents belong. • Transmission: Every gene is set to an allele which is taken from one of the parents. • Assortment: Offspring can be formed with any compatible characteristics taken from the parents. • Ergodicity: Iterative use of operators allow to reach any point in the search space. Design Guidelines for Representations
Page 23
Palmer’s Recommendations • An encoding should be able to represent all possible phenotypes. • An encoding should be unbiased in the sense that all possible individuals are equally represented in the set of all possible genotypic individuals. • An encoding should encode no infeasible solutions. • The decoding of the phenotype from the genotype should be easy. • An encoding should possess locality. Small changes in the genotype should result in small changes in the phenotype (compare statements about metric). from (Palmer, 1994))
Design Guidelines for Representations
Page 24
Ronald’s Recommendations
• Encodings should be adjusted to a set of genetic operators in a way that the building blocks are preserved from the parents to the offspring (Fox and McMahon, 1991). • Encodings should minimize nonlinearities in fitness functions (Beasley et al., 1993). This means, representations should make the problem easier (for local search methods!). • Feasible solutions should be preferred.
Design Guidelines for Representations
Page 25
Ronald’s Recommendations (2)
• The problem should be represented at the correct level of abstraction. • Encodings should exploit an appropriate genotype-phenotype mapping process if a simple mapping to the phenotype is not possible. • Isomorphic forms, where the phenotype of an individual is encoded with more than one genotype, should not be used. from (Ronald, 1997))
Design Guidelines for Representations
Page 26
Design Guidelines - Summary
• Based on observations for specific test problems there are some common, fuzzy ideas about what is a good representation. • Recommendations too general to be helpful for designing or evaluating representations. • There is a lack of analytical models describing the influence of representations on EAs. • To verify (or reject) observations analytical models are necessary.
Design Guidelines for Representations
Page 27
• A Short Introduction to Representations • Design Guidelines for Representations • Properties of Representations – Redundant Representations and Neutral Networks – High-Locality Representations – Domino Convergence and Genetic Drift
Redundant Representations
Page 28
Redundant Representations
Representations are redundant if the number of genotypes is larger than the number of phenotypes. • Using redundant representations fg means changing f = fp(fg ). There are additional plateaus in the fitness landscape. • Redundant representations are more “inefficient” encodings which use a higher number of alleles but do not increase the amount of encoded information. • Redundant representations are not an invention of AI researchers but are commonly used in nature.
Redundant Representations
Page 29
Redundant Representations (2)
There are different opinions regarding the influence of redundant representation on the performance of EAs. • Redundant representations reduce EA performance due to loss of diversity (Davis, 1989; Eshelman and Schaffer, 1991; Ronald et al., 1995) • Redundant representations increase EA performance (Gerrits and Hogeweg, 1991; Cohoon et al., 1988; Julstrom, 1999)
Redundant Representations
Page 30
Redundant Representations (3) • Large amount of work considers the neutral theory (Kimura, 1983). This theory assumes that not natural selection fixing advantageous mutations but the random fixation of neutral mutations is the driving force of molecular evolution. • Following these ideas redundant representations (neutral networks) are used in EAs with great enthusiasm. • There is hope that increasing the evolvability of a system also increases the performance of the system (Barnett, 1997; Barnett, 1998; Shipman, 1999; Shipman et al., 2000b; Shackleton et al., 2000; Shipman et al., 2000a; Ebner et al., 2001; Smith et al., 2001c; Smith et al., 2001a; Smith et al., 2001b; Barnett, 2001; Yu and Miller, 2001; Yu and Miller, 2002; Toussaint and Igel, 2002).
• (Knowles and Watson, 2002) showed exemplarily that this is not true! Redundant Representations
Page 31
Redundant Representations (4)
Neutral Network: Set of genotypes connected by single-point mutations that map to the same phenotype.
from (Ebner et al., 2001)
Redundant Representations
Page 32
Redundant Representations (5) Benefits of Neutral Networks • Population can drift along these neutral networks. • Reducing the chance of being trapped in sub-optimal solutions. • Population is quickly able to recover after a change has occurred. • Evolvability of the system increases. Problems • Higher evolvability → Randomization of search • Genetic drift? Redundant Representations
Page 33
In the following slides we study • how to distinguish between synonymously and non-synonymously redundant encodings (Rothlauf and Goldberg, 2003), • how synonymous redundancy changes the performance of EAs (quantitative predictions) (Rothlauf and Goldberg, 2003), and • the properties of non-synonymously redundant representations (Choi and Moon, 2003; Choi and Moon, 2007).
Redundant Representations
Page 34
Synonymously versus Non-synonymously Redundant Representations When using redundant representations it can be distinguished between: • Synonymously redundant representations: All genotypes that encode the same phenotype are similar to each other. • Non-synonymously redundant representations: Genotypes that encode the same phenotype are not similar to each other.
Redundant Representations
x Φp
o fg
xx x x xx o o oo x o Φg o oo o
o x ox x xxo o oo x o Φ o o x
synonymous
non−synonymous
g
Page 35
Synonymously versus Non-synonymously Redundant Rep. (2)
c l Φp
• Non-synonymously redundant representations do not allow c c guided search. c c c c l • EA search becomes random. l l • Similar effect as low locality repl Φg resentations.
c
x
x
l Φp
o
o
fg
fg x
x x x
l l o
x l
o
o
x
x c c
o
o o
l
Φg
synonymous
x l l x o o
c
o
x
c
x
o o
c
o x
l
non−synonymous
Effects of small mutation steps
Redundant Representations
l
Page 36
c
Synonymously versus Non-synonymously Redundant Rep. (3) • (Choi and Moon, 2003) defined uniformly redundant encodings that are maximally non-synonymous and proved that such encodings induce uncorrelated search spaces (fitnessdistance correlation is equal to zero). • For a maximally non-synonymous redundant encoding the expected distance between any two genotypes that correspond to the same phenotype is invariant and about equal to the problem size n. • Normalization (transformation of one parent to be consistent with the other) can transform uncorrelated search spaces into correlated search spaces with higher locality (Choi and Moon, 2007).
Redundant Representations
Page 37
Synonymously versus Non-synonymously Redundant Rep. (4) Some selected examples for problems with maximally non-synonymous redundant encodings (Choi and Moon, 2007): • Partitioning problems in graphs: k subsets are represented by integers from 0 to k − 1 where nodes are contained in the same group if they are represented by the same number. Each phenotype is represented by k! different genotypes. • HIFF problems (Watson et al., 1998): binary encoding where each phenotype is represented by a pair of bitwise complementary genotypes. • TSP: Order-based crossover, in which vertices are indexed from 1 to n and each tour is represented by a permutation of the vertex indices. Each phenotype is represented by 2n genotypes. Redundant Representations
Page 38
Modeling Redundant Representations
Synonymously redundant representations can be described using log(|Φ |)
• order of redundancy kr = log(|Φp|) and g • over-, resp. underrepresentation r of the optimal solution due to the problem representation fg . When using the notion of BBs and binary representations: k
• kr = kgp • r: Number of genotypic BBs of order kg that represent the optimal phenotypic BB of order kp.
Redundant Representations
Page 39
Modeling Redundant Representations (2)
Example 1:
00 10 00 10
00, 00, 10, 10,
genotypes xg 00 01, 01 00, 10 01, 11 00, 01 11, 00 11, 10 11, 11 10,
Redundant Representations
01 11 01 11
01 01 11 11
xp 0 0 1 0 0 1 1 1
• k = 2 (order of phenotypic BBs) • kr = 2 (One allele of a phenotype is represented using two alleles of a genotype) • Uniform redundancy: r = 4 (the best BB (e.g.. xp = 11) is represented by four genotypic BBs)
Page 40
Modeling Redundant Representations (3) Example 2: genotypes xg 000, 001, 010, 100, 101, 110, 011 111
xp 0 1
• k = 1 (order of phenotypic BBs) • kr = 3 (One phenotypic allele is represented using three genotypic alleles) • Non-uniform redundancy: r = 1 (best BB (xp = 1) is represented by one genotypic BB (xg = 111))
Redundant Representations
Page 41
Population Sizing for GAs The Gambler’s ruin model (Feller, 1957) can be used for modeling the iterated decision making in GAs. A gambler with initial stake x0 wishes to increase his funds to a total of N units by making a sequence of bets against a gaming house. Each bet has fixed probability p of winning (q = 1 − p of losing), and we wish to know the probability of succeeding (getting N units) or failing (losing all units). Following (Harik et al., 1997) the probability that a GA with a population size N converges after tconv generations to the correct solution is 1 − (q/p)x0 Pn = 1 − (q/p)N
Redundant Representations
Page 42
Population Sizing for GAs (2) After some calculations we get:
N ≈
σBB k−1 −2 ln(α)
√
πm0
d
N is the necessary population size, α = 1 − Pn the probability Pn that the optimal BB cannot be found (probability of failure) and k is the order of the BBs. σBB (variance of BBs), d (fitness difference between best and second best BB), m0 = m − 1 (number of BBs) and k are problem-dependent.
Redundant Representations
Page 43
Population Sizing for GAs (3)
proportion of correct BBs (1−alpha)
1 0.95 0.9 0.85 0.8 0.75 prediction gamblers ruin model experimental results 0.7 10
15
20
25
30
35
40
45
50
55
60
population size N
150-bit one-max problem (k = 1, σBB = 0.25, d = 1 and m = 150)
Redundant Representations
Page 44
Population Sizing for GAs (4)
proportion of correct BBs (1−alpha)
1
0.8
0.6
prediction gamblers ruin model experimental results 0.4 10
20
30
40
50
60
70
80
90
100
population size N
Ten concatenated 3-bit deceptive traps (k = 3, σBB = 1, d = 1 and m = 10)
Redundant Representations
Page 45
Population Sizing for GAs (5)
Now we have to ask how the redundancy of a representation influences GA performance?
Observation: Redundant representation change the initial supply x0 of BBs. For binary problem representation: r x0 = N kk , 2 r where N is the population size.
Redundant Representations
Page 46
Population Sizing for GAs (6)
When using synonymously redundant representations the existing model can be extended:
N ≈−
2kr k−1 r
√
σBB πm0 ln(α) d
The population size N that is necessary to find ¶ optimal soµ the kr 2 lution with probability Pn = 1 − α goes with O r .
Redundant Representations
Page 47
Population Sizing for GAs (7) Conclusions from this model: • Redundant representations can change the performance of EAs. • If representations are synonymously redundant: – Uniformly redundant representations do not change the performance of EAs! – If the optimal BB is overrepresented GA performance increases. – If the optimal BB is underrepresented GA performance decreases. • Redundant representations can not be used systematically if there is no problem-specific knowledge! Redundant Representations
Page 48
Population Sizing for GAs (8)
What must be considered when using redundant representations? 1. How does the used representation change the size of the search space? 2. Is the representation synonymously redundant? 3. Are some solutions overrepresented? Examining these properties allows the user to increase the performance of EAs!
Redundant Representations
Page 49
In the following slides we show how this theory can be used for predicting EA performance when using the trivial voting mapping for binary problems.
Redundant Representations
Page 50
Trivial Voting Mapping • The trivial voting mapping (TVM) assigns binary phenotypes to binary genotypes. • One bit of the phenotype is represented by kr genotypic bits. • In general, a phenotypic bit is 0 if less than u genotypic bits are zero. If more than u genotypic bits are 1 then the phenotypic bit is 1. • For u = kr /2 the value of the phenotypic bit is determined by the majority of the genotypic bits (majority vote) In general: p
xi =
0 if 1 if
Pkr −1 g j=0 xkr i+j < u Pkr −1 g j=0 xkr i+j ≥ u,
where u ∈ {1, . . . , kr }. Redundant Representations
Page 51
Trivial Voting Mapping (2)
Examples: genotypes xg 000, 001, 010, 100 110, 101, 011, 111
xp 0 1
genotypes xg 000 001, 010, 100,110, 101, 011, 111
Redundant Representations
• k=1 • kr = 3 • u=2
xp 0 1
• k=1 • kr = 3 • u=1
Page 52
Trivial Voting Mapping (3)
1
proportion of correct BBs
0.9
0.8
0.7 prediction kr=1 (no redundancy) kr=1 (no redundancy) TVM (r=2, uniform redundancy) prediction TVM with u=2 (r=1) TVM with u=2 (r=1) prediction TVM with u=1 (r=3) TVM with u=1 (r=3)
0.6
0.5 10
20
30
40
50
60
70
population size N
Experimental and theoretical results of the proportion of correct BBs on a 150-bit one-max problem using the trivial voting mapping for kr = 2.
Redundant Representations
Page 53
Trivial Voting Mapping (4) 1
proportion of correct BBs
0.9 0.8 0.7 0.6 prediction kr=1 (no redundancy) kr=1 (no redundancy) TVM (u=2, r=4, uniform redundancy) prediction TVM with u=3 (r=1) TVM with u=3 (r=1) prediction TVM with u=1 (r=7) TVM with u=1 (r=7)
0.5 0.4 0.3 10
20
30
40
50
60
70
population size N
Experimental and theoretical results of the proportion of correct BBs on a 150-bit one-max problem using the trivial voting mapping for kr = 3.
Redundant Representations
Page 54
Trivial Voting Mapping (5)
1 prediction kr=1 (no redundancy) kr=1 (no redundancy) TVM (r=8, uniform redundancy) prediction TVM with u=2 (r=1) TVM with u=2 (r=1) prediction TVM with u=1 (r=27) TVM with u=1 (r=27)
proportion of correct BBs
0.8
0.6
0.4
0.2
0 10
20
30
40
50
60
70
80
90
100
population size n
Experimental and theoretical results of the proportion of correct BBs for ten concatenated 3-bit deceptive traps and kr = 2.
Redundant Representations
Page 55
Trivial Voting Mapping (6)
1
proportion of correct BBs
0.8
prediction kr=1 (no redundancy) kr=1 (no redundancy) TVM (u=2, r=64, uniform redundancy) prediction TVM with u=3 (r=1) TVM with u=3 (r=1) prediction TVM with u=1 (r=343) TVM with u=1 (r=343)
0.6
0.4
0.2
0 10
20
30
40
50
60
70
80
90
100
population size n
Experimental and theoretical results of the proportion of correct BBs for ten concatenated 3-bit deceptive traps and kr = 3.
Redundant Representations
Page 56
Redundant Representations - Summary • There are theoretical models that allow us to predict the expected GA performance when using redundant representations (N = O(2kr /r)). • There are guidelines for the design of redundant representations: – Do not use non-synonymously redundant representations! – If you use redundant representations you have to investigate: ∗ How does the representation change the size of the search space? ∗ Are solutions similar to the optimal solution overrepresented? – If there is no knowledge about the optimal solution use a uniformly redundant representation. Redundant Representations
Page 57
• A Short Introduction to Representations • Design Guidelines for Representations • Properties of Representations – Redundant Representations and Neutral Networks – High-Locality Representations – Domino Convergence and Genetic Drift
High-locality representations
Page 58
Locality • Representations (genotype-phenotype mappings) can change the structure of the neighborhood and the structure of the fitness landscapes. • Each neighbor can be reached directly by a move (mutation, crossover, etc.). Therefore, the neighborhood structure depends on the used operator and the used metric. • The set of neighbors can be different for the genotypes and phenotypes. • The distance between two individuals is determined by the number of moves between both individuals.
High-locality representations
Page 59
Locality (2)
The locality of a representation describes how well neighboring genotypes correspond to neighboring phenotypes. Therefore, the locality of a representation is high, if neighboring genotypes correspond to neighboring phenotypes. Locality, causality, and distance distortion describe how well the metric on Φp fits to the metric on Φg . If they fit well the locality is high. Representations fg that change the distances between corresponding genotypes and phenotypes modify the difficulty of the problem (difficulty(f ) 6= difficulty(fp)).
High-locality representations
Page 60
Locality - Different Types of Phenotype-Fitness Mappings (Jones and Forrest, 1995) 1. Class1: Fitness difference to optimal solution is positively correlated with the distance to optimal solution. Structure of the search space guides local search methods to the optimal solution → easy for mutation-based search. 2. Class 2: No correlation between fitness difference and distance to optimal solution. Structure of the search space provides no information for guided search methods → difficult for guided search methods. 3. Class 3: Fitness difference is negatively correlated to distance to optimal solution. Structure of search space misleads local search methods to sub-optimal solutions → deceptive problems.
High-locality representations
Page 61
|f opt −f|
|f opt −f|
|f opt −f|
Locality - Different Types of Phenotype-Fitness Mappings(2)
d pos. correlation
d uncorrelated
d neg. corelation
performance mutation− based search random search
pos. correlation (class 1)
High-locality representations
no correlation (class 2)
neg. correlation (class 3)
problem difficulty
Page 62
a
b
c
d
e
f
g
h
i
j
k
l
high locality phenotypic search space
phenotypic search space
Locality - Low versus High-Locality Representations low locality
α
b
c
d
α
k
e
f
g
h
i
f h
b
i
j
k
l
e
j
l
A B C D
L
A C I
E
F
G H
D F
K H
I
J
K L
E
B G
high locality
J
low locality
Influence of high versus low-locality representations on genotype-phenotype mappings
High-locality representations
g
fg genotypic search space
genotypic search space
fg
c
A B C D E
F
G H
I
J
K L
Effect of mutation for high versus low-locality representations
Page 63
d
Locality - Low versus High-Locality Representations(2)
Class 1: High-locality representations preserve difficulty of problem. Easy problems remain easy for guided search.
Class 2: High-locality representations preserve difficulty of problem. Problems remain difficult for guided search.
Low-locality representations make easy problems more difficult. Resulting problem becomes of class 2.
Low-locality representations on average do not change class of problem. Problems remain difficult.
High-locality representations
Class 3: High-locality representations preserve deceptiveness of problem. Traps remain traps. Low-locality representations transform problem to class 2 problem. Deceptive problems become more easy to solve for guided search. Page 64
Locality - An Example • Both, genotypes and phenotypes are binary. • We use the bit-flipping operator as a move (Hamming distance). • One-max problem (class 1). • All building blocks (regarding genotypes and phenotypes) are of size k = 1. Therefore, problem is easy for selectorecombinative GAs.
High-locality representations
genotypes
phenotypes
000
000
001
001
010
010
011
011
100
100
101
101
110
110
111
111 fg
fitness 0 1 2 3 fp
Page 65
Locality - An Example (2)
genotypes
• A representation with lower locality. • The neighborhood structure changes. • Not all genotypic building blocks are of size 1. Although, fp remains unchanged, f becomes more difficult.
phenotypes
000
000
001
001
010
010
011
011
100
100
101
101
110
110
111
111 fg
High-locality representations
fitness 0 1 2 3 fp
Page 66
Locality - An Example (3) • High-locality representation. • Problem easy for selectorecombinative GAs.
fitness 3 2 1 0 000 001 010 011 100 101 110 111 x fitness 3 2 1 0 000 001 010 011 100 101 110 111 x g
High-locality representations
g
• Different fitness for genotypes 000 and 001. • Problem more difficult for selectorecombinative GAs. • Neighborhood not preserved by representation. Page 67
Locality - An Example (4)
Neighborhood structure of the genotypes:
Resulting neighborhood structure of the phenotypes:
000
000
001
010
100
001
010
100
011
101
110
011
101
110
111
High-locality representations
111
Page 68
Comparing Representations
• We compare the performance of selectorecombinative GAs over all different representations for the one-max problem. • When focusing on binary bitstrings and assigning l-bit genotypes to l-bit phenotypes, there are 2l ! different representations. • For l = 3 there are 8 different genotypes, resp. phenotypes, and 8! = 40, 320 different representations. • 36 different representations result in the same overall problem f (for the one-max problem).
High-locality representations
Page 69
Comparing Representations (2)
• To reduce problem complexity, xg = 111 is always assigned to xp = 111. Therefore, there are 7! = 5040 different representations. • We concatenate ten 3-bit problems and use a GA with tournament selection of size 2, uniform crossover, and N = 16.
High-locality representations
Page 70
frequency (number of representations)
Comparing Representations (3) 160 140 120 100 80 60 40 20 0 5
6
7
8
9
number of correct sub-problems
frequency (number of representations)
20 all possible genotype-phenotype mappings 32 high-locality representations 15
10
5
0 8.6
8.7
8.8
8.9
9
9.1
9.2
number of correct sub-problems
High-locality representations
Page 71
Comparing Representations (4)
phenotypes
fitness
000
0
001 010
1
011 100
2
101 110
3
111 fp
High-locality representations
• We compare the performance of selectorecombinative GAs over all different representations for the deceptive trap problem. • To reduce problem complexity, xg = 111 is always assigned to xp = 111. Therefore, there are 7! = 5040 different representations. • We concatenate ten 3-bit problems and use a GA with tournament selection of size, uniform crossover, and N = 16.
Page 72
Comparing Representations (5) frequency (number of representations)
160 140 120 100 80 60 40 20 0
frequency (number of representations)
4.5 20
5
5.5
6
6.5
7
7.5
8
8.5
number of correct sub-problems
all possible genotpye-phenotype mappings 32 high-locality representations
15
10
5
0 4.5
4.6
4.7
4.8
4.9
5
5.1
5.2
number of correct sub-problems
High-locality representations
Page 73
High-Locality Representations - Summary
• When using high locality representations, genotypic neighbors correspond to phenotypic neighbors. • High locality representations do not change the structure and difficulty of the problem. – Easy problems remain easy. – Difficult problems remain difficult. • Locality depends on the used distance metrics which depend on the used operators.
High-locality representations
Page 74
• A Short Introduction to Representations • Design Guidelines for Representations • Properties of Representations – Redundant Representations and Neutral Networks – High-Locality Representations – Domino Convergence and Genetic Drift
Domino Convergence and Genetic Drift
Page 75
Exponentially Scaled Alleles
The alleles of a genotype can be of different importance for the construction of the phenotype. In many real-world problems it is unclear if the genotypic alleles are uniformly or non-uniformly scaled. A GA solves the most important alleles first and continues with lower salient alleles (domino convergence) Genotypic alleles that have little influence on the phenotype are randomly fixed due to genetic drift.
Domino Convergence and Genetic Drift
Page 76
Domino Convergence The contribution of the genotypic alleles to the construction of the phenotype can be either uniformly or non-uniformly scaled. • Uniformly scaled representations: – Unary encoding, Gray encoding – All alleles are solved implicitly in parallel. • Exponentially scaled representations: – Binary encoding – The alleles are solved step by step and domino convergence occurs.
Domino Convergence and Genetic Drift
Page 77
Domino Convergence (2) Pl−1 l−i−1 can be decomposed in x 2 i i=0
The BinInt problem: f (x) =
Pl−1 i • the exponentially scaled representation fg (xg ) = i=0 2 xg,i,
• and the problem fp(xp) = xp.
When using GAs and non-uniformly scaled representations domino convergence occurs. high salience alleles
low salience alleles
11111111 00000000 00000000 11111111 00000000 11111111 00000000 11111111 0000000011111111 11111111 00000000 0000000011111111 11111111 00000000 already converged
1
not yet converged
λ
Domino Convergence and Genetic Drift
ls
string position
Page 78
Domino Convergence (3)
Domino convergence changes the dynamics of selectorecombinative GAs. Time complexity (neglecting genetic drift): Uniformly scaled alleles const sel. √ int. prop. sel. O( l) O(l ln(l))
Exponentially scaled alleles const sel. int. prop. sel. O(l) O(2l )
Exponentially scaled representations result in longer GA runs!
Domino Convergence and Genetic Drift
Page 79
Domino Convergence (4)
correct alleles
Comparison of time complexity using constant selection intensity:
ls m
texp : time for solving one exponentially scaled allele m: number of exponentially scaled building blocks
2m
exponentially scaled uniformly scaled
m
ls : length of one exponentially scaled building block
texp 2texp
ls t exp
ls t exp
Domino Convergence and Genetic Drift
generations
Page 80
Genetic Drift
If there is no selection pressure, genetic drift occurs. The random process of sampling individuals can result in in a population with only one type of allele.
from: (Hartl and Clark, 1997, p. 271)
Domino Convergence and Genetic Drift
Page 81
Genetic Drift (2)
from: (Hartl and Clark, 1997, p. 274)
Domino Convergence and Genetic Drift
Page 82
Genetic Drift (3)
from: (Hartl and Clark, 1997, p. 281)
Domino Convergence and Genetic Drift
Page 83
Genetic Drift (4)
The drift time – using random sampling with replacement – in GAs is proportional to the population size N : tdrif t = cN, where c depends on the initial proportion. from: (Lobo et al., 2000)
Domino Convergence and Genetic Drift
Page 84
Genetic Drift and Domino Convergence
10
generations
8
genetic drift proportionate selection
6 4
tournament selection
2 0 0
2
4
6
8
10
Combining domino convergence and drift models: • Drift models predict a constant generations upper boundary. • Lower salient alleles are fixed randomly due to genetic drift.
gene position x from: (Thierens et al., 1998)
Domino Convergence and Genetic Drift
Page 85
Genetic Drift and Domino Convergence - Empirical Results
m = 1, ls = 5
proportion of correct alleles
1
Simple GA with uniform crossover, no mutation, and tournament selection of size 2 without replacement.
0.95 0.9
Approx. drift model: Population sizing model based on the drift model of (Kimura, 1964).
0.85 0.8
exp. results approx. drift model stair-case drift model no drift model
0.75 0.7 5
10
15
20
25
number of indidividuals n
Domino Convergence and Genetic Drift
30
Stair-case drift model: Solving time for one exp. scaled allele texp stays 35 constant. Unsolved alleles remain in their initial state for t < tdrif t .
Page 86
proportion of correct alleles
Genetic Drift and Domino Convergence - Empirical Results
m = 10, ls = 5
1 0.95 0.9 0.85 0.8 0.75 0.7 0.65 0.6 0.55 0.5
Simple GA with uniform crossover, no mutation, and tournament selection of size 2 without replacement.
exp. results approx. drift model stair-case drift model no drift model
5
Approx. drift model: Population sizing model based on the drift model of (Kimura, 1964).
Stair-case drift model: Solving time for one exp. scaled allele texp stays 10 15 20 25 30 35 40 45 50 constant. Unsolved alleles remain in their initial state for t < tdrif t .
number of indidividuals n
Domino Convergence and Genetic Drift
Page 87
Exponentially scaled Representations - Summary
• Representations using exponentially scaled alleles change the dynamics of selectorecombinative GAs. – Exponentially scaled representations allow to find rough approximations after short time. – Uniformly scaled representations allow to find the best solution in shorter overall time. • Due to genetic drift GAs using exponentially scaled representations need a larger population size.
Domino Convergence and Genetic Drift
Page 88
Take home message • Representations are important! • Representations change the difficulty of a problem! • Distinguish carefully between genotypes and phenotypes! • Representations that are non-synonymously redundant are no good idea. • Synonymously redundant representations can help you if you have problem-specific knowledge! • Representations should have high locality if you want to solve easy problems. • (Scaling of alleles changes dynamics of search. Non-uniformly scaled alleles are fast, but inaccurate.)
Take home message
Page 89
Last remark
Thanks for your attention and patience!
Further reading: Rothlauf, Franz (2006). Representations for Genetic and Evolutionary Algorithms. Springer, Berlin, 2nd edition.
Last remark
Page 90
References Barnett, L. (1997). Tangled webs: Evolutionary dynamics on fitness landscapes with neutrality. Master’s thesis, School of Cognitive Sciences, University of East Sussex, Brighton. Barnett, L. (1998). Ruggedness and neutrality: The NKp family of fitness landscapes. In Adami, C., Belew, R. K., Kitano, H., and Taylor, C., editors, Proceedings of the 6th International Conference on Artificial Life (ALIFE-98), pages 18–27, Cambridge, MA, USA. MIT Press. Barnett, L. (2001). Netcrawling - optimal evolutionary search with neutral networks. In Proceedings of the 2001 Congress on Evolutionary Computation CEC01, pages 30– 37, Piscataway, NJ. IEEE Press. Beasley, D., Bull, D. R., and Martin, R. R. (1993). Reducing epitasis in combinatorial problems by expansive coding. In Forrest, S., editor, Proceedings of the Fifth International Conference on Genetic Algorithms, pages 400–407, San Mateo, CA. Morgan Kaufmann. Choi, S.-S. and Moon, B.-R. (2003). Normalization in genetic algorithms. In et al., E. C.-P., editor, Proceedings of the Genetic and Evolutionary Computation Conference 2003, pages 862–873, Heidelberg. Springer. Choi, S.-S. and Moon, B.-R. (2007). Normalization in genetic algorithms. forthcoming in IEEE Transactions on Evolutionary Computation. Cohoon, J. P., Hegde, S. U., Martin, W. N., and Richards, D. (1988). Floorplan design using distributed genetic algorithms. In IEEE International Conference on Computer Aided-Design, pages 452–455. IEEE.
References
Page 91
Daida, J. M., Bertram, R., Stanhope, S., Khoo, J., Chaudhary, S., Chaudhri, O., and Polito, J. (2001). What makes a problem GP-hard? analysis of a tunably difficult problem in genetic programming. Genetic Programming and Evolvable Machines, 2(2):165–191. Davis, L. (1989). Adapting operator probabilities in genetic algorithms. In Schaffer, J. D., editor, Proceedings of the Third International Conference on Genetic Algorithms, pages 61–69, San Mateo, CA. Morgan Kaufmann. Ebner, M., Langguth, P., Albert, J., Shackleton, M., and Shipman, R. (2001). On neutral networks and evolvability. In Proceedings of the 2001 Congress on Evolutionary Computation CEC2001, pages 1–8, COEX, World Trade Center, 159 Samseong-dong, Gangnam-gu, Seoul, Korea. IEEE Press. Eshelman, L. J. and Schaffer, J. D. (1991). Preventing premature convergence in genetic algorithms by preventing incest. In Belew, R. K. and Booker, L. B., editors, Proceedings of the Fourth International Conference on Genetic Algorithms, pages 115–122, San Mateo, CA. Morgan Kaufmann. Feller, W. (1957). An Introduction to Probability Theory and its Applications, volume 1. John Wiley & Sons, New York, 1st edition. Fogel, D. B. and Stayton, L. C. (1994). On the effectiveness of crossover in simulated evolutionary optimization. BioSystems, 32:171–182. Fox, B. R. and McMahon, M. B. (1991). Genetic operators for sequencing problems. In Rawlins, G. J. E., editor, Foundations of Genetic Algorithms, pages 284–300, San Mateo, CA. Morgan Kaufmann.
Gerrits, M. and Hogeweg, P. (1991). Redundant coding of an NP-complete problem allows effective Genetic Algorithm search. In Schwefel, H.-P. and M¨ anner, R., editors, Parallel Problem Solving from Nature, pages 70–74, Berlin. Springer-Verlag. Goldberg, D. E. (1989). Genetic algorithms in search, optimization, and machine learning. Addison-Wesley, Reading, MA. Goldberg, D. E. (1991). Real-coded genetic algorithms, virtual alphabets, and blocking. Complex Systems, 5(2):139–167. (Also IlliGAL Report 90001). Harik, G. R., Cant´ u-Paz, E., Goldberg, D. E., and Miller, B. L. (1997). The gambler’s ruin problem, genetic algorithms, and the sizing of populations. In B¨ ack, T., editor, Proceedings of the Forth International Conference on Evolutionary Computation, pages 7–12, New York. IEEE Press. Hartl, D. L. and Clark, A. G. (1997). Principles of population genetics. Sinauer Associates, Sunderland, Massachusetts, 3rd edition. Hoai, N. X., BobMcKay, R. I., and Essam, D. L. (2006). Representation and structural difficulty in genetic programming. IEEE Trans. Evolutionary Computation, 10(2):157– 166. Jones, T. and Forrest, S. (1995). Fitness distance correlation as a measure of problem difficulty for genetic algorithms. Proceedings of the Sixth International Conference on Genetic Algorithms, pages 184–192.
Julstrom, B. A. (1999). Redundant genetic encodings may not be harmful. In Banzhaf, W., Daida, J., Eiben, A. E., Garzon, M. H., Honavar, V., Jakiela, M., and Smith, R. E., editors, Proceedings of the Genetic and Evolutionary Computation Conference: Volume 1, page 791, San Francisco, CA. Morgan Kaufmann Publishers. Kimura, M. (1964). Diffusion models in population genetics. J. Appl. Prob., 1:177–232. Kimura, M. (1983). The Neutral Theory of Molecular Evolution. Cambridge University Press. Knowles, J. D. and Watson, R. A. (2002). On the utility of redundant encodings in mutationbased evolutionary search. In Merelo, J. J., Adamidis, P., Beyer, H.-G., FernandezVillacanas, J.-L., and Schwefel, H.-P., editors, Parallel Problem Solving from Nature, PPSN VII, pages 88–98, Berlin. Springer-Verlag. Liepins, G. E. and Vose, M. D. (1990). Representational issues in genetic optimization. Journal of Experimental and Theoretical Artificial Intelligence, 2:101–115. Lobo, F. G., Goldberg, D. E., and Pelikan, M. (2000). Time complexity of genetic algorithms on exponentially scaled problems. In Whitley, D., Goldberg, D. E., Cant´ u-Paz, E., Spector, L., Parmee, L., and Beyer, H.-G., editors, Proceedings of the Genetic and Evolutionary Computation Conference 2000, pages 151–158, San Francisco, CA. Morgan Kaufmann Publishers. Moraglio, A. and Poli, R. (2004). Topological interpretation of crossover. In Deb, Kalyanmoy et al., editor, gecco2004, pages 1377–1388, Heidelberg. Springer.
Palmer, C. C. (1994). An approach to a problem in network design using genetic algorithms. unpublished PhD thesis, Polytechnic University, Troy, NY. Radcliffe, N. J. (1992). Non-linear genetic representations. In M¨ anner, R. and Manderick, B., editors, Parallel Problem Solving from Nature- PPSN II, pages 259–268, Berlin. Springer-Verlag. Radcliffe, N. J. (1997). Theoretical foundations and properties of evolutionary computations: schema processing. In B¨ ack, T., Fogel, D. B., and Michalewicz, Z., editors, Handbook of Evolutionary Computation, pages B2.5:1–B2.5:10. Institute of Physics Publishing and Oxford University Press, Bristol and New York. Raidl, G. R. (2000). An efficient evolutionary algorithm for the degree-constrained minimum spanning tree problem. In Proceedings of 2000 IEEE International Conference on Evolutionary Computation, pages 43–48, Piscataway, NJ. IEEE. Reeves, C. (2000). Fitness landscapes: A guided tour. Joint tutorials of SAB 2000 and PPSN 2000, tutorial handbook. Ronald, S. (1997). Robust encodings in genetic algorithms: A survey of encoding issues. In Proceedings of the Forth International Conference on Evolutionary Computation, pages 43–48, Piscataway, NJ. IEEE. Ronald, S., Asenstorfer, J., and Vincent, M. (1995). Representational redundancy in evolutionary algorithms. In 1995 IEEE International Conference on Evolutionary Computation, volume 2, pages 631–636, Piscataway, NJ. IEEE Service Center.
Rothlauf, F. (2002). Representations for Genetic and Evolutionary Algorithms. Number 104 in Studies on Fuzziness and Soft Computing. Springer, Heidelberg, 1st edition. Rothlauf, F. and Goldberg, D. E. (2003). Redundant representations in evolutionary computation. Evolutionary Computation, 11(4):381–415. Shackleton, M., Shipman, R., and Ebner, M. (2000). An investigation of redundant genotypephenotype mappings and their role in evolutionary search. In Proceedings of the 2000 Congress on Evolutionary Computation CEC00, pages 493–500, La Jolla Marriott Hotel La Jolla, California, USA. IEEE Press. Shipman, R. (1999). Genetic redundancy: Desirable or problematic for evolutionary adaptation? In Proceedings of the 4th International Conference on Artificial Neural Networks and Genetic Algorithms (ICANNGA), pages 1–11. Springer Verlag. Shipman, R., Shackleton, M., Ebner, M., and Watson, R. (2000a). Neutral search spaces for artificial evolution: A lesson from life. In Bedau, M., McCaskill, J., Packard, N., and Rasmussen, S., editors, Proceedings of Artificial Life VII, page section III (Evolutionary and Adaptive Dynamics). MIT Press. Shipman, R., Shackleton, M., and Harvey, L. (2000b). The use of neutral genotypephenotype mappings for improved evoutionary search. British Telecom Technology Journal, 18(4):103–111. Smith, T., Husbands, P., and O’Shea, M. (2001a). Evolvability, neutrality and search space. Technical Report 535, School of Cognitive and Computing Sciences, University of Sussex.
Smith, T., Husbands, P., and O’Shea, M. (2001b). Neutral networks and evolvability with complex genotype-phenotype mapping. In Proceedings of the European Converence on Artificial Life: ECAL2001, volume LNAI 2159, pages 272–281, Berlin. Springer. Smith, T., Husbands, P., and O’Shea, M. (2001c). Neutral networks in an evolutionary robotics search space. In of Electrical, I. and Engineers, E., editors, Proceedings of 2001 IEEE International Conference on Evolutionary Computation, pages 136–145, Piscataway, NJ. IEEE Service Center. Surry, D. and Radcliffe, N. (1996a). Formal algorithms + formal representations = search strategies. Parallel Problem Solving from Nature- PPSN IV, pages xx–xx. Surry, D. and Radcliffe, N. (1996b). Formal algorithms + formal representations = search strategies. In Voigt, H.-M., Ebeling, W., Rechenberg, I., and Schwefel, H.-P., editors, Parallel Problem Solving from Nature- PPSN IV, pages 366–375, Berlin. SpringerVerlag. ˆ . G. (1998). Domino convergence, drift, and the Thierens, D., Goldberg, D. E., and Pereira, A temporal-salience structure of problems. In of Electrical, I. and Engineers, E., editors, Proceedings of 1998 IEEE International Conference on Evolutionary Computation, pages 535–540, Piscataway, NJ. IEEE Service Center. Toussaint, M. and Igel, C. (2002). Neutrality: A necessity for self-adaptation. In Fogel, D. B., El-Sharkawi, M. A., Yao, X., Greenwood, G., Iba, H., Marrow, P., and Shackleton, M., editors, Proceedings of the 2002 Congress on Evolutionary Computation CEC2002, pages 1354–1359. IEEE Press.
Watson, R. A., Hornby, G. S., and Pollack, J. B. (1998). Modeling building-block interdependency. Parallel Problem Solving from Nature, PPSN V, pages 97–106. Whitley, D. (2000). Walsh analysis, schemata, embedded landscapes and no free lunch. Joint Tutorials of SAB 2000 and PPSN 2000. Yu, T. and Miller, J. (2001). Neutrality and evolvability of Boolean function landscapes. In Proceedings of the 4th European Conference on Genetic Programming (EuroGP), volume LNCS 2038, pages 204–217. Springer. Yu, T. and Miller, J. (2002). Finding needles in haystacks is not hard with neutrality. In Proceedings of the 5th European Conference on Genetic Programming (EuroGP), volume LNCS, pages 13–25. Springer.