Reprint 613
Operational LIDAR-based System for Automatic Windshear Alerting at the Hong Kong International Airport
P.W. Chan, C.M. Shun & K.C. Wu
12th Conference on Aviation, Range, & Aerospace Meteorology, American Meteorological Society, Atlanta, GA, USA, 29 January - 2 February 2006
6.11
Operational LIDAR-based System for Automatic Windshear Alerting at the Hong Kong International Airport P.W. Chan *, C.M. Shun and K.C. Wu Hong Kong Observatory, Hong Kong, China
1.
INTRODUCTION
of 2005. This paper gives an overview of the system and examines its performance.
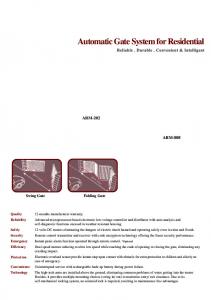
To the south of the Hong Kong International Airport (HKIA) lies the mountainous Lantau Island (Figure 1) with peaks rising to about 1000 m AMSL and valleys as low as 300 m. Sometimes, the air climbing over this hilly terrain could be disrupted to form mountain waves, gap outflow, eddies, etc. over the flight paths of HKIA, causing windshear. Most of the windshear episodes are related to airflow disturbances by the complex terrain near HKIA. Many windshear events occur in non-rainy weather conditions. To monitor the wind over HKIA under such conditions and to provide timely windshear warnings, the Hong Kong Observatory (HKO) introduced a Doppler LIght Detection And Ranging (LIDAR) system to the airport in August 2002 (Shun and Lau 2002), the first LIDAR application in airport weather alerting in the world. Situated on the rooftop of a building of about 50 m AMSL near the centre of the airport, the LIDAR commands a good view of all the eight runway corridors (Figure 1). The LIDAR has become an indispensable tool for the aviation weather forecaster in issuing windshear warnings operationally for HKIA.
Hong Kong International Airport North Runway 07LA 25RD 07RA
2.
GLIDE PATH SCANS OF THE LIDAR
With high spatial resolution (range gate spacing of about 100 m) and fast data output (10 Hz at 50 pulses averaging), the LIDAR reveals many salient features of terrain-induced airflow disturbances. First of all, such disturbances are found to be generally small-sized, with the horizontal dimensions as small as several hundred metres. Such a case occurred on 30 August 2004 (Figure 2). On that day, an area of low pressure brought strong southerly winds to Hong Kong. As shown from the 1-degree elevation Plan Position Indicator (PPI) scans of the LIDAR, there were areas of reversed flow to the west of HKIA as embedded in the background southerly wind. They are believed to arise from disruption of the southerly airflow by the hills on Lantau Island. An aircraft flying through them could encounter significant windshear, albeit only for a short time interval.
07LD
25RA 07RD 25LA South Runway
25LD
Lantau Island Scale: 0 1 2 km
N
Figure 1 Map of HKIA and Lantau Island (height contours: 100 m), with the location of the LIDAR (red square). Runway corridors are shown as pink arrows with the names marked alongside. HKO has also developed automatic windshear alerting algorithms based on the LIDAR data. Prototypes of the algorithms have been described in Choy et al. (2004). Since then, they were fine-tuned and evaluated based on pilot reports during the peak windshear seasons in the spring and summer. An automatic LIDAR-based windshear alerting system is planned to be put into operation within the last quarter * Corresponding author address: P.W. Chan, Hong Kong Observatory, 134A Nathan Road, Hong Kong email:
[email protected]
Figure 2 1-degree elevation PPI scan of the LIDAR at 10:40 p.m., 30 August 2004, showing the existence of some small-scale airflow disturbances (encircled in red) embedded in the prevailing southerly flow The airflow disturbances could move along with the background wind and affect a particular runway corridor in a short time interval only due to their small dimensions. For example, an eddy of 400 m long under the advection of 20-knot crosswind to a runway would stay over that corridor for just 40 seconds. Even when the eddy is on the corridor, a landing aircraft at typical approach speed traverses the eddy in only several seconds. The disturbances could be rather short-lived too. Vortices shedded from a hill on Lantau Island are found to have a life cycle of the order of minutes, from their emergence from the hill, drift over the runways to eventual dissipation (Chan and Shun 2005).
Due to the above characteristics of terrain-induced airflow disturbances, the windshear experienced by aircraft is transient and sporadic in nature. It is common for an aircraft to encounter significant windshear but with the preceding and the following airplanes giving null windshear reports or events of different impact (e.g. headwind loss versus headwind gain). Successful windshear alerting would require both an overview of the wind conditions in the airport area as well as focussing on the wind fluctuations along individual runway corridors. The former objective is achieved through the conventional PPI and RHI (Range Height Indicator) scans of the LIDAR. For the latter, HKO has devised a new kind of scanning strategy to measure the winds along the glide paths – the glide-path scans. A schematic diagram of a glide-path scan is given in Figure 3. For arrival corridors, 3-degree glide paths originating from the touchdown points of the runways are assumed. For departure corridors, the glide paths are taken to have a 6-degree elevation starting from the middle of the runways where a majority of the departing aircraft takes off. The laser beam of the LIDAR is configured to slide along the glide paths and measure the winds. The azimuth and elevation motions of the LIDAR scanner have to be orchestrated so that the laser beam could slide smoothly. Otherwise, the beam would take stepwise jumps, which speeds up the wear and tear of the scanner motors.
Figure 3 Diagram illustrating a LIDAR glide path scan along the 3-degree glide path for the western approach towards the north runway, viz. 07LA. The radial wind measurements along a glide path are taken together to construct a headwind profile. At the present location of the LIDAR (Figure 1), the laser beam cuts across the runways at angles depending on the azimuthal angles. An angle threshold of 30 degrees is currently adopted – if the angle of intercept is larger than this threshold, the wind data would not be used in constructing the headwind profile considering the increasing underestimation of the headwind component as this angle increases. This eliminates some data at the near range of the LIDAR (within the first few km) since the angle is generally larger due to the central location of the LIDAR between the two parallel runways. As the LIDAR is slightly offset to the east-northeast from the centre of the airport, more data are removed for the four runway corridors east of HKIA. The headwind profiles vividly illustrate the
transient and sporadic nature of terrain-induced windshear. For instance, over the departure corridor 25LD (see Figure 1 for its location) on 30 August 2004, there was a headwind loss of 20 knots followed by a headwind gain of 10 knots around the runway end (the region highlighted in green in Figure 4) at 10:41 p.m. (14:41 UTC, with Hong Kong time = UTC + 8 hours). However, the headwind sequence in the same region was found to reverse 2 minutes later, with a headwind gain of 10 knots followed by a headwind loss of nearly 15 knots. An aircraft departing at 25LD at 10:41 p.m. on that day reported encounter of significant windshear.
Figure 4 The headwind profiles of 25LD as measured by the LIDAR at 10:41 and 10:43 p.m., 30 August 2004. Inside the green area, the gain/loss sequence in the headwind profile is reversed in this 2-minute interval.
Figure 5 Doppler winds from the 1-degree PPI scan of the LIDAR at 5:06 p.m., 14 February 2005 (left) over the western part of HKIA. The headwind profile from the LIDAR over 07LA is also shown (right). The more significant changes in the headwind profile (marked by arrows) are successfully captured by the LIDAR-based windshear detection algorithm (see Section 3 below). The headwind profiles also depict that both significant headwind gain and loss could co-exist over a runway corridor at the same time. An example is given in Figure 5. In the evening of 14 February 2005, strong east to southeasterly winds prevailed in the airport area. The PPI scan at 5:06 p.m. showed that, in the midst of the outbound (easterly) flow from the LIDAR, there were patches of inbound radial velocity over 07LA corridor, which is believed to be due to southeasterly or southerly flow from the mountain gaps on Lantau Island. From the glide path scan, there were both headwind loss of 17 knots and gain up to 20 knots. At that time, an aircraft over 07LA conducted missed approach due to windshear.
3.
DESCRIPTION OF GLYGA
velocities and do not affect the genuine wind data. artificial extension of data
An algorithm called the GLIde-path scan windshear alerts Generation Algorithm (GLYGA) has been developed by HKO to detect windshear automatically from the headwind profiles generated from LIDAR data. It is based on the ramp-detection method for windshear analysis of Flight Data Recorder (FDR) data in Jones and Haynes (1984) and Woodfield and Woods (1983), with modifications for applying to the LIDAR data. The major steps of GLYGA are described below. (a)
Quality control of LIDAR velocity data In normal operation of the LIDAR, there may be isolated outliers of radial velocity, appearing as odd “spikes” in the headwind profile, as a result of reflection from clutters like aircraft. This could be expected for scanning along the glide paths. Such outliers could be detected by mimicking visual inspection to compare each piece of radial velocity with the data points around, and removed/replaced by a median-filtered value if the difference between them is larger than a pre-defined threshold. The threshold is determined from the frequency distribution of velocity difference between adjacent range/azimuthal gates of the LIDAR over a long period of time. Data quality control is kept to a minimum in order not to smooth out the genuine wind fluctuations of the atmosphere. (b)
Construction of headwind profile and velocity increment profile As discussed in Section 2, the LIDAR radial velocities along a glide path are put together to form a headwind profile as long as the angle between the laser beam and the respective runway corridor is less than the threshold of 30 degrees. In practice, the quality-controlled data points within a tube around the glide path would be considered, and those closest to the glide path would be chosen. The dimensions of the tube depend on the spatial scale of the airflow disturbances at the site. At present, GLYGA uses a rectangular tube centred at the glide path with a width of 300 m and a height of 60 m. The velocity difference between adjacent data points along the headwind profile is then calculated to construct a velocity increment profile (see Figure 6).
(c)
Smoothing of velocity increment profile The change of headwind, ΔV, over a distance H (ramp length) is referred to as a windshear ramp (Figure 7). Following Jones and Haynes (1984), the detected ramp length is increased step by step by a factor of 2, namely, 400, 800 … 6400 m. Before detection of a ramp length at the nth step, say Hn, the velocity increment profile is smoothed to filter out the velocity fluctuations with spatial scales less than Hn so that ramp lengths in the order of Hn could be detected. Some points near the profile’s ends would be taken away in each smoothing, which affects the detection of windshear ramps occurring at the ends. Following a suggestion of Haynes (1980), the headwind profile is artificially lengthened using the last valid velocity data available at each end (Figure 6). The lengthening is made for each end up to about the original length of the headwind profile. In this way, the data point removal in each smoothing process would only take away the artificial, “constant”
velocity increment
in the velocity increment
Figure 6 An example of headwind profile with artificial extension of data at both ends (upper), velocity increment profile (middle) and peaks and troughs identified from the velocity increment profile (bottom). The figure is adopted from Haynes (1980), in which time is used for the x-axis instead of a length scale. Here, headwind data were available every second and the velocity increment was constructed from a difference over 8 seconds.
ΔV H Figure 7 A schematic diagram of a windshear ramp with a headwind change ΔV over a ramp length H. (d)
Ramp detection The windshear ramps are in fact the peaks and troughs in the smoothed velocity increment profile (Figure 6). They are detected by comparing each data point of this profile with the neighbouring points on its both sides. The ramp determined in this way (the “original” ramp) is further adjusted by expansion or contraction in order to capture the full strength of the headwind change across the adjusted ramp. For instance, for a ramp of headwind gain, if the velocity continues to rise after the original ramp, the ramp length is expanded to cover the velocity increasing part until the velocity starts to drop or half of the original ramp length is reached, whichever is shorter (Figure 8(a)). On the other hand, for a ramp of headwind loss, if velocity increases at the final portion of the ramp, the ramp length is contracted until the velocity increasing part is passed or a quarter of the original ramp length is reached, whichever is smaller (Figure 8(b)).
1/2 original ramp size
original ramp expanded ramp
(a) 1/4 original ramp size
principle adopted by the Terminal Doppler Weather Radar (TDWR) (HKO and IFALPA 2002). Similar to the windshear alerts generated by TDWR, the alert magnitudes are rounded to the nearest 5 knots, and an alert of 15 knots would be issued for a detected event of 14 knots based on the LIDAR data. The GLYGA alert would be ingested into the Windshear and Turbulence Warning System (WTWS) operated by HKO to provide windshear alerts to pilots. WTWS integrates alerts from a suite of windshear detection algorithms, including TDWR-based and anemometer-based algorithms at present. After integration, one single windshear alert for each runway corridor will be displayed on operational alphanumeric displays for air traffic controllers to relay to pilots. 4.
contracted ramp original ramp
(b) Figure 8 Schematic diagrams of (a) ramp expansion and (b) ramp contraction. (e)
Prioritization of windshear ramps Woodfield and Woods (1983) argued that a severity factor S of windshear could be: S =(
ΔV dV ΔV 2 )( ) = ( 1/ 3 )3 / Vapp , dt V app H
where dV/dt is the rate of change of wind speed, ΔV the total change of wind, Vapp the normal approach speed of the aircraft and H the ramp length. Thus, the primary parameter turned out to be the normalized windshear value ΔV/H1/3. A similar conclusion was drawn in Jones and Haynes (1984) based on analysis of FDR data and turbulence consideration. GLYGA also adopts the same normalized windshear value in prioritizing the windshear ramps detected from a headwind profile. For overlapping ramps, only the one with the highest normalized windshear value would be retained and the others would be removed. (f)
Alert threshold Following the internationally adopted windshear alerting threshold, the GLYGA alert threshold should be set as 15 knots. However, since the LIDAR beam intercepts the runways at HKIA at an angle, only a component of the actual headwind experienced by the aircraft could be measured. As discussed in Section 2, this geometrical factor is even more significant for ranges near the LIDAR, including the runway thresholds and touchdown zones. Based on studies of past data, the alert threshold is chosen to be 14 knots.
(g)
Alert generation and operational setup If any one of the windshear ramps picked out by the ramp prioritization reaches or exceeds the alert threshold of 14 knots, an alert message would be generated for each runway corridor automatically following the “first encounter, maximum intensity”
PERFORMANCE OF GLYGA
The windshear seasons in Hong Kong are spring and summer. In spring-time, disruption of the strong prevailing east to southeasterly winds by the Lantau terrain in a stable boundary layer often produces significant windshear to aircraft. In the summer, terrain-induced disturbances in southerly flow and thunderstorms could bring about windshear, especially during the passage of tropical cyclones. Sea breeze, another cause of low-level windshear, occurs at HKIA in both seasons. Performance of GLYGA in both seasons is examined using two metrics: hit rate (based on pilot reports of significant windshear) and alert duration (expressed as percentage of the period concerned). The statistics for the mostly used runway corridors are given in Table 1. Aircraft mostly take off from the south runway and land at the north runway of HKIA, though some aircraft, mainly freighters, also land on the south runway. The choice of runway corridors shown in Table 1 also reflects the prevailing wind direction in each season, namely, easterly in spring-time and southerly flow in the summer. In general, GLYGA shows skills over the mostly used runway corridors: after excluding those cases in which the LIDAR could not detect the windshear for obvious reasons (range limitation of the LIDAR in rain, or the windshear occurring below 50 m [height of LIDAR]), the hit rate reaches about 70%. Runway corridor 07LA No. of significant windshear reports 140 No. of hits 115 Hit rate 82% Alert duration (% of time) 8.1% Frequency of windshear encounter 0.8%
07RA 41 28 68% 7.8% 1%
07RD 80 13 16% 5.3% 0.2%
(a) Spring-time (1 February to 15 April 2005) Runway corridor 25RA No. of significant windshear reports 51 No. of hits 35 Hit rate 69% Alert duration (% of time) 1.7% Frequency of windshear encounter 0.2%
25LA 6 4 67% 1.7% 0.2%
25LD 22 17 77% 4.3% 0.05%
(b) Summer-time (1 July to 30 September 2004) Table 1 Performance statistics of GLYGA in the two windshear seasons in Hong Kong over the mostly used runway corridors of HKIA in each season. The frequency for aircraft to encounter significant windshear over each runway in the respective season is also given.
The frequency for aircraft to encounter significant windshear is also given in Table 1. It is calculated from the number of pilot reports over a runway corridor divided by the runway usage in the period from July 1998 (opening of HKIA) to May 2005. For the arrival corridors, the frequencies of windshear encounter in spring-time are 4 to 5 times of those in the summer. The alert durations of GLYGA increase by a similar ratio. They are considered to be reasonable. Some challenges of windshear detection by LIDAR are also identified, e.g. over the departure corridor 07RD due to limitation of the LIDAR’s measurement range in low cloud-base height in spring time, data removal in blanked sectors (for laser safety reason) and variability of the rotation point of the departing aircraft. 5.
CONCLUSIONS
HKO has developed the first operational LIDAR-based windshear detection algorithm (GLYGA) in the world for automatic windshear alerting at HKIA. GLYGA uses the radial velocities measured by the LIDAR along the glide paths to construct the headwind profiles and looks for significant changes. The windshear ramps so determined are prioritized according to a normalized windshear metric. An alert is generated automatically if any one of the windshear ramps left behind after the ramp prioritization reaches or exceeds the alert threshold. The GLYGA alert is ingested into WTWS and compared with the alerts given by the other automatic windshear detection algorithms to produce a final single alert for each runway corridor. GLYGA has generally demonstrated skills over the mostly used runway corridors with the hit rate reaching about 70% and with reasonable alert duration. References Chan, P.W., and C.M. Shun, 2005: Numerical simulation of vortex shedding observed at the Hong Kong International Airport using a shallow water model. Croatian Meteorological Journal, 40, 27-30. Choy, B.L., O.S.M. Lee, C.M. Shun and C.M. Cheng 2004: Prototype automatic LIDAR-based wind shear detection algorithms. 11th Conference on Aviation, Range, and Aerospace Meteorology, American Meteorological Society, Massachusetts (on-line proceedings). Haynes, A., 1980: Description of a program developed for the analysis of windshears experienced during aircraft approach to landing. Royal Aircraft Establishment Technical Memorandum FS 321. HKO and IFALPA, 2002: Windshear and Turbulence in Hong Kong – information for pilots. Hong Kong Observatory and International Federation of Air Line Pilots’ Associations, 24 pp. Jones, J.G., and A. Haynes, 1984: A peakspotter program applied to the analysis of increments in turbulence velocity. Royal Aircraft Establishment Technical Report 84071. Shun, C.M., and S.Y. Lau, 2002: Implementation of a Doppler LIght Detection And Ranging (LIDAR) system for the Hong Kong International Airport.
th Preprints, 10 Conference on Aviation, Range and Aerospace Meteorology, American Meteorological Society, Oregon, 255-256. Woodfield, A.A., and J.F. Woods, 1983: Worldwide experience of wind shear during 1981-1982. AGARD Flight Mechanics Panel Conference on ‘Flight Mechanics and System Design Lessons from Operational Experience’, AGARD CP No. 347.