bral arteries, most commonly found in the Circle of Willis. They often remain asymptomatic during the course of life, yet severe complications arise when they ...
REPRODUCIBILITY OF IMAGE-BASED COMPUTATIONAL HEMODYNAMICS IN INTRACRANIAL ANEURYSMS: COMPARISON OF CTA AND 3DRA A.J. Geers1,2 , I. Larrabide2,1 , A.G. Radaelli1,2 , H. Bogunovic1,2 , H.A.F. Gratama van Andel4 , C.B. Majoie5 , A.F. Frangi1,2,3 1
Center for Computational Imaging and Simulation Technologies in Biomedicine (CISTIB), Universitat Pompeu Fabra (UPF); 2 Networking Center on Biomedical Research (CIBER-BBN); 3 Instituci´o Catalana de Recerca i Estudis Avanc¸ats (ICREA), Barcelona Spain. 4 Dept. of Biomedical Engineering & Physics and 5 Dept. of Radiology; Academic Medical Center (AMC), University of Amsterdam (UvA), Amsterdam, The Netherlands. ABSTRACT Hemodynamics play an important role in the pathogenesis of intracranial aneurysms and are believed to provide valuable information to predict aneurysmal rupture. Using imagebased vascular models and computational fluid dynamics (CFD) techniques, the inter-aneurysmal hemodynamics can be studied in depth. In this paper, the effect of using different image-modalities is evaluated by investigating 4 middle cerebral arteries bifurcation aneurysms imaged with threedimensional rotational angiography (3DRA) and computed tomographic angiography (CTA). The presented visualizations show that the main flow characteristics are preserved. However, there are large discrepancies in quantitative measurements. Index Terms— intracranial aneurysm, computational fluid dynamics, 3D rotational angiography, CT angiography 1. INTRODUCTION Intracranial aneurysms are pathologic dilatations of cerebral arteries, most commonly found in the Circle of Willis. They often remain asymptomatic during the course of life, yet severe complications arise when they rupture and cause a subarachnoid hemorrhage (SAH) [1]. With the improvement of imaging techniques, unruptured aneurysms are more frequently detected. Since treatment procedures come with unavoidable risk, the clinician needs to counterweigh it with the risk of rupture of these aneurysms. Aiming to contribute to the clinician’s understanding of each specific case, a modeling pipeline comprising image-based vascular models and computational fluid dynamics (CFD) simulations has been This work was partially generated within the framework of the Integrated Project @neurIST (IST-2005-027703), which is co-financed by the European Commission, and also partially supported by MEC TEC2006-03617, ISCIII FIS2004/40676, and CDTI CENIT-CDTEAM grants. The CISTIB is part of the ISCIII CIBER-BBN (CB06/01/0061).
developed [2]. This provides a detailed insight into the hemodynamic environment, which is believed to strongly correlate to the pathogenesis of aneurysms. The modeling pipeline to study cerebral blood flow has been successfully based on data from various imagemodalities, including three-dimensional rotational angiography (3DRA), computed tomographic angiography (CTA), and magnetic resonance angiography (MRA), and has been demonstrated to accurately approximate inter-aneurysmal blood flow [3]. The multi-modal applicability is of importance given that at the different stages of the patient care cycle different image-modalities are used. The most anatomically accurate vascular models are constructed from 3DRA images [4, 5]. However, their acquisition requires an invasive catheterization procedure which limits the modality to the treatment stage. CTA, on the other hand, is less invasive and therefore appropriate for diagnosis and follow-up studies. Yet, its contrast and spatial resolution are inferior. As a result, a change of image-modality could potentially induce a geometric change in the vascular model, which is known to have a substantial impact on the flow simulation [2]. The aim of this paper is to evaluate these geometric and subsequent hemodynamical differences by studying four middle cerebral artery (MCA) bifurcation aneurysms previously imaged with both 3DRA and CTA. Similarity of location was chosen to provide a consistent hemodynamics environment. Moreover, the MCA is not surrounded by bone structures, which could otherwise give rise to inaccuracies in the CTA segmentation. 2. METHODS Image data was originally obtained for a large clinical study of 108 patients at the Department of Radiology of the Academic Medical Center, Amsterdam, The Netherlands in 2006 [6]. As part of this study, the quality of CTA images was rated in four categories by two experienced clinicians. From an 80-
patient subgroup with the highest quality rating, 4 MCA bifurcation aneurysms (2 ruptured) were randomly chosen for the present study. All 4 aneurysms were imaged with both 3DRA and CTA within a 1-day time interval. 3DRA images were acquired with a single-plane angiographic unit (Integris Allura Neuro; Philips Medical Systems, The Netherlands). A total of 100 images, each covering a field-of-view (FOV) of 40 mm, were acquired in 8 seconds during a 240◦ rotational run and reconstructed as 3D image with a 2563 matrix. CTA images were acquired with a 4section spiral CT scanner (Sensation 4; Siemens Medical Solutions, Germany) in 16 seconds. Parameters were set as follows: bolus-tracking, 150 mm FOV, 120 kV, 250 mAs, 4 × 1 mm detector collimation, pitch of 0.875, section thickness of 1.3 mm, increment of 0.5 mm, 512 × 512 matrix, reconstruction kernel H30f. Patient-specific vascular models were constructed from medical images using a geodesic active regions segmentation method. The method’s strength lies particularly with its multi-modal application and has been demonstrated to perform well on 3DRA and CTA images [5]. After segmentation, a triangulated surface mesh representing the vascular boundary was obtained. Subsequently, a sequence of global and local operations had to be applied to improve its mesh quality and to correct for geometrical and topological irregularities. In- and outlet were cut perpendicular to their centerline and extruded if necessary. The inlet of the vascular models was chosen at the petrous segment of the ICA. The processed surface mesh was imported in the commercial software package ANSYS ICEM CFD v11.0 (ANSYS Inc., PA, USA) to create an unstructured grid containing tetrahedral and prism elements. The maximum element size was 0.2 mm with a minimum size of 0.1 for curvature-based refinement. Three prism element layers covered the vessel wall to ensure a well-defined velocity curve near the wall and thus accurate values for the wall shear stress. Depending on the volume of the vascular model the grids consisted of about 1.5 · 106 elements. Transient CFD simulations were performed with the commercial software package ANSYS CFX v11.0 (ANSYS Inc., PA, USA), which uses a finite volume approach to solve the Navier-Stokes equations. Blood was modeled as an incompressible Newtonian fluid (ρ = 1060 kg m−3 ; µ = 0.004 Pa s). The vessel wall was assumed to be rigid with a no-slip boundary condition. A parabolic velocity profile was imposed at the inlet and flow was assumed to fully develop over the inlet extrusion before entering the vascular model. Since patientspecific flow information was not available, an inflow curve from a healthy patient acquired with pcMRI was used at 72 bpm [2]. This curve was scaled to obtain a physiologically realistic mean WSS of 1.5 Pa near the inlet [7]. Since CTA images were undersegmented at the inlet due to near bone structures, the inflow rate could not be well-determined. To cancel out differences in the flow rate further downstream as
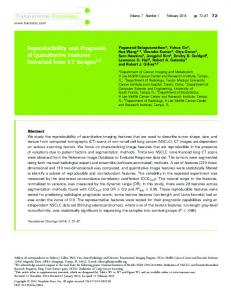
a result of this, inflow rates were chosen to be the same for both modalities. For future reference we will denote 3DRA- and CTAbased results and geometric models as 3DRA- and CTAmodels, respectively. Since 3DRA-models are anatomically more accurate, we also assumed they would give more accurate hemodynamic results. For this reason, focus will be put on evaluating CTA-models by comparing visualizations and quantitative measurements with those from 3DRA-models. 3. RESULTS CFD results were post-processed in ANSYS CFX to visualize several hemodynamic variables. In Fig. 1 each vascular model is depicted next to three close-ups of the aneurysm showing: 1) streamlines to represent the time-averaged flow field, colorcoded by the velocity magnitude; 2) time-averaged wall shear stress magnitude (WSS); and 3) oscillatory shear index (OSI), which describes the oscillatory nature of the WSS over the whole cardiac cycle [8]. Tab. 1 presents numerical results of various geometrical and hemodynamic variables. We chose to include variables that are commonly reported in the literature on hemodynamic modeling of aneurysms and those that might assist in deducing the source of errors. The main point that comes to mind when reviewing the numerical results is that the errors are large for all variables and widely spread among the aneurysms. The WSS on the aneurysm sac has, for instance, a >50% error in all cases. Normalization with the WSS on the parent vessel reduces the error, yet it still remains quite large. However, the search for variables that can distinguish ruptured and unruptured aneurysm populations is ongoing. Therefore, little can be said about the impact of the reported errors on the ability to distinguish the two populations, since this depends entirely on the distance between them. CTA-models appeared not to comprise small vessels of less than about 1 mm diameter. For 3DRA-models this lower limit lay around 0.5 mm. Hence, 3DRA-models had more outlets, which allowed for a larger flow reduction prior to reaching the aneurysm. Aneurysm 1, 2, and 4 were indeed found to have a higher flow rate in the parent vessel of the CTA-models. The lower flow rate for aneurysm 3 is due to the larger proximal outlets in the CTA-model and a difference in the flow split at the bifurcation from ICA to MCA. Main flow patterns were conserved in 3 out of 4 aneurysms. Aneurysm 3 had a more complex flow pattern in the 3DRAmodel. It appears that the aneurysm in this model was more bottle-necked, which disrupted the inflow creating a relatively high WSS area at the neck. The complexity of flow is also apparent from the high OSI in the 3DRA-model. This leads us to the observation that for all aneurysms the neck was larger in the CTA-model. The low contrast and spatial resolution in the image seem to have caused the segmentation algorithm to merge the aneurysm sac with surround-
FLOW
MODEL 0
0.3 0
[m/s]
WSS [Pa]
10 0
OSI [-]
0.5
#1-3DRA
#1-CTA
#2-3DRA
#2-CTA
#3-3DRA
#3-CTA
#4-3DRA
#4-CTA
Fig. 1: Visualization of the vascular model and CFD result of all 4 aneurysms and both image modalities. From left to right: 1) vascular model with a closed triangle indicating the aneurysm, open triangles indicating vessels of the 3DRA-model that were not reconstructed in the CTA-model, and an arrow to indicate the direction of the blood flow; 2) streamlines of the time-averaged flow field color-coded by the velocity magnitude; 3) time-averaged WSS distribution; and 4) OSI distribution.
Table 1: Errors in CTA-models for various geometrical and hemodynamic variables. Arrows indicate whether the CTA-model gave a higher or lower value than the 3DRA-model. Measurement #1 Err. [%] ⇑ / ⇓
Aneurysm #2 #3 Err. [%] ⇑ / ⇓ Err. [%] ⇑ / ⇓
#4 Err. [%] ⇑ / ⇓
mean cross-sectional area near inlet area of neck volume of sac
18.8 2.7 9.3
⇓ ⇑ ⇓
2.3 78.2 9.1
⇓ ⇑ ⇑
29.8 45.7 39.6
⇓ ⇑ ⇑
13.2 66.0 8.9
⇓ ⇑ ⇑
mean WSS on sac mean WSS on sac / mean WSS on parent vessel maximum WSS on sac mean WSS spatial gradient on sac flow rate at parent vessel flow rate into sac flow rate into sac / flow rate at parent vessel mean velocity at neck mean velocity in sac
61.9 20.2 27.1 39.0 16.1 9.9 5.4 14.2 35.4
⇑ ⇑ ⇑ ⇑ ⇑ ⇑ ⇓ ⇑ ⇑
83.2 59.3 10.9 37.0 6.0 56.4 47.6 10.0 68.1
⇑ ⇑ ⇓ ⇑ ⇑ ⇑ ⇑ ⇓ ⇑
51.8 9.7 50.4 56.9 24.5 12.1 16.4 26.5 20.6
⇓ ⇑ ⇓ ⇓ ⇓ ⇓ ⇑ ⇓ ⇓
54.8 34.8 6.9 14.2 16.8 34.2 14.9 9.3 45.0
⇑ ⇑ ⇓ ⇑ ⇑ ⇑ ⇑ ⇓ ⇑
Err. = |CTA − 3DRA| /3DRA × 100%; ⇑= overestimation; ⇓= underestimation.
ing vessels, hereby widening the neck. This correlates with the fraction of flow that enters the aneurysm. Together with the already larger flow rate at the parent vessel, aneurysm 1, 2, and 4 had a larger flow into the aneurysm. This was directly translated to a higher velocity inside the aneurysm and a higher WSS on the aneurysm wall. 4. CONCLUSIONS 3DRA-based and CTA-based blood flow simulations of 4 MCA bifurcation aneurysms were compared. Main flow characteristics were found to be well-preserved. However, quantitative hemodynamic measurements did give substantially different results. The main sources of error are due to the low contrast and spatial resolution of CTA images. On the one hand, this made it difficult for the segmentation algorithm to distinguish vascular structures that are in close proximity. As a result, the aneurysm neck appeared to be wider in the CTA-model, which altered the flow rate into the aneurysm and, thus, other hemodynamic variables. On the other hand, contrast values of small vessels were blurred such that the segmentation algorithm failed to recognize them. This gave often rise to a relatively higher flow rate just proximal to the aneurysm in CTA-models. 5. REFERENCES [1] W.I. Schievink, “Intracranial aneurysms,” N Engl J Med, vol. 336, no. 1, pp. 28–40, 1997. [2] J.R. Cebral, M.A. Castro, S. Appanaboyina, C.M. Putman, D. Millan, and A.F. Frangi, “Efficient pipeline for image-based
patient-specific analysis of cerebral aneurysm hemodynamics: technique and sensitivity,” IEEE Trans Med Imaging, vol. 24, no. 4, pp. 457–467, 2005. [3] M.D. Ford, H.N. Nikolov, J.S. Milner, S.P. Lownie, E.M. Demont, W. Kalata, F. Loth, D.W. Holdsworth, and D.A. Steinman, “Piv-measured versus cfd-predicted flow dynamics in anatomically realistic cerebral aneurysm models,” J Biomech Eng, vol. 130, no. 2, pp. 021015, 2008. [4] W.J. van Rooij, M.E. Sprengers, A.N. de Gast, J.P. Peluso, and M. Sluzewski, “3D rotational angiography: the new gold standard in the detection of additional intracranial aneurysms,” AJNR Am J Neuroradiol, vol. 29, no. 5, pp. 976–979, 2008. [5] M. Hernandez and A.F. Frangi, “Non-parametric geodesic active regions: method and evaluation for cerebral aneurysms segmentation in 3DRA and CTA,” Med Image Anal, vol. 11, no. 3, pp. 224–241, 2007. [6] M. Romijn, H.A. Gratama van Andel, M.A. van Walderveen, M.E. Sprengers, J.C. van Rijn, W.J. van Rooij, H.W. Venema, C.A. Grimbergen, G.J. den Heeten, and C.B. Majoie, “Diagnostic accuracy of CT angiography with matched mask bone elimination for detection of intracranial aneurysms: comparison with digital subtraction angiography and 3D rotational angiography,” AJNR Am J Neuroradiol, vol. 29, no. 1, pp. 134–139, 2008. [7] R.S. Reneman, T. Arts, and A.P. Hoeks, “Wall shear stress– an important determinant of endothelial cell function and structure–in the arterial system in vivo. discrepancies with theory,” J Vasc Res, vol. 43, no. 3, pp. 251–269, 2006. [8] D.N. Ku, D.P. Giddens, C.K. Zarins, and S. Glagov, “Pulsatile flow and atherosclerosis in the human carotid bifurcation. positive correlation between plaque location and low oscillating shear stress,” Arteriosclerosis, vol. 5, no. 3, pp. 293–302, 1985.