Medical Physics, Freeman Hospital, Newcastle upon Tyne NE7 7DN, U.K., ... Teesside TS1 3BA, U.K., and â¡Department of Cardiology, Freeman Hospital, ...
Clinical Science (1998) 95, 575–581 (Printed in Great Britain)
Reproducibility of three different methods of measuring baroreflex sensitivity in normal subjects S. W. LORD, R. H. CLAYTON*, M. C. S. HALL, J. C. GRAY†, A. MURRAY*, J. M. MCCOMB‡ and R. A. KENNY Cardiovascular Investigation Unit, Royal Victoria Infirmary, Newcastle upon Tyne NE1 4LP, U.K., *Regional Department of Medical Physics, Freeman Hospital, Newcastle upon Tyne NE7 7DN, U.K., †Centre for Health and Medical Research, University of Teesside, Teesside TS1 3BA, U.K., and ‡Department of Cardiology, Freeman Hospital, Newcastle upon Tyne NE7 7DN, U.K.
A
B
S
T
R
A
C
T
1. Baroreflex sensitivity is a useful tool for investigating cardiovascular reflexes in a number of clinical settings. Several different methods of measuring baroreflex sensitivity are available. In order to determine a clinically useful non-invasive method of measuring baroreflex sensitivity we compared two methods (spectral analysis and the Valsalva manoeuvre) with regard to reproducibility, agreement with a standard invasive method (phenylephrine infusion) and failure rate. 2. Twenty-six healthy subjects aged 22 to 63 years attended on three separate occasions for measurement of baroreflex sensitivity using the different methods. The effect of a recent headup tilt on baroreflex sensitivity was measured. 3. Reproducibility was best for the low-frequency component of the spectral method [coefficient of variation 25.0 % (range 3.5–42.4 %)] and worst for the Valsalva method [coefficient of variation 29.3 % (range 13.8–93.1 %)]. Both non-invasive methods overestimated values compared with the phenylephrine method [bias of low-frequency component of the spectral method, 1.17 (0.38–3.6) ; bias of the Valsalva method, 1.13 (0.19–6.7)]. The high-frequency component of the spectral method did not agree with the phenylephrine method. 4. The spectral analysis method had the fewest failures (seven subjects with a failure on at least one occasion), and the phenylephrine method the most (16 subjects with a failure on at least one occasion). A short head-up tilt did not affect the subsequent non-invasive measurement of baroreflex sensitivity. 5. It was concluded that the low-frequency component of the spectral method was the most clinically useful non-invasive measurement of baroreflex sensitivity.
INTRODUCTION The response of heart rate to a given change in systolic blood pressure, the baroreflex sensitivity (BRS), is thought to be a fundamental characteristic of the human
cardiovascular system [1]. Measurement of BRS has provided useful insights into the pathophysiology of hypertension [2], cardiac failure [3] and neurocardiogenic syncope [4]. Moreover, it has been noted that BRS may provide important information about prognosis after
Key words : baroreflex sensitivity, reproducibility, tilt testing. Abbreviations : BRS, baroreflex sensitivity ; HF, high frequency ; LF, low frequency. Correspondence : Dr S. W. Lord.
# 1998 The Biochemical Society and the Medical Research Society
575
576
S. W. Lord and others
myocardial infarction independent of other conventional indices of cardiac function [5]. The standard method of determining BRS involves venous cannulation, itself known to affect cardiovascular reflexes [6], and although newer non-invasive methods are available, it is not known whether these methods measure the same quantity. Furthermore, little information is available about the reproducibility of the various methods of measuring BRS, so the assessment of small changes in its value is difficult. It is therefore important to define accurate and reproducible non-invasive methods of measuring BRS. This study set out to compare two non-invasive methods of determining BRS – spectral analysis of heart rate and blood pressure, and the Valsalva manoeuvre – with infusion of phenylephrine in normal subjects, and to determine the within-subject variability of each of these methods. Because some of the variability in the measurement of BRS has been linked to posture, we also assessed the effect of a short head-up tilt upon the subsequent value of BRS measured non-invasively.
SUBJECTS AND METHODS Twenty-six normal control subjects were recruited (11 female, 15 male). None was taking medication. Median age was 36.5 (22–63) years. All were studied between 08 : 00 and 13 : 00 h on three separate occasions at least 1 week apart. On arrival at the investigation unit a venous cannula was inserted into a forearm vein and the subjects rested supine for 30 min. At each visit each subject underwent four investigations : A. A 15 min period of supine rest during which sinus cycle length and systolic blood pressure were recorded and subsequently analysed. B. Three standard Valsalva manoeuvres. C. A 5 min head-up tilt test. D. An infusion of phenylephrine. Method D (phenylephrine) was always performed last as it is the accepted standard for measurement of BRS. Procedures A, B and C were performed in the same predefined order for each subject at each visit. This order was determined at random for each subject at the first visit. There was no time interval between each procedure.
systolic blood pressure were automatically identified from the raw data and the identification was checked visually. The Finapres was allowed to recalibrate, and missing systolic pressures were replaced by linear interpolation.
Spectral analysis (A) Each 15-min period was broken up into three 5-min sections, each analysed according to the method described by Clayton et al. [7]. For each 5-min section, cardiac cycle length and systolic blood pressure series were resampled at 4 Hz using the method of Berger et al. [8]. The series were then zero padded, multiplied by the Hanning (cosine squared) function and Fourier transformed in nine overlapping segments, each 512 samples long and overlapping the previous epoch by 424 samples (82 %). The averages of these spectra were determined, and the coherence between cycle length and blood pressure was calculated. The BRS was determined over two frequency ranges [low frequency (LF), 0.05 to 0.15 Hz and high frequency (HF), 0.15 to 0.35 Hz] as the mean of the ratio of the spectral densities of cycle length to systolic blood pressure only where coherence was greater than 0.5. The average value of three measurements (from the three 5-min sections) was used on each occasion.
Valsalva manoeuvres (B) These were performed according to the method described by Hartikainen et al. [9]. Subjects were seated with both arms resting on a table and were instructed to blow against a fixed pressure of 40 mmHg for 15 s. A small leak in the system required the patient to blow continuously to maintain the pressure. BRS was determined from the slope of the linearized relationship between systolic blood pressure and subsequent cycle length from beats between where systolic pressure rose above that measured before the strain phase and the subsequent maximum. Each measurement was separated by 3 min. The average value of three measurements was used on each occasion.
Head-up tilt (C) Each subject was positioned on a tilt table with an armrest at chest height and tilted to 70 ° for 5 min. Heart rate and blood pressure were recorded throughout.
Data collection Blood pressure was measured using digital plethysmography (Finapres, Ohmeda), and the ECG was acquired from the limb lead with the largest R wave (usually standard lead II) during all experiments. Blood pressure and electrocardiographic data were sampled at 250 Hz using an analogue to digital converter (National Instruments DAQ 700) interfaced to a personal computer using custom written software. Cardiac cycle length and # 1998 The Biochemical Society and the Medical Research Society
Phenylephrine infusion (D) This was performed according to the method described by Creager and Creager [10]. Phenylephrine was given as an infusion via the previously positioned venous cannula, starting at 50 µg}min and increasing by 50 µg}min every 30 s until a rise in systolic pressure of at least 20 mmHg was achieved. BRS was determined only from continuous systolic pressure rises of more than 20 mmHg occurring
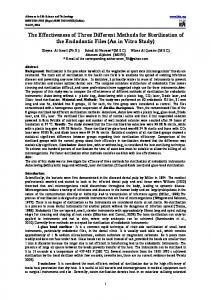
Relationship between the natural logarithm of variance and mean for each test
(a) Spectral analysis (LF), (b) spectral analysis (HF), (c) Valsalva, (d) phenylephrine.
Figure 1
Reproducibility of baroreflex sensitivity
# 1998 The Biochemical Society and the Medical Research Society
577
578
S. W. Lord and others
Table 1
Reproducibility and bias of the tests of baroreflex sensitivity
Abbreviations : CV, coefficient of variation ; LF, low frequency ; HF, high frequency. Bias relative to phenylephrine (mean and 95 % reference range) Valsalva Spectral analysis (LF) Spectral analysis (HF) Phenylephrine
1.13 (0.19–6.7) 1.17 (0.38–3.6) 1.46 (0.34–6.3) –
Within-day reproducibility (CV and range)
Between-week reproducibility (CV and range)
26.4 % (2.7 %–42.2 %) 13.5 % (0.9 %–67.8 %) 17.8 % (2.6 %–77.2 %)
29.3 % (13.8 %–93.1 %) 25.0 % (3.5 %–42.4 %) 25.5 % (4.7 %–79.0 %) 29.5 % (8.1 %–77.9 %)
over less than 60 s by plotting systolic pressure rise from resting against the cycle length of the subsequent beat and determining the slope of the line of best fit using a least squares approximation. Only relationships reaching statistical significance using linear correlation analysis (P ! 0.05) were used in the subsequent analysis. Approval was obtained from the Joint Ethical Committee of the University of Newcastle upon Tyne and Newcastle Health Authority, and prior informed consent was obtained from all subjects.
Statistical analysis Reproducibility from week to week was assessed for each method in the style of Bland and Altman [11] by plotting the variance of the three measurements made on different weeks against the average of the three measurements for each subject. In the original units, reproducibility depended upon the size of the measurement with larger measurements being less reproducible than smaller measurements. Data were therefore analysed as natural logarithms because reproducibility was then almost independent of the size of the measurement. The median between-week coefficient of variation is presented along with the range of coefficients of variation observed over the 26 subjects. Reproducibility within days was similarly assessed for the non-invasive tests, which were performed on three occasions at each visit, and is presented as the coefficient of variation (median and range). It should be noted that the two figures are not directly comparable as the first represents the variability of three averages of three measurements and the second the variability of three single measurements. A correction factor of o3 could be applied if a direct comparison was desired. Agreement between each of the methods and phenylephrine was assessed using the method of Bland and Altman [11]. The difference between the measurement of the method in question and the phenylephrine method was plotted against the average of the two results. As with reproducibility, the level of agreement depended upon the size of the measurement with better agreement being obtained for smaller measurements. The data were # 1998 The Biochemical Society and the Medical Research Society
therefore analysed as natural logarithms ; in these units the level of agreement was independent of the size of the measurement. The S.D. of the difference was adjusted to take account of missing measurements. Ninety-five percent limits of agreement (limits within which 95 % of differences should fall) were calculated in log units by taking the mean³2¬S.D. of the differences. The mean difference and the limits of agreement were transformed back to the original units of measurement and in these units represent the mean and limits of agreement for the ratio of the non-invasive value to the phenylephrine value.
RESULTS Reproducibility The relationship between the variance of the logarithm of the three readings and their mean is shown in Figure 1 for each measurement of BRS. The variance of the logarithm of the three readings indicates the intra-subject variability of the test. The intra-subject variability of each test is presented in Table 1. The LF component of the spectral method (Figure 1a) shows less variability than the phenylephrine method (Figure 1d), the Valsalva method (Figure 1c) and the HF component, which was the most variable (Figure 1b). Thus the LF component of the spectral method is the most reproducible.
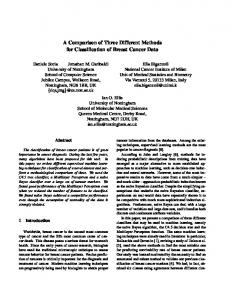
Relationships between tests Figure 2 shows the comparison of each of the noninvasive methods and the phenylephrine method by plotting the difference in the logarithm of the readings against the mean of the logarithm of the readings. Mean and 95 % reference ranges for the ratio of each test result to that obtained using phenylephrine infusion are shown in Table 1. The Valsalva method overestimated phenylephrine BRS by a factor of 1.13 (0.19–6.7), and the LF component of the spectral method overestimated phenylephrine BRS by a factor of 1.17 (0.38 to 3.6). The HF component of the spectral method was biased and could not be used interchangeably with the other methods.
Reproducibility of baroreflex sensitivity
Figure 2
Relationship of the difference between the estimation of BRS using each non-invasive test and phenylephrine
(a) Spectral analysis (LF), (b) spectral analysis (HF), (c) Valsalva.
Effect of head-up tilt
Missing data
Data for each non-invasive test before and after head-up tilt are shown in Table 2. It should be noted that each subject underwent the measurements in the same order at each visit, and so the before and after tilt comparisons refer to different groups of subjects. There was no difference between the mean value of BRS measured by either method before and after tilt
On a number of occasions BRS could not be estimated (Table 3). One subject declined to participate on the third occasion. The phenylephrine method failed because systolic pressure did not rise by at least 20 mmHg}min during the infusion. The Valsalva method failed because systolic blood pressure did not rise by 20 mmHg after release of strain during the manoeuvre. The spectral # 1998 The Biochemical Society and the Medical Research Society
579
580
S. W. Lord and others
Table 2 Effect of head-up tilt on value of baroreflex sensitivity (BRS)
BRS LF region (ms/mmHg) HF region (ms/mmHg) Valsalva (ms/mmHg)
Tilt before (n ¯ 14)
Tilt afterwards (n ¯ 12)
11.9 (6.7) 18.0 (15.8) 10.2 (4.9)
11.4 (5.8) 15.4 (8.2) 10.2 (7.0)
Table 3 Number of subjects with missing observations for each test
Missing observations
Valsalva
Spectral Spectral analysis (LF) analysis (HF)
Phenylephrine
Three Two One Zero
3 4 5 14
1 2 4 19
1 4 11 10
1 2 5 18
method failed when coherence was less than 0.5 between systolic pressure and cycle length in the relevant range of the spectrum. Subjects in whom less than two measurements were possible were omitted from the analysis of repeatability.
of the reasons that the spectral method is the least variable may be that it was derived from longer periods of time than the Valsalva or phenylephrine estimations, and therefore further reductions in variability may be achieved by making longer recordings. This point needs further investigation. Although we found no effect of a short head-up tilt upon non-invasive BRS, it should be emphasized that the observed variability in the data limits the power of this observation. Failed recording or lack of a significant rise in systolic pressure or of a correlation between pressure and cycle length made an impact upon our results, as it has done with others [9,12,13]. The high failure rate of phenylephrine estimations is related to the use of a cut-off value for rate of rise of systolic pressure and is a limitation of the use of an infusion rather than a bolus. However, Watkins et al. [13] report failure of the bolus method in seven of 58 subjects. The proportion of Valsalva estimations failing is similar to that obtained by Hartikainen et al. [9]. The fact that fewer spectral estimations failed suggests that this may be a more useful practical method. These data provide information which will be useful when choosing a method of measuring BRS. Although methods involving phenylephrine have been used as standard they have a number of drawbacks including the central effects of phenylephrine, the effect of intravenous cannulation, and the fact that only the bradycardic response is explored. However, most available clinical data are based upon phenylephrine testing and thus it will be important to investigate the clinical information available in non-invasive estimations of BRS.
DISCUSSION This study has shown wide intra-subject variation in all of the three methods of measuring BRS, suggesting that small differences in BRS should be interpreted with caution. Other investigators have demonstrated relationships between BRS determined using bolus injection of phenylephrine and BRS determined using spectral analysis [12,13], and also between BRS determined using bolus injection of phenylephrine and BRS determined using the Valsalva manoeuvre [9]. In all of these studies the degree of agreement with the phenylephrine bolus method was assessed using linear regression analysis without using repeated measurements. Our study population consisted of normal volunteers with a very wide range of values of BRS. This is in contrast to those studied by Robbe et al. [12] (nine males aged 22–28 years), Hartikainen et al. [9] (64 patients with cardiac disease aged 22–73 years), and comparable with those studied by Watkins et al. [13]. Our observations extend those of Watkins et al. [13] and suggest that the relatively weak agreement between the different measures of BRS is in part due to its high intrinsic variability. One # 1998 The Biochemical Society and the Medical Research Society
CONCLUSIONS We have shown that the Valsalva and spectral methods of estimation of BRS agree with phenylephrine infusion, although all methods are very variable. The spectral method (LF component) is least vulnerable to technical failure in this population and has the best reproducibility. Within the limits defined by this variation, a short headup tilt does not affect baroreflex sensitivity.
ACKNOWLEDGMENTS R.H.C. and S.W.L. are supported by the British Heart Foundation.
REFERENCES 1 Smyth, H. S., Sleight, P. and Pickering, G. W. (1969) Reflex regulation of arterial pressure during sleep in man. Circ. Res. 24, 109–120 2 Bristow, J. D., Honour, A. J., Pickering, G. W., Sleight, P.
Reproducibility of baroreflex sensitivity
3
4
5
6
7
and Smyth, H. S. (1969) Diminished baroreflex sensitivity in high blood pressure. Circulation 39, 48–54 Osterziel, K. J., Hanlein, D., Willenbrock, R., Eichhorn, C., Luft, F. and Dietz, R. (1995) Baroreflex sensitivity and cardiovascular mortality in patients with mild to moderate heart failure. Br. Heart J. 73, 517–522 Lagi, A., Cipriani, M., Fattorini, L., Pagetti, C. and Macerata, A. (1994) Observations on the arterial baroreflex in neurally mediated vasodepressor syncope. Clin. Auton. Res. 4, 307–309 La Rovere, M. T., Specchia, G., Mortara, A. et al. (1988) Baroreflex sensitivity, clinical correlates, and cardiovascular mortality among patients with a first myocardial infarction. A prospective study. Circulation 78, 816–824 McIntosh, S. J., Lawson, J. and Kenny, R. A. (1994) Intravenous cannulation alters the specificity of head up tilt testing for vasovagal syncope in elderly patients. Age Ageing 23, 317–319 Clayton, R. H., Bowman, A., Ford, G. A. and Murray, A. (1995) Measurement of the baroreflex gain from heart rate and blood pressure spectra : a comparison of spectral estimation techniques. Physiol. Measurement 16, 131–139
8 Berger, R. D., Akselrod, S., Gordon, D. and Cohen, R. J. (1986) An efficient algorithm for spectral analysis of heart rate variability. IEEE Trans. Biomed. Eng. 33, 900–904 9 Hartikainen, J. E. K., Tahvanainen, K. U. O., Mantysaari, M. J., Tikkanen, P. E., Lansimies, E. A. and Airaksinen, K. E. J. (1995) Simultaneous invasive and non invasive evaluations of baroreflex sensitivity with bolus phenylephrine technique. Am. Heart J. 130, 296–301 10 Creager, M. A. and Creager, S. J. (1994) Arterial baroreflex regulation of blood pressure in patients with congestive heart failure. J. Am. Coll. Cardiol. 23, 401–405 11 Bland, J. M. and Altman, D. G. (1986) Statistical methods for assessing agreement between two methods of clinical measurement. Lancet i, 307–310 12 Robbe, H. W. J., Mulder, L. J. M., Ruddel, H., Langewitz, W. A., Veldman, J. B. P. and Mulder, G. (1987) Assessment of baroreceptor reflex sensitivity by means of spectral analysis. Hypertension 10, 538–543 13 Watkins, L. L., Grossman, P. and Sherwood, A. (1996) Non invasive assessment of baroreflex control in borderline hypertension. Comparison with the phenylephrine method. Hypertension 28, 238–243 Received 28 January 1998/29 June 1998; accepted 1 July 1998
# 1998 The Biochemical Society and the Medical Research Society
581