threads access shared-memory locations in different order ..... works well with single-threaded programs. .... instructions to wait for it in order to dispatch.
Reproducible Simulation of Multi-Threaded Workloads for Architecture Design Exploration Cristiano Pereira†‡, Harish Patil‡, Brad Calder†$ † Computer
Science and Engineering, University of California, San Diego ‡ Intel Corporation $ Microsoft Corporation
Abstract As multiprocessors become mainstream, techniques to address efficient simulation of multi-threaded workloads are needed. Multi-threaded simulation presents a new challenge: non-determinism across simulations for different architecture configurations. If the execution paths between two simulation runs of the same benchmark with the same input are too different, the simulation results cannot be used to compare the configurations. In this paper we focus on a simulation technique to efficiently collect simulation checkpoints for multi-threaded workloads, and to compare simulation runs addressing this non-determinism problem. We focus on user-level simulation of multi-threaded workloads for multiprocessor architectures. We present an approach, based on binary instrumentation, to collect checkpoints for simulation. Our checkpoints allow reproducible execution of the samples across different architecture configurations by controlling the sources of nondeterminism during simulation. This results in stalls that would not naturally occur in execution. We propose techniques that allow us to accurately compare performance across architecture configurations in the presence of these stalls.
and instructions spent spinning for a lock can be different. As a result, the execution paths across two simulations are not guaranteed to be the same. If the variation in the execution paths is significant, two simulation runs cannot be compared directly, because the amount and type of work performed differs across executions. This non-determinism problem has been pointed out in previous research [1], [5]. In this paper, we present a technique to provide reproducible behavior of multi-threaded programs when simulated under different architecture configurations. Our technique focuses on user-level simulation of multi-threaded programs. We guarantee the same execution paths by removing the sources of nondeterminism during simulation. Our prior work [9] guarantees deterministic simulation of single and multi-threaded programs on uniprocessors. We build upon it and we extend the technique to guarantee reproducible behavior on multiprocessors as well. Our technique enforces the same order of sharedmemory accesses across simulations by introducing artificial stalls. We present an approach to account and deal with these artificial stalls, so that we can provide meaningful comparison across simulation runs for design space exploration. This paper makes the following contributions:
I. I NTRODUCTION Computer architects rely heavily on cycle-accurate simulation to help evaluate new design options. That and the fact that multiprocessor designs are becoming mainstream (by putting multiple cores on a single chip), urges the need for efficient simulation techniques for multiprocessor design exploration. In order to fully exploit the performance potential of these processors, parallel applications need to be studied. As a result, multi-threaded benchmarks, where many threads of execution share an address space, are very important. These applications can achieve significant speed-ups when running on processors with multiple cores. One example of such benchmarks is SpecOMP [2]. In addition to large instruction counts, benchmarks for future multiprocessors face another challenge when simulated: nondeterminism. The non-determinism comes from the fact that threads access shared-memory locations in different order across simulations of different architecture configurations. For example, the order in which locks are acquired by threads can be different across two runs. Also, the number of cycles
978-1-4244-2778-9/08/$25.00 ©2008 IEEE
•
•
•
173
We present a mechanism to create deterministic simulation checkpoints of user-level code for large multithreaded applications. The mechanism is based on Pin [6], allowing one to easily capture the execution of complex workloads in their native execution environments. Pin based checkpointing does not require the usually timeconsuming task of configuring the application to run on a whole-system simulator (e.g. license checks, special device-drivers, kernel dependencies, large storage requirements or elaborate installation procedures). We describe the implementation of a deterministic simulator, which consumes the checkpoints, and provides 100% reproducible behavior (execution of the same control paths) across different architecture configurations. Enforcing reproducibility during multi-threaded simulation introduces artificial stalls in the results. We provide techniques to account for the stalls, allowing comparison of two simulation runs for design space exploration.
II. C HECKPOINTS FOR R EPRODUCIBLE M ULTI -T HREADED E XECUTION The technique we use to collect user-level checkpoints for reproducible execution of multi-threaded workloads is based on our previous work [9], which automatically logs systemeffects for simulation. Our previous technique only guarantees reproducible simulation for multi-threaded programs running on uniprocessors. In this section we briefly review the technique and also describe the extensions we made to handle reproducible simulation of multi-threaded programs on multiprocessors as well. A. Checkpoints for Reproducible Simulation of Uniprocessors The previous approach for creating checkpoints for userlevel simulation creates log files that contain initial register state, including the program counter, and the memory image (code and data) values accessed by the program during execution. It also contains all system-effects to those registers and memory states. The checkpoints can be for either the full execution of the program or for just samples of execution. The samples could be hand-picked, or chosen using tools like SimPoint [12]. Our previous approach uses a Pin[6] tool called pinSEL [9], which is used to collect the checkpoints. The pinSEL tool dynamically instruments the program execution using application programming interfaces (APIs) provided by Pin. Those APIs allow one to instrument classes of instructions, specific functions, system calls and interrupt events. It allows the registration of calls to analysis routines, which are invoked when the instrumentation points specified are reached. After the analysis routines are executed, the program execution continues until the next instrumentation point is reached. pinSEL instruments every load and store instruction during the execution of the program to keep track of the user-level memory state. In addition, it also instruments every basic block during execution to keep track of the code pages touched and to copy them to the checkpoints. The tool also instruments system calls and interrupts in order to capture the changes in register state caused by them. A pinSEL checkpoint for a program’s execution is composed of the following log files: Code update log - This file contains initial memory values for the code regions touched during execution. Data update log - This file contains initial memory values for the data regions and the system effect changes to it. Register update log - This file contains the initial architectural register values and the system effects changes to them. Each entry in the log files contains a timestamp that tells when to restore that entry during simulation. A timestamp can be either a committed memory count or an instruction count. The memory count is the number of dynamic load or store macro (x86) instructions executed since the start of the logging. The instruction count is the dynamic count of all macro instructions executed since the beginning of logging. In order to reproduce the execution of a multi-threaded execution in an uniprocessor, one needs to reproduce the exact thread interleavings as observed during logging. In
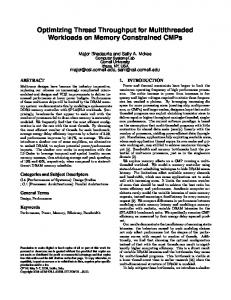
the prior approach [9], we created a Context Switch Log which contained entries representing the context switches that happened during execution. Since there is only one thread executing at a time in a uniprocessor, repeating the context switching reproduces the same interleavings of shared-memory dependencies. In addition, we also created the previously described log files for each thread. On multiprocessors though, recording the inter-leavings of threads is not sufficient to reproduce the execution. This is because threads are run in parallel in different processors and the execution depends on the order in which shared-memory locations are updated. Hence we need an approach to record the shared-memory dependencies across threads. B. Logging Shared-Memory Dependencies for Multiprocessors In this section, we explain our approach to provide multithreaded simulation on multiprocessors, thus improving our prior technique. To do this we need to record shared-memory dependencies across threads, and obey them during simulation. This means that the same execution paths and shared-memory dependencies seen during logging will be simulated from one simulation to the next. For logging shared-memory dependencies, there are two sub-problems that we need to solve. The first problem is related to detecting these shared-memory dependencies during logging. The second problem is related to efficiently logging this information to minimize the log size. Previous hardware proposals [17], [8] observed that shared-memory dependencies can be detected by just looking at the cache coherence messages in a multiprocessor system. They used the standard Netzer transitive reduction algorithm [10] to reduce the log size. Our approach for logging shared-memory dependencies is similar to the hardware proposal [17], but it is implemented completely in software. We also implement the Netzer transitivity reduction algorithm [10] to minimize log sizes. The Netzer algorithm works by exploiting the transitive property in a system that assumes sequential consistency. In Figure 1, for example, there is a read-after-write (RAW) dependency between StoreB on thread 1 and LoadB on thread 2. However, this dependency does not need to be logged, because the writeafter-read (WAR) dependency between LoadA on thread 1 and StoreA on thread 2 transitively implies it. In this paper, the instructions involved in the shared-memory dependencies are referred to as source and destination instructions. For example, LoadA in the WAR dependency is the source and StoreA the destination. Similarly, StoreB is the source instruction and LoadB the destination instruction. We later discuss how we collect a sequentially consistent memory order while logging shared-memory dependencies. This does not mean that we can only simulate sequentially consistent memory models, as we explain in section III. For detecting shared-memory dependencies during logging, we use a global data structure that emulates a cache coherence directory structure. This data structure is a hash table indexed by the effective address of a memory operation. The table is referred to as a directory hereafter. Each entry represents a range
174
Thread 1
Thread 2
1:Store B 2:Load A 1:Store A
generate checkpoints that have enough information to reproduce the execution of multi-threaded workloads on a multiprocessor architecture, even if the architecture configuration changes. In the next section we discuss the changes introduced in the simulator to implement deterministic simulation.
2:Load B Fig. 1. Example of transitive optimization. Two dependencies are illustrated: a read-after-write (RAW) between LoadB in thread 2 and StoreB in thread 1 and a write-after-read (WAR) between StoreA in thread 2 and LoadA in thread 1. The dotted arrow represents an implied dependency and the solid arrow a recorded dependency. We define LoadA in the WAR dependency as the source of the dependency and StoreA the destination.
of addresses and contains the thread identifier (ID) of the last thread to write to that address range, along with the timestamp of the memory operation that wrote to the address. In addition, each entry also contains a vector of timestamps indicating the last time each thread accessed that address range. These timestamps are used to create a log entry that represents the dependency between two instructions across the threads. The timestamps are also used to implement the Netzer optimization. The shared-memory dependencies are logged in a Race Log, maintained per thread, which has entries in the following format: . local_mcount is the memory count of the dependent (local) thread, remote_tid is the thread ID of the remote thread upon which the local thread depends on, and remote_mcount is the memory count of the remote thread. The local thread cannot execute its memory operation local_mcount until the remote thread identified by remote_tid executes its memory operation remote_mcount, because there is a dependency between the two. For every load and store instruction, the directory entry corresponding to the effective address of the memory instruction is accessed. The entry is accessed to log sharedmemory dependencies and also to update its fields. For the example in Figure 1, thread 2 would log a Race Log entry as follows: < 1, 1, 2 >. This indicates that thread 2 cannot execute memory instruction 1 until thread 1 finishes memory instruction 2. Before logging each dependency, we check whether there is another dependency between the two threads which implies the current dependency. If that is the case, we do not log it. In Figure 1, for example, thread 2 does not log the RAW dependency. Since the directory is shared across threads each entry is protected by a lock. This guarantees consistent state of the directory entries as well as gives us a valid sequentially consistent order for the shared-memory updates. This is because our implementation acquires and releases the directory lock for the entry accessed around the execution of every memory operation in the application. As a result, when the tool sees that a memory operation to a shared location from thread A happened after a memory operation from thread B for the same location, it must be the same sequence observed by the processor. By adding the Race Logs, our modified logging tool can
C. Memory Model and Deterministic Simulation Our approach for deterministic user-level simulation is execution-driven, but it is constrained by the logs. This allows simulation of relaxed memory models in which memory operations are allowed to go out of order. However, the access order for shared-memory locations must follow the order dictated by the logs, which provides determinism. Given this restriction, using deterministic simulation for performance evaluation of different memory consistent models will not allow those dependencies to change during design exploration. Those dependencies are resolved in the order recorded. Nevertheless, we can track when this occurs and account for it in the error estimate for our results.
D. Picking Samples for Simulation Our logging and simulation approach allows selecting the regions to checkpoint manually, or using techniques such as systematic sampling [16], [15] or Simpoint [12], [11]. The focus of this paper is not on picking samples, but to show that the samples can be simulated deterministically for design space exploration. Thus for this work we pick samples of execution uniformly.
III. D ETERMINISTIC S IMULATION In this section we describe the changes we made to the simulator we used in order to consume our user-level checkpoints. This allows us to reproduce the execution of workloads across different architecture configurations guaranteeing the same execution paths for each thread.
A. Deterministic Simulation Implementation We modified Asim [4] to consume our checkpoints. Asim is a framework to create and maintain architecture simulators. Asim defines a functional model and a performance model. The functional model is implemented as an instruction Feeder. The performance model dictates the execution by asking the Feeder to supply instructions. This allows a performance model to use different Feeders and vice-versa. We implemented a Feeder which supplies instructions and memory values from our checkpoints. Our Feeder supplies register values and memory effects for system calls by restoring them from the checkpoints during simulation. In addition, our Feeder dictates the order in which shared-memory accesses are performed.
175
1) Enforcing Shared-Memory Dependencies: Our checkpoints for simulation of multi-threaded workloads contain a pre-determined order in which shared memory is accessed, which is the order that was recorded during the collection of the logs. During simulation, the Feeder needs to tell the performance model that certain instructions must wait until their sharedmemory dependencies with other threads are resolved. A dependency is resolved when the performance model completes the memory operation. For the models we use, where a Processor Consistency memory model is implemented, the reads are completed at commit time and the writes are completed when the memory interconnection network makes the value visible to other processors. In the performance models where our deterministic simulation approach was implemented, when a memory operation completes the Feeder is notified so that it can update its own memory image. At this point, we also note whether shared-memory dependencies have been satisfied or not. The shared-memory dependencies recorded in the checkpoints are represented using counts of memory operations committed by the program. The performance models we used are timing-directed simulators [7]. This means that the performance model dictates the execution of the functional model, implemented in the Feeder, and the latter does not know that a control path is speculative until the actual branch instruction it is dependent on is resolved by the performance model. When an instruction is ready to be dispatched for execution because all its operand dependencies are satisfied and the functional units are available, we check whether this instructions has a logged cross-thread dependency. If it does, the instruction is not allowed to dispatch until the cross-thread dependency is resolved. This results in processor stalls during the execution, which hereafter we refer to as synchronization stalls. These stalls would not naturally occur in the execution of the program. They only exist in our simulation to guarantee determinism across executions in different architecture configurations. Note that synchronization stalls can also be generated when executing a wrong path. This is not a problem because the cycles spent synchronizing would be spent executing the wrong path anyway until the branch is resolved. 2) Using Netzer Optimized Race Logs: In Section II we mentioned that we use Netzer [10] optimization to log only the necessary dependencies to enforce thread ordering in a sequentially consistent model. In our experiments we found that the Netzer optimization reduces the race log size by two orders of magnitude. Using the optimization requires that all the memory instructions before the source of the dependency complete before the memory instruction which is the source of the dependence completes. Similarly, no memory instruction after the dependency-destination memory instruction is allowed to execute before it completed. In Figure 1, LoadA is the source of the WAR dependency and StoreA the destination. As a result, during simulation, no memory instructions after StoreA can execute before all memory instructions before LoadA have completed their memory operations.
We would like to benefit from the reduction in number of dependencies but still allow as much out-of-order execution of memory operations as the underlying memory consistency model implemented allows. This would minimize the amount of synchronization stalls when using deterministic simulation. Our goal is then to be able to determine whether there are any potential conflicts between the memory operations “before the dependency source” and “after the dependency destination” instructions. We do that by associating a bloom filter with each dependency logged. The bloom filter is a hash table indexed by the effective address of the memory instructions after the dependency destination. If the instruction has a dependency with any instruction before the dependency source, the bloom filter entry will have a one. Otherwise it will have a zero. Since instructions must be committed in order, the bloom filter only needs to contain the effective addresses of n instructions after the dependency destination, where n is the maximum number of instructions that can be in flight during the execution. The effective addresses of these instructions need to be checked against the effective addresses of the instructions before the dependency source. An alternative to using the bloom filter would be to log all the dependencies without using Netzer optimization. This would result in a two orders of magnitude increase in number of dependencies recorded in the Race Log file. During simulation, when a memory instruction younger than the instruction whose dependency has not been satisfied yet tries to execute, it checks the bloom filter for that dependency. If the bloom filter tells it that it is safe to execute, it does not need to stall. Otherwise it has to stall because there is a potential dependency with an instruction before the dependency source that may not have executed yet. 3) System Calls: Our approach is targeted for user-level simulation. As a consequence, no operating system code is simulated while executing from our checkpoints. Instead the system call side effects are restored from our log files. This works well with single-threaded programs. However, for multithreaded programs, when system calls executed during logging are not executed during simulation, the relative progress of threads with respect to one another is changed. Consequently a thread “jumps” ahead of the other threads during simulation, differently from what was observed when collecting the logs. To deal with this problem, whenever a thread executes a system call, our checkpointing tool also logs the instruction count of all threads being executed before and after the system call. This tells us the state of the other threads before and after the system calls and allows us to measure how much progress the other threads made while executing the system code. During simulation, a system call instruction is not actually executed, it is just skipped. Its register and memory side effects are restored nonetheless, to guarantee correct execution. To reproduce the behavior that was observed during logging for a system call, we force the thread to synchronize with all the other threads before and after the system call. This allows us to model the time spent on the system calls during simulation and maintain the threads synchronized with respect to the execution of the system calls, according to the logged
176
execution. We then deal with the system call stalls during our performance analysis, as described in the next section. IV. C OMPARING S AMPLES ACROSS A RCHITECTURE C ONFIGURATIONS The end goal of our simulation approach is to allow designers to evaluate the performance of a given architecture enhancement or feature. Hence throughout this section, we assume that a designer is comparing a baseline configuration with an experimental configuration. The designer wants to evaluate how fast or how slow the experimental configuration is relative to the baseline configuration. In the previous sections, we explained how we guarantee the same execution paths and therefore that the same amount and type of work is performed across both configurations, thus allowing one run in the baseline to be directly compared to another run in the experimental configuration. One consequence of the reproducibility of our approach is that we need to introduce synchronization stalls, which would not occur in the execution of the program. This section addresses how we take these stalls into account, and how we calculate errors in the performance estimate in the presence of the stalls. This involves comparing simulation samples to determine which architecture configuration performs better. In section VI, we present quantitative results on how our technique works for the design options we tested. A. Checkpointed Behavior and Baseline Configuration The program behavior simulated is for a valid execution of the benchmark on the processor where the checkpoints were collected. As a result, the relative progress of threads when collecting the checkpoints is potentially different from the relative progress observed during the simulation. This is because these two machines can be different. This results in synchronization stalls even for the baseline configuration. We later show that many of these stalls are commonly present in both the baseline and the experimental configuration. This means they are biased in the same direction for both configurations and therefore should not affect the relative performance comparison. B. Classifying Synchronization Stalls The determinism comes at the cost of synchronization stalls added during simulation. We keep track of the synchronization stalls introduced during the simulation and divide them up in four categories: True-Dependencies Stalls - These are stalls needed to enforce the order of cross-thread RAW dependencies. False-Dependencies Stalls - These are needed to enforce the order of cross-thread WAR/WAW dependencies. Before-System-Call Stalls - These stalls are introduced to make sure that whenever a thread is about to execute the instruction to invoke a system call, the other threads are approximately executing the same instructions as they were when the execution was recorded. After-System-Call Stalls - These stalls are introduced to model the time executing a system call. As explained in
Section III-A3, these are needed to maintain the threads synchronized with respect to the checkpoints, since they model the time spent executing the system calls in terms of instructions executed by the other threads. Synchronization stalls are introduced to ensure determinism. These introduce additional cycles during the simulation of a thread, which we need to track to determine an estimated error for the performance comparisons. When an instruction is stalled due to a shared-memory dependency, another instruction is allowed to be dispatched after the stalled instruction if it has no unresolved operand dependencies and it satisfies one of the following: 1) it is older than the instruction waiting for the dependency to be satisfied; 2) it is not a memory instruction; 3) it is a memory instruction younger than the instruction waiting for the shared-memory dependency but it has no potential cross-thread dependencies according to the bloom filter (associated with the youngest instruction stalling due to cross-thread dependencies). This means that while an instruction is stalling due to a crossthread dependency, other instructions can make progress. As a result, the pipeline is not stalled completely. Of course, if the synchronization stalls are long, eventually the pipeline will stall because internal processor queues (e.g. ROB) will fill up, preventing other instructions from making progress, or because the instruction is in the critical path of execution, causing other instructions to wait for it in order to dispatch. For measuring if an instruction that is stalled due to crossthread dependencies is in the critical path, we used a technique similar to [14]. The key observation is that an instruction is likely to be in the critical path if it reaches the bottom of the instruction queue before it is dispatched. In our deterministic simulator, whenever a thread is stalling due to a cross-thread dependency, we keep track of the number of cycles where instructions that are younger than the instruction stalling are allowed to dispatch. We also keep track of the number of cycles where instructions are not allowed to dispatch at all and the oldest instruction in the queue is the one stalling due to a cross-thread dependency. When the latter is true, it means that the pipeline is completely stalled due to the synchronization stalls of a shared-memory dependency. By doing this, we can keep track of the synchronization stalls which result in whole pipeline stalls. C. Matching Synchronization Stalls Across Configurations When simulating a given checkpoint sample on two different configurations, the relative progress across threads can lead to different behavior of these threads on each configuration. The difference in behavior results in threads reaching a sharedmemory update in different order than it happened in the recorded execution. This will lead to a different number of synchronization stalls for both configurations. As suggested earlier, some of these stalls are common across both configurations. This is because those stalls are present due to the difference between the behavior captured and the behavior being simulated. This difference in behavior can introduce stalls in the simulation, but the stalls will be common for
177
IPC with uncommon sync. stalls IPC with all sync. stalls
w-speed-up
IPC without any sync. stalls
IPC
both configurations. The non-common synchronization stalls are because of differences in the configuration. Those are resulting from variation in progress of threads with respect to one another, due to changes in the architecture. These need to be tracked in order to give a performance estimate for the simulation. Consequently we need to identify the common stalls across two runs, which will allow us to figure out the stalls resulting from changes in the simulated configurations. The mechanism to identify stalls which are common across configurations works as follows. We first simulate the two configurations. Each simulation run will create a file with all the dependencies which generated synchronization stalls. We refer to this file as a stall trace and each entry in the file is called a synchronization event. A synchronization event is an instruction which generates synchronization stalls presented in section IV-B. For each synchronization event we record the thread ID and the instruction count for the instruction that generated the event, along with the number of stalls generated. The thread ID and instruction counts uniquely identifies the stall event. Because the behavior of the threads is deterministic across the simulation runs, these synchronization events can be identified across runs (by the thread ID and instruction count). Hence we can match the synchronization events across the runs and calculate the number of stalls which are common across them. These are stalls originating from the same synchronization events. For example, if a dependency generated 50 synchronization stall cycles in one run, but 15 in the other, for the same event, 15 of those cycles are common. The other 35 cycles are only present in one run, due to difference in thread progress. We then calculate the difference in stalls for each run, and record this information in the stall traces. This difference is the total number of common synchronization stalls across all the runs subtracted from the total number of synchronization stalls for each run. This difference is later used to estimate the error when comparing simulations. The error is a result of the number of synchronization stalls introduced which are not common across the runs. This tells us how much the program was slowed down by the synchronization stalls in one simulated configuration with respect to the other simulated configuration.
1
S1
baseline experiment (a)
S2
S3
(b)
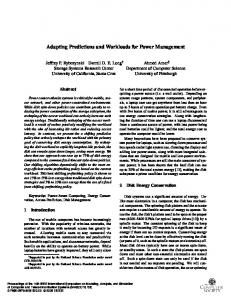
Fig. 2. (a) - IPCs with all synchronization stalls, with only common stalls and without any stall; (b) - Weighted Speed-up Calculation
because threads run at different rates of progress when running on different configurations. Consequently the instruction counts for each thread are different across the runs when simulating the samples. This happens because the samples are terminated when any of the threads terminates. Using the weighted-speedup helps mitigating this effect. Deterministic simulation increases the number of simulated cycles due to the synchronization stalls introduced. The increase in cycles is therefore a quantitative measure of error. The error in performance estimation between two runs of deterministic simulation is proportional to the difference in synchronization stall cycles between the runs of the same sample in different configurations. The difference comes from changes in thread’s progress in each configuration. The difference is the stalls not matched across the runs as explained in section IV-C. This allows us to calculate a range of IPCs that one can expect from simulating the sample. One IPC includes the synchronization stalls introduced that are not common across the runs and the other does not.
(1)
The method to compute speed-up is as follows. First we run the simulations for both the baseline and the alternative configurations. Then we match the common stalls from the two runs, as described in section IV-C, on a per thread basis. The goal of this step is to find out the common stalls. The non-common stalls in each configuration will be used to compute two IPCs for each thread. One IPC including the synchronization stalls which are uncommon across the configurations, referred to as IP C UC−STALLS , and one not including synchronization stalls at all, referred to as IP C NO−STALLS . Figure 2-(a) shows the hypothetical IPCs for the baseline and the experiment. There are three IPCs shown in the figure for each configuration. The lowest IPC shows the IPC with all the synchronization stalls. This is before we factor out the stalls which are common across the configurations. Once the common stalls are subtracted, we have an IPC with the uncommon synchronization stalls. This is what we call IP C UC−STALLS . The third IPC, the highest, includes no synchronization stalls at all. This is what we refer to as IP C NO−STALLS .
This formula equalizes the IPCs on a per-thread basis by dividing each thread’s IPC for the experimental configuration by its IPC in the baseline configuration. We use this metric
With both IP C UC−STALLS and IP C NO−STALLS for each thread, for the baseline and the experimental configuration, we then can compute two weighted speed-ups, ws low and ws high, as follows:
D. Calculating Sample Speed-ups Once we have calculated the difference in synchronization stalls across the simulated runs, we can then use it to estimate the error in performance resulting from the deterministic simulation. The metric to evaluate the performance difference between two samples used in this work is the weightedspeedup [13]. The formula to compute the speed-up is given in equation 1. ws =
1 #threads
� i∈threads
IP Cexpi IP Cbasei
178
Core Per Core Cache Hierarchy
2.4GHz, 4-issue, 128 ROB entries Separate Instruction and Data caches 32KB, 8-way, 64-byte line size Unified second level: 256KB, 8-way, 64-byte line size
Configuration name baseline
cfg1
TABLE I BASELINE SIMULATOR CONFIGURATION
cfg2
1 ws low = #threads ws high =
1 #threads
� i∈threads
�
i∈threads
UC−STALLS IP Cexp i NO−STALLS IP Cbase i NO−STALLS IP Cexp i UC−STALLS IP Cbase i
Parameters L1 Instruction and Data caches: 32KB, 8-way, 64-bytes line size L2 Unified cache: 256KB, 8-way, 64-bytes line size L1 Instruction and Data caches: 16KB, 8-way, 64-bytes line size L2 Unified cache: 128KB, 8-way, 64-bytes line size L1 Instruction and Data caches: 64KB, 8-way, 64-bytes line size L2 Unified cache: 512KB, 8-way, 64-bytes line size
TABLE II E XPERIMENTAL CONFIGURATIONS
(2) (3)
These two weighted speed-up calculations give a range of speed-ups expected from the architectural experiment, considering the errors measured as the amount of synchronization stalls which are not common across the two runs. If this range is completely below or completely above a speed-up of one, we can safely conclude that the experiment is either slower or faster than the baseline respectively. If the range of speed-ups contains one within its limits, then we cannot safely conclude if the experimental configuration is better than the baseline. These three situations are illustrated in Figure 2-(b), by the bars S1, S2, S3. For the first bar S1 we can safely conclude the experiment is slower than the baseline, the second bar S2 is inconclusive, and for the third bar S3, the experiment is faster than the baseline. From equations 2 and 3, it is also clear that the amount of stalls not common across the runs will determine the range of speed-ups, hence the need to compute it precisely. Section VI presents quantitative results on how the technique works for the benchmarks we studied. V. M ETHODOLOGY For this paper we used multi-threaded programs from the SpecOMP [2] benchmarks and we experimented with the proposed simulation methodology. We used 4-threaded runs of these benchmarks. The checkpoints were collected on a TM R 64-bits CPUs operating machine running with 4 Intel�Xeon at 3.66GHz and running the Linux operating system. For the results presented in section VI we used Asim [4] simulating a hypothetical 4-core 64-bits x86 processor. The baseline configuration relevant for this work is presented in Table I. In this paper, the number of threads is the same as the number of cores simulated. Hence we map each thread to one core. During simulation, a sample is terminated when the first thread in the sample executes all of its instructions for that sample. In this work we did not intend to choose representative samples for simulation as we discuss in section II-D. We collected samples uniformly throughout the execution of each program. We chose to collect 10 samples for each benchmark, each with approximately 280 million instructions on average. The size
of the checkpoint log files was on average 14KB per million instructions. On average the collection of checkpoints was 27 times slower than the native execution of the benchmarks. We ran the benchmarks for different configurations presented in section VI. We then computed the weighted speedups as presented in section IV-D across the different runs. This gave us a range of possible speed-ups that we discuss in the next section. VI. E VALUATION We evaluated our technique for deterministic simulation using the benchmarks mentioned in section V. In this section we present the results for the architectural configurations we simulated. Our experiments change the cache size of the cores according table II. A. Estimating the speed-ups across simulation runs The first set of results we present is the number of synchronization stalls present in the baseline configuration for the benchmarks we simulated. These are resultant from the differences in behavior between the run captured with our tool and the run observed during simulation. Figure 3 shows the results for the SpecOMP benchmarks. The figure breaks down the synchronization stalls in the four categories we described in section IV. For SpecOMP, on average, 10.8% of the cycles spent during simulation of the samples are due synchronization stalls. From these, 6.5% of the cycles were due to system calls, and the 4.3% for the other shared-memory synchronization stalls. Note that the approach presented in the paper eliminates many of these stalls as it will be discussed later in this section. We believe this is the most important contribution of this paper. By discovering the stalls which are common across configurations we are able to eliminate many of these stalls. The synchronization stalls presented in figure 3 are intrinsic to the checkpoints, because of the reasons discussed in section IV-A. We next experimented with simulation runs for two different configurations. Our objective was to examine how many synchronization stalls are common across configurations and, from that, to determine the difference in stalls due to changes in the configurations simulated.
179
% of synchronization cycles breakdown
true dep
20%
false dep
before system call
after system call
15% 10% 5% 0%
m am
si ap
plu ap
p
ke ua q e
l lge a g
d a3 fm
ge era v a
se wi p wu
Fig. 4.
1.36% 1.00%
true dep
false dep
before system call
after system call
2%
0.80% 0.60% 0.40%
average-cfg1
average-base
wupwise-cfg1
wupwise-base
galgel-cfg1
galgel-base
fma3d-cfg1
fma3d-base
equake-cfg1
equake-base
apsi-cfg1
apsi-base
applu-cfg1
applu-base
0.00%
ammp-cfg1
0.20% ammp-base
% stalls not common between baseline and cfg1
Fig. 3. Percentage of synchronization stall for baseline configuration broken down in categories: (a) true-dependencies (RAW); (b) false-dependencies (WAR/WAW); (c) Before-System-Call; (d) After-System-Call
Percentage of synchronization stalls not common across the baseline and cfg1, w.r.t. the total number of cycles simulated
We simulated the configurations presented in table II. Figure 4 shows the percentage of cycles relative to the total number of cycles simulated, which are not common across the runs of the baseline and cfg1. For ammp, for instance, just under 1% of the execution cycles for the baseline were spent with synchronization stalls that are not common with the synchronization stalls introduced when running cfg1. Conversely, 1.36% of the cycles spent with synchronization stalls, when running cfg1, are not common with the baseline. fma3d had 2% of its cycles, when running configuration cfg1, not common with the baseline. For the other SpecOMP programs, these percentages are smaller. The differences in synchronization stalls presented in figure 4 should correlate directly with the errors in speed-up predictions across the two configurations. This is because those differences are used to compute a range of IPCs for each thread and consequently the range of weighted speedups expected. Figure 5 shows the weighted speed-up computations between the baseline configuration and configurations cfg1 and cfg2. The figure shows sets of four bars. The first two bars in each set (cfg1-nomatch and cfg2-nomatch) show the weighted speedup results when using all synchronization stalls (common and not-common) in the computation. This represents a scheme similar to the approach proposed by
prior work [5], where stalls are not matched across simulation runs. All the synchronization stalls are used when computing the range of speed-ups. In their work presented in [5], the error bars are not as high as shown in Figure 5 because the checkpoints were collected using the simulator, configured to model the baseline architecture. Note that collecting the checkpoints using a detailed simulator is not a practical approach, because the instruction count of multi-threaded applications for modern processors are in the order of trillions of instructions (e.g SpecOMP). The second two bars (cfg1-match and cfg2match) show the weighted speed-ups when using the algorithm described in section IV-D, which matches the common stalls and uses only the difference in stalls to compute the estimates. ammp is the benchmark with the highest range of speedup estimations. Between the baseline and cfg1, the speed-up ranges from 0.949 to 0.972. Between baseline and cfg2, the speed-up range is between 1.07 and 1.092. This difference is smaller for the other benchmarks, some of which are invisible in the figure. As expected, the error in the weighted speed-up calculation very closely tracks the percentages of synchronization stall cycles not common across the configurations. It is clear from the figure that not matching the stalls across the runs leads to very large speed-up range estimations, which do
180
not give the designer conclusive information. This emphasizes the importance of matching the common stalls across the configuration runs which is a contribution of our work. B. Limitations of Deterministic Simulation This paper indicates that deterministic simulation can be used for evaluating design changes for multi-threaded workloads. We have shown for different cache configurations that we can determine a range of speed-ups expected from the design change. One limitation of deterministic simulation is that the order in which shared-memory updates are performed is fixed across simulations. As a result, deterministic simulation may not be as applicable when evaluating design changes that require shared-memory updates to be resolved differently. One example is comparing the performance of two different memory models. Nevertheless, deterministic simulation is useful for evaluating things such as cache configurations, branch predictions and changes in pipeline width. In addition, the approach is also useful for applications with infrequent interactions through shared memory, such as many multithreaded Windows applications. For applications with a finer level of sharing, the technique is also applicable but there is a potential for more artificial stalls, which can result in wider ranges of speedup estimations. Finally, even though the same behavior is enforced, differences in performance configuration are accounted by tracking the artificial stalls and using them to compute speedup errors/ranges. Another limitation of deterministic simulation is that for some design options, if the amount of synchronization stalls not common across the runs is too high, the results given by the simulation may not be conclusive. This happens when the range of speed-ups includes one within its limits (case S2 in Figure 2-(b)), in which case one is not sure whether the experimental architectural is slower or faster than the baseline. If this happens, one can resort to methods to break down the samples around execution points where the number of synchronization stalls is too high. This would result in smaller samples without large synchronization stalls, which are resultant from large deviations in thread behavior. Another alternative is to collect more samples to verify if the same results hold across all the samples. Finally, our approach only simulates the user-level code and the shared libraries. Hence our approach is more suitable for applications which do not spend significant time in the OS code. Examples are scientific applications such as HPC applications, which spends most of the execution on user-code. Microsoft SQL application also spends over 90% of the time executing user-level code (they have little dependencies on the kernel for performance reasons). The SpecOMP applications we examined also do spend significant time executing userlevel and shared library code. VII. R ELATED W ORK This section discusses prior work related to handling nondeterminism when simulating multi-threaded workloads on multiprocessors and sampling of multi-threaded workloads.
A. Dealing with Non-Determinism Non-determinism in the execution of multi-threaded workload has been recognized in prior research work. Alameldeen et al [1] shows that for multi-threaded workloads, in particular server workloads, non-determinism can affect simulation results significantly, because the execution paths of the program and OS scheduling can change the behavior of the runs dramatically. They propose the use of statistical techniques to handle the problem. In their approach one simulates a program on the same configuration multiple times, inserting random perturbations to induce different behavior. This allow them to estimate the average behavior in that configuration within a confidence level. The same thing is done for a second configuration. After that they can conclude which configuration is better using statistical techniques. The cost of their technique is the requirement to run the program multiple times for the same configuration. Very small configuration changes can results in a large number of runs, which can be impractical. Our technique proposes running the program only once for each configuration and comparing the runs directly. Lepak et al [5] proposed deterministic simulation for fullsystem simulators. Their work presented the first implementation of a full-system deterministic simulator which introduced artificial stalls to ensure determinism. Our work differs from theirs in many aspects. First, we propose a binary instrumentation approach for efficient collection of the checkpoints. This makes it practical to collect checkpoints for large applications such as SpecOMP programs. Second, we propose user-level deterministic simulation. To be able to use this for multithreaded simulation, we had to track synchronization stalls before and after system calls and include them in our error model. The most significant improvement we made is the tracking and matching of the common stalls across simulation runs precisely, and only using the stalls that are different between the configurations towards the performance estimates. This significantly reduced our error bars over the prior results and allowed us to distinguish smaller speedups.
B. Simulation Sampling of Multi-Threaded Workloads In this section we briefly discuss techniques used for selecting simulation regions of multi-threaded programs and how our technique can be used with them. Wenisch et al [15] proposed the use of statistical sampling for server throughput multi-threaded applications, along with a technique to create checkpoints samples which store warm-up data for the microarchitecture. Ekman et al [3] also proposed the use of statistical sampling for simulation of multi-threaded workloads. They have shown that fewer samples are needed when the goal is to compare the performance of two configurations. This is because the variance between the difference in performance of a program across the configurations is lower than the variance in performance for each configuration. Perelman et al [11] proposed a phase guided technique for selecting simulation regions for multi-threaded programs. They do not deal with the non-determinism problem in their
181
weighed speed-up (average across samples)
cfg1-nomatch 1.1 1.05 1 0.95 0.9 0.85 0.8 0.75 0.7 0.65
1.21 1.36
ammp
1.30 1.36
applu
apsi
cfg2-nomatch 1.17
equake
1.36
fma3d
cfg1-match 1.15 1.22
galgel
cfg2-match 1.15
wupwise
1.21
average
Fig. 5. Weighted speed-ups computation for baseline against cfg1 and cfg2, when using all the synchronization stalls to compute the performance, and using only the non-commons synchronization stalls across the runs (our approach). Some of the bars have no visible error bars, because the error is very small.
approach. Our work is orthogonal to theirs, and could be easily integrated to pick representative region samples for simulation. VIII. S UMMARY AND F UTURE D IRECTIONS As multiprocessors become mainstream, simulation of multi-threaded applications is of primary importance. Simulating these applications poses all the challenges that exist when simulating single-threaded programs. In addition, simulation of multi-threaded workloads suffer from non-determinism. This paper presented a technique to handle the nondeterminism problem in multi-threaded simulation for multiprocessor designs. Our technique focuses on user-level deterministic simulation. Our simulation is deterministic because the behavior of the benchmark is completely reproducible from run to run, by controlling the sources of non-determinism. We presented an efficient technique to create checkpoints for deterministic simulation of multi-threaded workloads, which records the order of shared-memory updates. We also presented the implementation of a deterministic simulator that consumes these checkpoints. Our technique introduces stalls during the simulation which would not naturally occur so we can control the progress of threads and ensure a deterministic execution. We presented a technique to account for and deal with these stalls in order to provide a performance estimate for the simulation runs. For future work, we would like to look at selecting representative samples using a technique similar to [11]. In this paper we presented a technique for relative performance analysis. We would also like to come up with a technique for absolute performance projection for multi-threaded programs using deterministic simulation. R EFERENCES [1] A. R. Alameldeen and D. A. Wood. Variability in architectural simulations of multi-threaded commercial workloads. In Annual International Symposium on High Performance Computer Architecture (HPCA-9), 2003. [2] Vishal Aslot, Max J. Domeika, Rudolf Eigenmann, Greg Gaertner, Wesley B. Jones, and Bodo Parady. Specomp: A new benchmark suite for measuring parallel computer performance. In WOMPAT ’01: Proceedings of the International Workshop on OpenMP Applications and Tools, pages 1–10, London, UK, 2001. Springer-Verlag. [3] Magnus Ekman and Per Stenstrom. Enhancing multiprocessor architecture simulation speed using matched-pair comparison. In Proceedings of the International Symposium on Performance Analysis of Systems and Software, 2005.
[4] J. Emer, P. Ahuja, E. Borch, A. Klauser, C.K. Luk, S. Manne, S. S. Mukherjee, H. Patil, S. Wallace, N. Binkert, R. Espasa, and T. Juan. Asim: A performance model framework. Computer, 35(2):68–76, 2002. [5] Kevin M. Lepak, Harold W. Cain, and Mikko H. Lipasti. Redeeming ipc as a performance metric for multithreaded programs. In PACT ’03: Proceedings of the 12th International Conference on Parallel Architectures and Compilation Techniques, page 232, Washington, DC, USA, 2003. IEEE Computer Society. [6] C. K Luk, R. Cohn, R. Muth, H. Patil, A. Klauser, G. Lowney, S. Wallace, V. J. Reddi, and K. Hazelwood. Pin: Building customized program analysis tools with dynamic instrumentation. In Programming Language Design and Implementation, Chicago, IL, June 2005. [7] Carl J. Mauer, Mark D. Hill, and David A. Wood. Full-system timingfirst simulation. In SIGMETRICS ’02: Proceedings of the 2002 ACM SIGMETRICS international conference on Measurement and modeling of computer systems, pages 108–116, New York, NY, USA, 2002. ACM Press. [8] S. Narayanasamy, G. Pokam, and B. Calder. Bugnet: Continuously recording program execution for deterministic replay debugging. In ISCA, June 2005. [9] Satish Narayanasamy, Cristiano Pereira, Harish Patil, Robert Cohn, and Brad Calder. Automatic logging of operating system effects to guide application-level architecture simulation. In SIGMETRICS ’06/Performance ’06: Proceedings of the joint international conference on Measurement and modeling of computer systems, pages 216–227, New York, NY, USA, 2006. ACM Press. [10] R. H. B. Netzer. Optimal tracing and replay for debugging sharedmemory parallel programs. In Proceedings of the ACM/ONR Workshop on Parallel and Distributed Debugging, pages 1–11, 1993. [11] Erez Perelman, Marzia Polito, Jean-Yves Bouguet, John Sampson, Brad Calder, and Carole Dulong. Detecting phases in parallel applications on shared memory architectures. In IEEE International Parallel and Distributed Processing Symposium, pages 25–29, 2006. [12] T. Sherwood, E. Perelman, G. Hamerly, and B. Calder. Automatically characterizing large scale program behavior. In ASPLOS-X, October 2002. [13] Dean M. Tullsen and Jeffery A. Brown. Handling long-latency loads in a simultaneous multithreading processor. In MICRO 34: Proceedings of the 34th annual ACM/IEEE international symposium on Microarchitecture, pages 318–327, Washington, DC, USA, 2001. IEEE Computer Society. [14] Eric Tune, Dongning Liang, Dean M. Tullsen, and Brad Calder. Dynamic prediction of the critical dependence path. In Proceeedings of the 7th International Symposium On High Performance Computer Architecture, 2001. [15] Thomas F. Wenisch, Roland E. Wunderlich, Michael Ferdman, Anastassia Ailamaki, Babak Falsafi, and James C. Hoe. Simflex: Statistical sampling of computer system simulation. IEEE Micro, 26(4):18–31, 2006. [16] Roland E. Wunderlich, Thomas F Wenisch, Babak Falsafi, and James C. Hoe. SMARTS: Accelerating microarchitecture simulation via rigorous statistical sampling. In ISCA-30, June 2003. [17] M. Xu, R. Bodik, and M. Hill. A flight data recorder for enabling fullsystem multiprocessor deterministic replay. In 30th Annual International Symposium on Computer Architecture, San Diego, CA, 2003.
182