IEEE TRANSACTIONS ON MEDICAL IMAGING, AUGUST 2011
1
RERBEE: Robust Efficient Registration via Bifurcations and Elongated Elements applied to retinal fluorescein angiogram sequences Adria Perez-Rovira, Raul Cabido, Emanuele Trucco, Stephen McKenna, Jean Pierre Hubschman
Abstract—We present RERBEE (Robust Efficient Registration via Bifurcations and Elongated Elements), a novel featurebased registration algorithm able to correct local deformations in high-resolution ultra-wide field-of-view (UWFV) fluorescein angiogram (FA) sequences of the retina. The algorithm is able to cope with peripheral blurring, severe occlusions, presence of retinal pathologies and the change of image content due to the perfusion of the fluorescein dye in time. We have used the computational power of a graphics processor to increase the performance of the most computationally expensive parts of the algorithm by a factor of over ×1300, enabling the algorithm to register a pair of 3900 × 3072 UWFV FA images in 5-10 minutes instead of the 5-7 hours required using only the CPU. We demonstrate accurate results on real data with 267 image pairs from a total of 277 (96.4%) graded as correctly registered by a clinician and 10 (3.6%) graded as correctly registered with minor errors but usable for clinical purposes. Quantitative comparison with state-of-the-art intensity-based and featurebased registration methods using synthetic data is also reported. We also show some potential usage of a correctly aligned sequence for vein/artery discrimination and automatic lesion detection. Index Terms—Deformable registration, Retina, Fluorescein Angiogram, GPU.
I. I NTRODUCTION HIS paper presents a robust registration algorithm, RERBEE (Robust Efficient Registration via Bifurcations and Elongated Elements), able to register high-resolution ultra-wide field-of-view (UWFV) fluorescein angiogram (FA) sequences of the retina. RERBEE estimates accurately the nonrigid transformation aligning sequence frames, a crucial step towards FA sequence summarisation, quantification, and automatic lesion detection using temporal analysis. Preliminary summarisation work is also described in this paper. Our implementation takes advantage of recent developments in Graphic Processing Units (GPUs), reducing the time required to register a sequence by three orders of magnitude (×1300).
T
Adria Perez-Rovira is with the School of Computing at University of Dundee (UK),
[email protected]. Raul Cabido is with Departamento de Ciencias de la Computacion at Universidad rey Juan Carlos, Madrid (Spain),
[email protected]. Emanuele Trucco is with the School of Computing at University of Dundee (UK),
[email protected]. Stephen McKenna is with the School of Computing at University of Dundee (UK),
[email protected]. Jean Pierre Hubschman is with the Jules Stein Eye Institute, Los Angeles (USA),
[email protected]. Copyright (c) 2011 IEEE. Personal use of this material is permitted. However, permission to use this material for any other purposes must be obtained from the IEEE by sending a request to
[email protected].
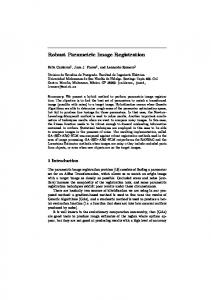
(a)
(b)
(c)
(d)
Fig. 1. Four frames from a UWVF FA sequence. (a) Arterial phase. (b) Arteriovenous phase. (c) Venous phase. (d) Late venous phase. Several occlusions and changes of intensity and content can be appreciated. Note the large amount of peripheral region visible in these images, the eyelashes occluding part of the vessel structure, and the lack of contrast in the late venous phase. (Best viewed on electronic version)
A preliminary version of our work appeared in [1]. New contributions here include use of a new vessel segmentation, use of bifurcations at each iteration, a new bifurcations descriptor, GPU modules, new synthetic experiments, use of real data, validation of results by an ophthalmologist, and illustrative experiments on sequence summarisation. Fluorescein angiography contributes to the diagnosis and management of many ocular pathologies including age-related macular degeneration (ARMD), diabetic retinopathy, retinal vascular occlusions and vasculitis. [2]. Quantification of retinal lesions (e.g., retinal non-perfusion) by clinicians is subject to inter- and at times intra-grader variability depending on knowledge and experience [3], [4]. Increased accuracy and repeatability could improve clinical studies and ultimately patient care. Traditional fluorescein angiography using fundus imaging affords a 30 − 50◦ field of view (FOV), or, with sweeps, up to 100◦ FOV. With macula or optic disc-centred images, this misses the periphery altogether, and the impact of peripheral non-perfusion on pathologies such as diabetic retinopathy and
IEEE TRANSACTIONS ON MEDICAL IMAGING, AUGUST 2011
central retinal vein occlusion has been emphasised [2], [5]– [7]. Recent developments of scanning laser ophthalmoscopes (SLO) have introduced UWFV imaging, achieving up to 200◦ FOV; such instruments are becoming increasingly common. Recent work has shown how UWFV angiography provides visualisation of peripheral retinal lesions valuable for assessment and treatment [8], [9]. FA sequences involve the intravenous administration of fluorescein, a dye that absorbs light in the blue spectrum, and emits yellow-green light. Acquiring each frame takes around 300ms with an OPTOS SLO. This uses a confocal laser producing high-resolution images (3900 × 3072 pixels) with depth selection, spanning up to 200◦ FOV. FA UWFV sequences usually contains 10 − 30 frames acquired manually at irregular intervals. The dye circulation makes different portions of the vasculature become visible in different frames. Briefly, an FA sequence can be divided into four phases (Figure 1): i) arterial (dye perfuses arteries only); ii) arteriovenous (artery and veins visible simultaneously); iii) venous (arteries fade out); iv) late venous (veins fade out). Most sequence frames normally are from the arterial and arteriovenous phases, during which clinical parameters are sought (e.g., time to peak). Changes between phases present a notable challenge to registration, as the vascular portions visible change nonlinearly across frames. Therefore, a registration algorithm must accommodate content changes in addition to appearance changes (such as those produced by different sensors imaging the same organs which are nevertheless always visible). Nonrigid deformations between frames are due to the eye anatomy, head and eye movements, and mobile hardware components. Retinal curvature distorts and blurs the appearance of the periphery as the tangent plane rotates away from one frontoparallel to the camera. Additionally, eyelashes and skin may occlude some parts of the retina (Figure 1). For clarity, we summarise the challenges posed by UWFV FA sequences: • • • • • • •
nonrigid deformations between frames; change of content between different phases; vessel segmentation errors in the late phases, caused by low contrast; high data volume (3900 × 3072 pixels per frame); peripheral blurring induced by the retinal surface curvature; possible lesions (e.g., leakages, ischemic areas); skin and eyelashes occlusions.
To overcome these challenges, RERBEE uses vessel segments and bifurcations as features to estimate arbitrary, deformable alignment fields. RERBEE corrects local deformations and is robust to occlusions, changes of content and incomplete vessel extraction. Notice that the term occlusion is used in this paper to describe regions where no retina is visible due to the presence of eyelashes, eyelids, or other artifacts and should not be confused with non perfused retinal areas, where no vasculature is present because of the lack of blood flow. Bifurcation points present a greater discriminative power than vessel segments, but few are detected in the periphery,
2
where vessel segments become an important cue for accurate registration. Due to content changes in time, large numbers of wrong feature matches might be expected. To make the registration robust to such errors, we apply contextual constraints, removing matches inconsistent with their neighbours (Figure 8). General-purpose computation abstraction layers like NVIDIA CUDA allow non-graphics-specialised developers relatively easy access to the substantial computational power offered by Graphic Processing Units (GPUs), including efficient GPU memory management, involving GPU kernel functions from C, CPU-GPU memory data transfer, and synchronising the parallelism of thousands of light-threads running on the GPU [10]. RERBEE delegates to GPU functions the most computationally expensive parts of the algorithm: the generation of dense displacement fields. That allows the algorithm to registration 2 frames in 5-10 minutes. Our algorithm focuses on registering UWFV FA sequences, the challenges of which have not been reported by deformable registration methods previously. We also point out further image processing techniques that would enable automatic lesion detection using registered sequences. We report quantitative measurements on synthetic data, comparing our method with state-of-the-art intensity-based and feature-based algorithms to demonstrate the importance of focusing on content changes and not only appearance changes. Quantitative and qualitative results are reported for synthetic and real data. II. R ELATED WORK The target of any medical image registration method is to find correspondences over anatomical and functional features between images, eliminating non-desired motions and deformations. We refer the reader to a few of the recent surveys in the vast literature on medical image registration [11]–[13]. Many state-of-the-art registration methods exist for singleand multi-modal medical images [14]–[16]. Registration algorithms can be classified in various ways. From the point of view of correspondence they can be grouped into two categories: a) Intensity-based algorithms, that estimate a transformation between images using a similarity measure based on the intensity of the pixels; b) Feature-based algorithms, that rely on the extraction and matching of features present in the images (e.g., corner points, SIFT features, vessel centerlines, bifurcations). Intensity-based algorithms [14], [15], [17]–[20] are preferable if there is no change of content between images, as every pixel can be used to drive the registration and no feature extraction is required. Change of content and severe occlusions make similarity metrics based on pixel intensity unusable. In such cases a feature-based [21]–[26] algorithm identifying corresponding features in both images is preferable, assuming features invariant to change can be identified. Vessel geometry is a common choice in retinal images as discussed below. To the best of the authors’ knowledge, no deformable image registration method has been tested so far using UWFV FA sequences. Nevertheless, a wide range of techniques have been used to register colour and FA fundus images of the retina.
IEEE TRANSACTIONS ON MEDICAL IMAGING, AUGUST 2011
Numerous techniques have been published for registration of retinal images for uni-modal fundus images, mainly using feature-based registration techniques relying on the vascular tree and its bifurcations. A quadratic transformation (12 parameters) has been widely used because the 3-D shape of the eye fundus is approximated well by a quadratic surface. In Stewart et al. [21], vessel bifurcations are extracted and used to find the 12-parameter quadratic transformation between two images by means of an iterative process that evaluates the registration using a growing region. They tested a single case of multi-modal images (red-free and FA fundus image) but quantitative results were only presented for uni-modal red-free image pairs. In Fang et al. [19], a cost function is minimised to achieve a non-rigid transformation between two fundus images. The vascular tree is extracted and converted into a set of short straight lines that are used to drive iterative deformation. Once the deformation of the vessel structure is estimated, a dense field of displacement is computed and applied to the source image. Chanwimaluang et al. [27] use a hybrid approach that combines area-based and feature-based methods to estimate the quadratic transformations between seven red-free fundus images to compose a mosaic. Some other techniques have focused on multi-modal retinal image registration. Laliberte et al. [22] use vessel bifurcation points to estimate an affine or second-order polynomial transformation between colour and fluorescein fundus retinal images. Asvestas et al. [24] use vessel centerlines and bifurcation points to compute the affine transformation between a red-free and an FA fundus image using a novel implementation of self organising maps. In Chen et al. [26], a Harris corner detector is run and partially intensity-invariant feature descriptors are extracted at salient points. A secondorder polynomial transformation is then estimated between red-free, infrared and FA fundus images. A small number of papers have focused on FA sequence registration: Nunes et al. [17] achieve a multi-scale intensitybased registration of FA image pairs by computing the morphological gradient of two consecutive frames of a FA fundus sequence. Intensity variations are taken into account by incorporating two constant multiplicative and additive factors. The final transformation is a composition of a translation and a local affine transform. In Choe et al. [23], bifurcation points are extracted and used to drive a random sample consensus (RANSAC) rigid registration on fundus FA sequences. Dreo et al. [18] use an intensity-based approach to rigidly register fundus FA sequences. Kubeka et al. [20] use mutual information to register FA small field of view (20◦ ) images combining a global affine transformation and a local free form deformation based on B-splines. Tsai et al. [25] adapt their previous work on dual-bootstrap, 12-parameter quadratic transformation registration based on Lowe keypoint generation and matching [21] to align small FOV fundus FA sequences. III. M ETHODOLOGY In this section we describe our fully automatic algorithm that takes a complete UWFV FA sequence as input and aligns its images automatically. The full sequence registration is
3
based on pairwise RERBEE registration as pictured in Figure 2. Section III-A gives an overview of the algorithm. Section III-B describes the vessel segmentation method. Section III-C describes how the graph that contains the Bifurcations and Elongated Elements Structure (BEES) is created. In Section III-D, the RERBEE pairwise registration algorithm is explained in detail. Finally, in Section III-E we outline how an entire UWFV FA sequence is automatically registered.
Fig. 2. RERBEE pairwise registration algorithm. The parameter β is explained in Section III-D
To minimise the impact of thresholds in the system, values depending on image size or resolution are made proportional to the optic disc diameter in pixels, which we denote as δ. Optic disc diameter can be estimated manually or automatically [28], [29]. This enables the system to be used on different data sets independently of resolution and field-of-view. A. Overview Vessels are segmented independently in each frame and post-processing is applied to extract the BEES representing the vasculature structure (bifurcations and segments). To register a complete FA sequence, one frame is automatically chosen as an anchor frame and other frames’ BEES are warped onto the anchor BEES using the pairwise RERBEE method. Once structures are aligned, their deformation is extrapolated to each pixel of the source frame using an efficient GPU implementation, generating a dense field of displacements (DFD). Finally, the source frame can be aligned with the anchor frame using the DFD. B. Vessel Segmentation In order to segment the vessels by classifying each pixel as vessel or non-vessel, we used a specialised method for UWFV presented in [30]. This method first enhances tubular structures using a steerable filter; high-response areas are then automatically penalised in order to promote the extraction of peripheral isolated blurred segments. Finally an automatic threshold obtained by modelling the stability of the number of regions is applied in order to binarise the image.
IEEE TRANSACTIONS ON MEDICAL IMAGING, AUGUST 2011
4
C. Bifurcation and Elongated Elements Structure creation The binary segmentation mask is used to produce a BEES, denoted as Φ, that represents the retinal vasculature network. This structure contains two types of elements, the bifurcations and the elongated elements (vessel segments between bifurcations) denoted as γ and ϵ respectively. To generate Φ, the binary vessel segmentation is thinned to 1 pixel wide structures using the MATLAB implementation of [31]. Bifurcations (points with 3 connected neighbours) and end points (points with only 1 neighbour) are detected by mathematical morphology with a battery of structured elements representing the possible masks [32]. Any connected path between two bifurcations or end points will be considered an elongated element ϵ corresponding to a vessel segment. The notation used in this paper is Φ = {V , B}, where V represents the set of vessel segments and B the set of bifurcations. V = {ϵ1 , ..., ϵN } where N is the number of vessel segments. Each vessel segment ϵ is composed of a list E of centerline points and a list O of orientations at those points. Therefore ϵn = {E, O}, where E = [e1 , ..., eH ], O = [θ 1 , ..., θ H ], and H is the number of points in the n-th vessel segment ϵn . eh = [xh , yh ]T is the location of the h-th centerline point and θ h is the 2D-vector describing the local orientation of the vessel at eh . B = {γ1 , ..., γM } where M is the number of vessel bifurcations. Each γ contains information on its location and its descriptor, denoted as γm = {g m , λm }, with g m = [xm , ym ]T representing the location of the m-th bifurcation and λm its descriptor. The descriptor λm consists of a mask with all the values of the binary segmentation around g m in a square window of side 6δ stored in a 1D-vector; considering that thicker vessels have a width no bigger than 8δ , this empirically set value captures the bifurcation geometry.
Fig. 3. BEES created using the binary segmented image (vessel segments in red and bifurcations in blue) superimposed on the original frame (04-BRVO, frame 6). Notice how the pathology present in the upper right part of the retina and the occlusions in the periphery produce false positive vessel segments. (Best viewed on electronic version)
Due to the noisy nature of FA images, including presence of pathologies and blurring, some vessels might be broken and some spurious ones may appear. First, we merge vessel segments that are close and aligned with respect to each other. A feasibility measure cj,k for two segments to be merged is:
cj,k =
(|θ j · z j,k |)(|θ k · z j,k |) √ ∥z j,k ∥
(1)
where z j,k is the vector that connects the ends of ϵj and ϵk . θ j and θ k are the vessel orientations at the considered vessel ends. If cj,k > 0.2 (an empirically established threshold) the two segments are merged into a single one. In order to remove isolated short vessels, any spurious ϵ with neither end connected to any other ϵ and with a length less than 6δ is removed from the Φ structure. Figure 3 shows the BEES extracted from a UWFV FA frame. D. RERBEE Pairwise Registration The RERBEE pairwise registration algorithm outputs a DFD, D, that warps the source frame F s onto the target frame F t , where s stands for source and t for target. As shown in Figure 2, the algorithm iteratively aligns the BEES extracted i from F s (denoted as Φs ) to the BEES of the target frame t t F (denoted as Φ ), where i denotes the i-th iteration of the algorithm. Overview: Each iteration (gray zone in Figure 2) consists of two phases. As explained in detail later in this section, the first phase uses the bifurcations, γ, as landmarks and matches them across frames using their descriptors, λ, and locations, g. Inconsistent matches with their neighbour matches are detected and removed automatically. The remaining matched i pairs are used to deform the entire Φs . In the second phase, si the vessel centerline points from Φ are matched against the set of vessel centerline points from Φt , using their orientation similarity and the distance between their locations to find the best matching pairs. Once again, inconsistent matches are automatically detected and removed. The remaining matches i are used to deform Φs . If the maximum displacement produced in the most recent i δ iteration is under 50 , Φs and Φt are considered aligned and the algorithm stops iterating. Since a thin vessel has a diameter δ around 20 pixels, the algorithm stops iterating when the last deformation across the image is smaller than half the width of the smallest vessels visible. If the stopping criterion is not met, the algorithm iterates both phases again applying more localised deformations by decreasing the smoothing parameter i β i . Once the BEES Φs and Φt are aligned, the deformation si applied to Φ is extrapolated to each pixel of F s , generating the DFD D that registers F s with F t , completing the pairwise registration process. The smoothing parameter β i and its decrease at each iteration plays an important role in achieving a correct registration. A large value of β i implies that features across the image have similar weights in influencing the local alignment, while a small β i forces the weights to be high for displacement vectors close to the current point and small for those located far away. As a consequence, the use of a large β i in early i iterations generates a smooth deformation of Φs , as it is subject to the influence of a large regions. In further iterations, when a small β i is used, the deformations occur more locally, i making the deformation of Φs progressively adapt to the local features of Φt . This process implements a coarse-to-fine
IEEE TRANSACTIONS ON MEDICAL IMAGING, AUGUST 2011
5
strategy controlled by a parameter akin to scale or temperature in a simulated annealing process that avoids becoming trapped in local minima at the beginning while allowing local deformations in later iterations, making the algorithm robust to large displacements, incomplete segmentation of the vessels, and the content change characteristic of UWFV FA sequences. The initial value of β i is set to be the width of the images in the data set, warranting that the algorithm is able to correct any large displacement as big as the image width; any arbitrary bigger number could have been used producing the same results but requiring a higher number of iterations. For smaller deformations a smaller number could also be used to reduce the number of iterations. We now describe each module in Figure 2. i 1) Bifurcation matching: In order to match γjs (the j-th i bifurcation from Φs ) with γkt (the k-th bifurcation from Φt ), i their descriptors λsj and λtk are compared using Equation (2). b ∑ i
r(γjs , γkt ) =
n=1
i
m(λsj,n , λtk,n )
(2) b where b is the dimensionality of λ and m() is the function i that compares the n-th elements from descriptors λsj,n and i λtk,n giving an output of 1 if λsj,n ≡ λtk,n and 0 otherwise. i i For every γjs , all possible pairs (λsj , λtk ) are tested and only i the pairs with r(γjs , γkt ) > 0.8 are considered (experiment S1 was repeated with different values and 0.8 provided the best results). A final reliability measure is obtained incorporating the distance between their coordinates using Equation (3): i
β i − ∥g sj − g tk ∥ i ρ(γjs , γkt ) = r(γjs , γkt ) i β i
(3)
Notice that this equation promotes features that are roughly aligned across images. However this effect is very small at initial iterations when β i is large and its effect is noticeable i at later stages, when Φt and Φs are already roughly aligned. i The pair with highest reliability ρ(γjs , γkt ) is considered a i matching pair. The displacement vector g sj −g tk is stored as v l ; i i g sj is stored as ol ; the matched reliability measure ρ(γjs , γkt ) is stored as ρl , where l denotes the l-th matched feature. 2) Purging of inconsistent bifurcation displacement vectors: Due to the similarity in shape between bifurcations across the retina, a few incorrectly matched pairs are expected. In general, displacement vectors change little locally. Therefore, an inconsistency measure µl is computed for each displacement vector v l comparing it to its neighbours using Equation (4): ∥o −o ∥ ∑ − k i l β µl = ∥( Ωk ρk e vk ) − vl ∥
(4)
k̸=l
where Ωk is a normalising parameter enforcing ∥o −o ∥ ∑ − k i l β Ωk ρk e = 1. If µl > kβ i , the displacement k̸=l
vector v l is considered too different from its neighbours and consequently it is removed; after repeating experiment S1 with different possible values, k was set to 13 as it proved to provide the best results.
3) BEES warping using matched bifurcations: The remaining v l and ol , with l = [1..L] and L the number of matches left after purging the displacement vectors, are used to deform i the entire Φs . To do so, each pij = [x, y]T representing the coordinates of the j-th feature (vessel centerline point or i bifurcation) in Φs at iteration i, is moved using Equation (5), to new coordinates qji . q ij = pij +
∑
−
∥pi j −ol ∥ βi
Ωl ρl e
vl
(5)
l
with Ωl a normalising factor as above. The term ρl ensures that features with higher matching reliability have higher weight. −
e
∥pi j −ol ∥ βi
weights higher displacements if they are close. i 4) Vessel matching: After deforming Φs using bifurcation points, the vessel segments are used to refine the registration. i i To match the j-th esj from Φs at iteration i against the k-th etk from Φt , three properties are compared: i) The distance i dj,k between the candidate points esj and etk , obtained with Equation (6); ii) The misalignment between vessels bj,k , obtained with Equation (7), as we only want to consider displacements perpendicular to the vessel; iii) The similarity of orientation aj,k , obtained using Equation (8). i
dj,k = ∥etk − esj ∥ i
(6) i
bj,k = |θjs · (etk − esj )| i
aj,k = |θjs · θkt |
(7) (8)
As some vessel points in one vessel structure might have no correspondence in the other image, only pairs with dj,k < β i i and bj,k < β3 are considered, both thresholds being dependent on the current iteration, as β i is decreased after each iteration (Figure 2). Only vessel points with similar orientation are considered. We use aj,k > 0.95, implying that only vessel points with a difference in orientation under 18.2◦ are considered. In case of multiple candidates, a combined reliability score ρj,c is obtained with Equation (9). ρj,c = aj,c (
βi − bj,c )(β i − dj,c ) 3
(9)
where c ∈ {1, . . . , C} and C is the number of matching i candidates for esj . The pair (j, c) with highest ρj,c is then considered a matching pair. For all the matched pairs (j, k), i the displacement vector from the position of esj to etk is stored i as v l , the position of esj (the origin of v l ) is stored as ol , and the combined reliability score is stored as ρl , where l denotes that it is the l-th paired feature. 5) Purging of inconsistent vessel displacement vectors: Because of the difference in content between frames due to the particular properties of FA sequences, it is likely that there will be a large proportion of wrongly matched pairs. Therefore, each displacement vector v l is compared against the rest of the displacement vectors using Equation (4). As before, if µl > kβ i , with k = 13 , v l is considered an inconsistent
IEEE TRANSACTIONS ON MEDICAL IMAGING, AUGUST 2011
6
displacement vector and removed from the list of displacement vectors. 6) BEES warping using matched vessels: The remaining v l and ol , where l = [1..L] and L is the number of matches left i after purging, are used to warp the entire Φs . To do so, each coordinate point qji obtained in step 3) is now displaced again using Equation (10), pi+1 = q ij + j
∑
−
Ωl ρl e
∥q i j −ol ∥ βi
vl
(10)
l
where Ωl is a normalising factor as above. 7) Localising the matching region and new iteration: After i warping Φs into new iteration i+1, the value of β i is reduced to perform a more localised search in the next iteration. To do so, the new value of β i+1 is set to the largest ∥v l ∥ found in step 5. If the largest ∥v l ∥ (the biggest deformation applied) is smaller than a certain threshold (we use a value of 4 pixels) i we consider both BEES Φs and Φt aligned and the algorithm stops iterating and a DFD is computed. 8) Generation of dense field of displacements: Once the i warped Φs is obtained, the displacement of each individual i element in Φs is used to compute the DFD, D. If pij is the i location of the j-th feature in Φs , the vector tj = pij − p0j is obtained comparing the initial location before iterating and the final position after i iterations. That typically generates tens of thousands of displacement vectors that have to be extrapolated to the rest of the image. To do so, for each pixel uk = [xk , yk ]T from the source image a weighted combination of all t is computed using Equation (11): v(uk ) =
∑
Ωj ρj e−
∥uk −p0 j∥ β
tj
(11)
j
where v(uk ) is the displacement computed for each pixel uk , k = [1..N ] and j = [1..M ], and N is the number of pixels in the image and M is the number of elements in Φs . The parameter β that controls the smoothing on the resulting DFD has been set as β = δ/10 after empirical tests described in Section V-A1. The new position wk of any image point can be now computed using wk = uk + v(uk ). The DFD is the composition of all v(uk ). E. FA Sequence Registration To register an entire sequence of UWFV FA images, the algorithm automatically selects one frame to act as the anchor frame. All other frames are aligned independently against the anchor frame BEES (Φt ) using RERBEE. This methodology avoids the accumulation of errors typical in sequential registration. To maximise the likelihood of finding matches between the anchor and the other frames, the frame with the largest number of vessel segments is chosen as the anchor frame. IV. I MPLEMENTATION The algorithm was implemented in MATLAB, with the exception of the generation of the DFD, which was implemented using CUDA to exploit the computational power
of NVIDIA graphic cards. To generate the DFD described in III-D8, a displacement vector v(u) has to be computed using Equation (11) for each pixel u. In our experiments, the number of displacement vectors obtained is usually over 104 , implying that for each pixel, over 104 displacement vectors have to be weighted, normalised and combined to generate the displacement v(u) for a single pixel. These operations have to be done for each pixel in a 3900 × 3092 pixel image. The total number of operations is over 1011 . As the evaluation at each pixel can be independent of evaluation at other pixels, this part of the code is suitable for implementation in massive parallel architectures as the present GPUs. GPU code has been integrated on the MATLAB implementation using MATLAB MEX API. The displacement vectors, v(uk ), are computed calling a GPU kernel function. To minimise global memory traffic, displacement vectors, t, and their origins, p0j , are uploaded to shared memory. Then each thread running in the multi-core GPU computes a displacement vector v(uk ) for a pixel uk . As shared memory is very limited, vectors containing the t and p0j are split into different iterations to try to maximise the multiprocessors’ occupancy. At each iteration a portion of those vectors are loaded into shared memory and used for all the threads within a block to compute an accumulating displacement map. When using double precision (64-bits), values are split and stored as two separate integer values in order to avoid bank conflicts. We ran different tests to evaluate the performance using different architectures and precisions (32- and 64-bits). We used an Intel Core 2 Quad Q8300 at 2.5Ghz with 6GB of RAM. The GPUs tested were NVIDIA Geforce GTX480 (1536 GB of memory, 30 multiprocessors, from 2010), GTX260 (896 GB of memory, 27 multiprocessors, from 2009) and 8600 GTS (256 GB of memory, 4 multiprocessors, from 2007) with CUDA toolkit 3.2 and drivers v263.06. To evaluate the advantages of using GPU platforms to compute the DFD we used a registered BEES containing 38,775 displacement vectors, t, for the 11,980,800 pixels, u, of the image. It required a total of 464.6 billion calls to the operations in the summation on Equation (11) to obtain the DFD. Two implementations of the function were made: C code for CPU without SIMD optimisations or multicore programming; and the CUDA C code for GPU. All versions used look-up tables to avoid computing the expensive exponential. All tests were performed using single precision (32-bits) and double precision (64-bits) operations, with the exception of the 8600 GTS as it does not support 64-bits operations. As can be seen in Table I, the single-thread C implementation using CPU takes between 5 and 7 hours, while the same computation on the GPU only requires between 19 and 188 seconds, depending on the GPU family and floating point precision. Table I shows speedups up to x1339 and x427 when comparing GPU (GTX 480) and CPU implementations for single and double precision respectively. It is interesting to note that a mid-range 2007 graphics processor (8600 GTS) can deliver up to ×135 improvement factor for the computationally expensive method. Note that the CPU performed better when
IEEE TRANSACTIONS ON MEDICAL IMAGING, AUGUST 2011
7
working with 64-bits because it is optimised for this precision. TABLE I DFD
COMPUTATION TIME FOR DIFFERENT ARCHITECTURES
Architecture GTX480 (32-bits) GTX260 (32-bits) 8600GTS (32-bits) CPU (32-bits) GTX480 (64-bits) GTX260 (64-bits) CPU (64-bits)
Time (s) 19.03 27.97 188.02 25503.30 48.07 131.61 20560.09
Speedup ×1339.88 ×911.68 ×135.64 ×1.00 ×427.74 ×156.22 ×1.00
Preliminary experiments using a subset of the closest displacement vectors showed that the performance was increased by not more than 7% at the same time introducing a new problem, namely the appearance of discontinuities on the DFD caused by distance thresholding. The small gain in performance is a consequence of adding flow control instructions that compromise GPU efficiency [10]. V. E XPERIMENTS We ran RERBEE using synthetic data in order to quantify errors under different conditions. We then tested RERBEE on 19 real UWFV sequences, giving a qualitative measure of performance. A. Synthetic Synthetic images and deformations were created so as to have ground truth data. We compared RERBEE against a stateof-the-art intensity-based registration algorithm presented by Glocker et al. [15] using software that those authors provided. We used normalised mutual information (NMI) as the data cost and the rest of parameters were chosen empirically by repeating experiment S1. We also tested Glocker et al. using as an input the binary mask containing extracted vasculature obtained in Section III-B instead of the original gray-scale frames. This was done in order to evaluate the algorithm performance when using the same input as RERBEE and without using textural information. This method is referred as Glocker (segm). We also compared RERBEE against the Generalized Dual Bootstrap-ICP algorithm [21] (henceforward GDBICP) using the software provided by the authors. This algorithm is a feature-based method able to compute a global transformation between pairs of small FOV retinal fundus images. We used the quadratic transformation as suggested by the authors. Patton et al. [33] state that the mean optic disc diameter is 1850 µm. The mean diameter of the optic disc in our data set is 200 pixels. Therefore a pixel is approximately 9.25 µm, allowing us to express errors in µm. The width of a thin vessel is around 10 pixels (≃ 92.5 µm) and the width of a thick vessel is around 30 pixels (≃ 277.5 µm). 1) S1: Deformed frame with no content change: A test DFD was obtained by registering the 14th and 13th frame of the 07-GOM sequence (Figure 4). The 3rd frame from the 01-AMD sequence was then deformed by applying this test DFD; the original frame was used as source and the deformed frame as target. The exact error was obtained by comparing
(a)
(b)
Fig. 4. Dense field of displacement (DFD) computed between frames 14 and 13 in the sequence 07-GOM used for the synthetic experiments. (a) Horizontal component of the displacement field. (b) Vertical component of the displacement field. (Best viewed on electronic version)
the deformation applied and the displacement vector computed for each pixel with the RERBEE method. For each pixel uk the error e(uk ) was computed using Equation (12), e(uk ) = ∥v(uk ) − D(uk )∥
(12)
where v(uk ) is the displacement computed for pixel uk with RERBEE and D(uk ) is the displacement artificially applied to the original pixel. The initial mean error before registration, was computed to be 73.3 pixels (678.0 µm). RERBEE achieved a mean error of 6.9 pixels (63.8 µm), Figure 5. Glocker et al. achieved 3.2 pixels (29.6 µm) and GDBICP achieved 40.0 pixels (370.0 µm) (see Table II). GDBICP has a much larger error because it is not able to capture the complex non-rigid deformations present in UWFV FA sequences.
(a)
(b)
Fig. 5. Experiment S1: (a) Detail of source and target frame before registration. (b) Detail after registration using RERBEE. The target frame has been darkened to show the checkerboard pattern. (Best viewed on electronic version)
The intensity-based method of Glocker et al. is more accurate as both images are identical in content both in the retina and in the visible skin and eyelashes around it. This is the best result we achieved with Glocker’s algorithm over a range of parameter configurations. Therefore we kept these parameters in our further experiments. We repeated this experiment with different β values for Equation (11) and we empirically set it to δ/10 as the value that minimises the error computed with Equation (12). 2) S2: Deformed frame with content change: To simulate the change of content between frames in a FA sequence, we
IEEE TRANSACTIONS ON MEDICAL IMAGING, AUGUST 2011
averaged the third frame of the 01-AMD sequence with the 10th from the 02-GER sequence. This combined image was then deformed using the same test DFD as in experiment S1. The original third frame from the 01-AMD sequence was then registered using the combined image as a target (Figure 6). In Table II it can be seen that despite the huge change of content (only half of the vessels in the original frame have a correspondence with the target frame), the RERBEE registration mean error was 10.0 pixels (92.5 µm). Glocker showed a mean error of 14.0 pixels, Glocker (segm) 18.9 pixels and GDBICP achieved 39.9 pixels.
8
S3 with the null hypothesis that Glocker had a smaller error. If the 3900 × 3072 values were used, the p-value was 0. Using a random sub-sample of 100 values from each DFD we obtained a p-value of 0.0016 for S2 and 0.0009 for S3, showing that the difference in RERBEE favour was statistically significant.
(b)
(a)
Fig. 7. Experiment S3. (a) Target frame, showing the artificial occlusion added to the third frame of the 01-AMD sequence. (b) Final alignment after registration. Notice that the checkerboard can not be appreciated on the unoccluded area due to accurate registration. (Best viewed on electronic version) (b)
(a)
TABLE II E RRORS IN PIXELS ( AND µM ) FOR THE SYNTHETIC
Before registration RERBEE Glocker Glocker (segm) GDBICP RERBEE Glocker Glocker (segm) GDBICP RERBEE Glocker Glocker (segm) GDBICP
S1 S1 S1 S1 S2 S2 S2 S2 S3 S3 S3 S3
Mean 73.3 (678.0 µm) 6.9 (63.8 µm) 3.2 (29.6 µm) 3.2 (29.6 µm) 40.0 (370.0 µm) 10.0 (92.5 µm) 14.0 (129.5 µm) 18.9 (174.8 µm) 39.9 (369.1 µm) 13.2 (122.1 µm) 18.2 (168.3 µm) 15.5 (143.4 µm) Error
DATA
Std. Dev. 15.5 (143.1 µm) 6.9 (63.8 µm) 6.0 (55.5 µm) 6.0 (55.5 µm) 26.4 (244.2 µm) 10.8 (99.9 µm) 16.0 (148.0 µm) 13.7 (126.7 µm) 26.0 (240.5 µm) 9.2 (85.1 µm) 11.6 (107.3 µm) 11.0 (101.7µm) Error
(c) Fig. 6. Experiment S2. (a) Central part of the synthetic frame, showing both optic discs. (b) Detail of the final alignment after registration. (c) Registration error for with the vessel segmentation from the target frame overlapped. Notice how the majority of the error is at the periphery, where no retina is present. (Best viewed on electronic version)
3) S3: Deformed frame with occlusions: An artificial eyelid occlusion was added to the third frame of the 01-AMD sequence (Figure 7a), to imitate the one present in 2nd frame of the 08-MAR sequence (Figure 10a). This synthetic frame was then deformed using the same DFD used in experiments S1 and S2. The original frame was then registered using the modified frame as a target (Figure 7b). In this case RERBEE outperformed the intensity-based registration, with mean error of 13.2 pixels, showing robustness to severe eyelid and eyelash occlusions (see Table II). Glocker showed a mean error of 18.2 pixels, Glocker (segm) 15.5 pixels and GDBICP execution ended with an error message saying that the method was not able to find any registration. We have also computed the p-value for the matched-pairs t-test between RERBEE and Glocker on experiments S2 and
B. Real FA Data To evaluate the algorithm with real data, we registered 19 UWFV FA sequences from healthy (2) and unhealthy (17) patients showing central retina vein occlusion (CRVO), retinal vascular non-perfusion, retinal ischemia and presence of microaneurysms. The data set contains a total of 296 frames. One frame was used as an anchor for each sequence. Therefore, 277 image pairs were registered. The images were acquired with an OPTOS P200C, courtesy of OPTOS plc. (UK) and the Jules Stein Eye Institute (USA). They are 3900 × 3072 pixels showing a FOV that spans up to 200◦ . Each sequence contains between 8 and 27 frames at irregular time intervals. Some of these sequences are explicitly mentioned in this paper: 01-AMD has 14 frames and shows age-related macular degeneration; 02-GER is a 23-frame sequence from a healthy patient; 03-BP is a 19-frame sequence from a healthy patient; 05-CRVO is a 15-frame sequence with CRVO; 07-GOM has 25 frames and shows non-proliferative diabetic retinopathy
IEEE TRANSACTIONS ON MEDICAL IMAGING, AUGUST 2011
9
(NPDR); 08-MAR is a 20-frames sequence showing proliferative diabetic retinopathy; 09-GIL has 9 frames showing NPDR; 11-SMI is a 27-frame sequence showing mild NPDR. A clinician marked each registered image as: (1) Correctly registered, (2) Correctly registered with minor errors but usable for clinical purposes, (3) Misalignments that cause difficulties for clinical use. (4) Wrong registration. Of the 277 registered images, 267 (96.4%) were in category 1, 10 (3.6%) were in category 2 and none in category 3 or 4. Examples of registered images can be seen in Figure 8 and Figure 9. (a)
(a)
(b) Fig. 9. (a) Registration result between frames 5 and 7 of sequence 09-GIL. Notice the severe occlusions (bright regions on the top and top-right, and bottom third part of the image). (b) Detail of the content in the red rectangle. (Best viewed on electronic version)
with the synthetic data is due to the fact that we measure the error registration close to the vasculature instead of everywhere in the image. (b)
C. Computational time Fig. 8. (a) Detail of the registration of frame 2 (arterial phase) with frame 6 (arteriovenous phase) of sequence 02-GER. Notice how arteries look similar but veins suffer a strong change of aspect. (b) Detail of the registration of frame 3 (arteriovenous phase) with frame 12 (recirculation phase) in sequence 05-CRVO. (Best viewed on electronic version)
TABLE III N UMBER OF REGISTERED IMAGE PAIRS IN EACH Cat. 1 267
Cat. 2 10
Cat. 3 0
CATEGORY
Cat. 4 0
In order to provide quantitative results on real data, a salient feature (artery, vein or lesion point) was selected for each frame and its location manually annotated before and after registration. The distance between the features for each frame and its location on the anchor frame was obtained. A total of 550 measures were obtained across the 19 sequences, 275 before and 275 after registration, covering all but 2 frames from the 05-CRVO sequence where no correspondences were found due to a severe CRVO pathology. The mean distance before registration was 77.41 pixels, the median 57.33 and the standard deviation 29.55 pixels. After registration, the mean distance was 1.94 pixels, the median 1.33 and the standard deviation 2.26 pixels. The smaller error on real data compared
The total time required to perform the registration of two frames is between 5 and 10 minutes on an Intel Core 2 Quad Q8300 at 2.5Ghz with 6GB of RAM, depending on the complexity of the vascular structure present in each image. The reported time includes the vessel segmentation and BEES creation for both frames, all tree deformation iterations, and the DFD computation performed by the GPU. For experiment S1, the vessel segmentation required 17.4s and 14.6s and the BEES creation 62.6s and 98.0s for the source and anchor frame respectively. The 6 iterations computed to align both BEES took 44.2s, 40.0s, 38.8s, 38.7s, 46.6s and 48.2s. Finally, the computation of the DFD using the GPU required 32.4s using the GTX260 card. The total time was 495.6s, very similar to the 493.4s required for the Glocker et al. method. The Generalized Dual Bootstrap algorithm used 78.2s. D. Sequence summarisation Registration is a crucial operation to enable analysis and summarisation of FA sequences. We present some preliminary results using techniques aimed at automatic analysis and summarisation. In order to keep the algorithm completely automatic all frames are used and no frames presenting small or large occlusions are excluded.
IEEE TRANSACTIONS ON MEDICAL IMAGING, AUGUST 2011
(a)
(b)
(c)
(d)
10
frame, especially in the periphery. Vein/Artery classification: The intensity evolution over time at each registered pixel provides valuable information about the tissue in that region. To illustrate this concept we have plotted the intensity evolution of an artery (in red), a vein (in blue), and a background point (in green) in Figure 10e. It can be seen that the different tissues have a different intensity evolution: Arteries have a peak in intensity before veins and veins are brighter than arteries after the initial peak. A conventional classifier can be used to exploit these differences in order to automatically distinguish between arteries, veins and background [34]. Lesion detection: Some common lesions can be identified similarly. Figure 10e shows how a pixel in a leakage region has a similar intensity level to the background in early frames and resembles an artery in later frames, making it difficult to detect by techniques that rely on independent frames. In contrast, the use of the temporal intensity profile of a registered sequence enables automatic detection of pathologies [34], [35]. Notice how the intensity profile from the non-registered sequence is not consistent with the profiles showed for the different tissues of the registered sequence. VI. D ISCUSSION AND C ONCLUSIONS
(e) Fig. 10. (a) Second frame of sequence 08-MAR showing a severe occlusion. (b) Summary image of 08-MAR in which the full vascular tree and Proliferative Diabetic Retinopathy (PDR) signs are visible despite severe occlusions in some frames of the sequence. (c) Vessel segmentation for the summarisation frame of sequence 03-BP. (d) Global vessel segmentation of sequence 03-BP. (e) Intensity profiles for an artery, a vein, a background and a leakage region point in sequence 11-SMI, profile for an artery point of the sequence 11-SMI before registration. (Best viewed on electronic version)
Summarisation frame generation: Registered frames are superimposed and the pixelwise mean-intensity image built. In Figure 10b the 08-MAR sequence, containing large occlusions (Figure 10a), was summarised in this way, showing the full vascular tree alongside different pathologies with the occlusions removed. Global vessel segmentation: A registered sequence can be used to extract some features present in the retina reliably, even if their appearance changes over time. As an example, we extracted the vasculature by combining all the independent vessel segmentations obtained√in III-B. If a registered pixel is classified as vessel in at least a frames, where a is the number of frames in the sequence, then it is considered a vessel. In Figure 10d, a global vessel segmentation for sequence 03BP is shown compared with the vascular segmentation of the summarisation frame (Figure 10c). Global vessel segmentation was able to detect some vessels missed in the summarisation
We have presented RERBEE, an algorithm for registering frames of a UWFV FA sequence able to cope with the challenges posed by UWFV FA sequences (change of content, occlusions, pathologies, local deformations). In Experiment S1, Glocker et al. outperformed our algorithm (Section II) because the source and target frames were identical in content. The intensity-based method can use the entire frame (including eyelashes) to accurately register the pair, while RERBEE relies only on the extracted vasculature. When we simulate real FA data, introducing content change (Experiment S2) and severe occlusions (Experiment S3), RERBEE achieved more accurate registration thanks to its ability to deal with poor segmentation and purge wrong feature matchings. We also tested Glocker et al. using the binary mask containing extracted vasculature as input. When we tested the GDBICP, it showed that it was not suitable for registering UWFV FA sequences, as its quadratic transformation was not able to cope with the numerous local deformations present in the images. It is important to note that the central part of the images (where retina and its features are visible) has a smaller error than the periphery, where no retina is visible, as can be seen in Figure 6c. This is because peripheral regions are mainly dark and textureless, or contain eyelashes and facial skin with movement not related to the retina. The presence of errors in those areas is acceptable for clinical purposes as only the retinal region contains information for diagnosis and treatment. Although subjective, the categorisation done by a clinical ophthalmology expert shows that the algorithm is suitable for clinical purposes. From a total of 277 images registered, 267 (96.39%) images are considered to be correctly registered and 10 are considered correctly registered with minor errors
IEEE TRANSACTIONS ON MEDICAL IMAGING, AUGUST 2011
but usable for clinical purposes. The quantitative evaluation provided using real data (measuring the distance between control points) confirms that the registration is very accurate. We also demonstrated that the use of GPUs can reduce the computational time required for medical image registration by three orders of magnitude. Computing the DFD using the GPU took less than a minute compared to 5-7 hours using the CPU. Other warping functions like Thin Plate Spline (TPS) could have been used to generate the DFD. However, the usage of TPS would force us to artificially reduce the number of control points extracted from the BEES matching. This is because TPS needs to compute the inverse of a matrix with a size proportional to the number of control points used; storing such a matrix in 64-bits precision with the 38, 775 control points we used to test the GPU would require 11.2 GB of memory, plus another 11.2 GB for the resulting matrix. Unlike classic TPS implementations, our method produces a DFD that approximates (as opposed to interpolate) a discrete set of displacement vectors. As coded in Eq. (11), each displacement value computed will depend on surrounding displacement vectors. The larger β in Eq. (11), the higher the weight of each contributing displacement (in practice, the larger the effective smoothing neighbourhood). Our current work uses RERBEE for various applications that require an accurate UWFV FA registration: sequence summarisation, global vessel detection, automatic classification of vessels, and automatic lesion detection. R EFERENCES [1] A. Perez-Rovira, E. Trucco, P. Wilson, and J. Liu. Deformable registration of retinal fluorescein angiogram sequences using vasculature structures. In Engineering in Medicine and Biology Society, pages 4383– 4386, 2010. [2] A. Manivannan, J. Plskova, A. Farrow, S. Mckay, P. F. Sharp, and J. V. Forrester. Ultra-wide-field fluorescein angiography of the ocular fundus. American Journal of Ophthalmology, 140(3):525–527, 2005. [3] M F. Chiang et al. Telemedical retinopathy of prematurity diagnosis: accuracy, reliability, and image quality. Archives of Ophthalmology, 125(11):1531–1538, 2007. [4] K. E. Scott et al. Telemedical diagnosis of retinopathy of prematurity intraphysician agreement between ophthalmoscopic examination and image-based interpretation. Ophthalmology, 115(7):1222–1228, 2008. [5] Friberg T.R., Gupta A., Yu J., Huang L., Suner I., Puliafito C.A., and Schwartz S.D. Ultrawide angle fluorescein angiographic imaging: a comparison to conventional digital acquisition systems. Ophthalmic Surgery, Lasers & Imaging, 39(4):304–311, 2008. [6] S. Reddy, A. Hu, and S. D. Schwartz. Ultra wide field fluorescein angiography guided targeted retinal photocoagulation (TRP). Seminars in Ophthalmology, 24(1):9–14, 2009. [7] A. Kaines, I. Tsui, D. Sarraf, and S. Schwartz. The use of ultra wide field fluorescein angiography in evaluation and management of uveitis. Seminars in Ophthalmology, 24(1):19–24, 2009. [8] I. Tsui, A. Kaines, M.A. Havunjian, S. Hubschman, G. Heilweil, P.S. Prasad, S.C.N Oliver, F. Yu, E. Bitrian, J.P. Hubschman, T. Friberg, and S.D. Schwartz. Ischemic index and neovascularization in central retinal vein occlusion. Retina, 31:105–110, 2011. [9] P. S. Prasad, S. C. N. Oliver, R. E. Coffee, J-P. Hubschman, and S. D. Schwartz. Ultra wide-field angiographic characteristics of branch retinal and hemicentral retinal vein occlusion. Ophthalmology, 117(4):780–784, 2010. [10] D. B. Kirk and W. mei W. Hwu. Programming Massively Parallel Processors: A Hands On Approach. Morgan Kaufmann, 2010. [11] D. Hill, P. Batchelor, M. Holden, and D. Hawkes. Medical image registration. Physics in Medicine and Biology, 46(3):R1, 2001. [12] J. P.W Pluim, J. B.A Maintz, and M. A Viergever. Mutual-informationbased registration of medical images: a survey. IEEE transactions on medical imaging, 22(8):986–1004, 2003.
11
[13] D. Rueckert and P. Aljabar. Nonrigid registration of medical images: Theory, methods, and applications. Signal Processing Magazine, 27(4):113–119, 2010. [14] D. Rueckert, L. I. Sonoda, C. Hayes, D. L. G. Hill, M. O. Leach, and D. J. Hawkes. Nonrigid registration using free-form deformations: application tobreast MR images. IEEE Transactions on Medical Imaging, 18(8):712–721, 1999. [15] B. Glocker, N. Komodakis, N. Paragios, G. Tziritas, and N. Navab. Inter and intra-modal deformable registration: Continuous deformations meet efficient optimal linear programming. In Information Processing in Medical Imaging, page 408, 2007. [16] A. Myronenko and X. Song. Image registration by minimization of residual complexity. In Computer Vision and Pattern Recognition, pages 49–56, 2009. [17] J. C. Nunes, Y. Bouaoune, E. Delechelle, and P. Bunel. A multiscale elastic registration scheme for retinal angiograms. Computer Vision and Image Understanding, 95(2):129–149, 2004. [18] J. Dreo, J. C Nunes, and P. Siarry. Robust rigid registration of retinal angiograms through optimization. Computerized Medical Imaging and Graphics, 30(8):453–463, 2006. [19] B. Fang and Y. Tang. Elastic registration for retinal images based on reconstructed vascular trees. IEEE Transactions on Bio-Medical Engineering, 53(6):1183–1187, 2006. [20] L. Kubecka, J. Jan, R. Kolar, and R. Jirik. Elastic registration for autofluorescence image averaging. In Engineering in Medicine and Biology, pages 1948–1951, New York, USA, 2006. [21] C. Stewart, C. Tsai, and B. Roysam. The dual-bootstrap iterative closest point algorithm with application to retinal image registration. Transactions on Medical Imaging, 22(11):1379–1394, 2003. [22] F. Laliberte, L. Gagnon, and Y. Sheng. Registration and fusion of retinal images - an evaluation study. Transactions on Medical Imaging, 22(5):661–673, 2003. [23] T. E Choe and I. Cohen. Registration of multimodal fluorescein images sequence of the retina. In Tenth IEEE International Conference on Computer Vision, 2005. ICCV 2005, volume 1, 2005. [24] P. A. Asvestas, G. K. Matsopoulos, K. K. Delibasis, and N. A. Mouravliansky. Registration of retinal angiograms using self organizing maps. In Engineering in Medicine and Biology Society, pages 4722– 4725, 2006. [25] C. Tsai, C. Li, G. Yang, and K. Lin. The Edge-Driven Dual-Bootstrap iterative closest point algorithm for registration of multimodal fluorescein angiogram sequence. IEEE Transactions on Medical Imaging, 29(3):636–649, 2010. [26] J. Chen, J. Tian, N. Lee, J. Zheng, R. T. Smith, and A. F. Laine. A partial intensity invariant feature descriptor for multimodal retinal image registration. Transactions on Biomedical Engineering, 57(7):1707–1718, 2010. [27] T. Chanwimaluang, G. Fan, and S. R. Fransen. Hybrid retinal image registration. Transactions on Information Technology in Biomedicine, 10(1):129–142, 2006. [28] J. Lowell, A. Hunter, D. Steel, A. Basu, R. Ryder, E. Fletcher, and L. Kennedy. Optic nerve head segmentation. IEEE Transactions on Medical Imaging, 23(2):256–264, 2004. [29] J. Xu, O. Chutatape, and P. Chew. Automated optic disk boundary detection by modified active contour model. IEEE Transactions on Biomedical Engineering, 54(3):473–482, 2007. [30] A. Perez-Rovira, K. Zutis, J.P. Hubschman, and E. Trucco. Improving vessel segmentation in ultra-wide field-of-view retinal fluorescein angiograms. In 33th Engineering in Medicine and Biology Conference, EMBC., page TBA, 2011. [31] Z. Guo and R.W. Hall. Parallel thinning with two-subiteration algorithms. Communications of the ACM, 32:359–373, 1989. [32] C. Di Ruberto. Recognition of shapes by attributed skeletal graphs. Pattern Recognition, 37(1):21–31, 2004. [33] N. Patton, T. M. Aslam, T. MacGillivray, I. J. Deary, B. Dhillon, R. H. Eikelboom, K. Yogesan, and I. J. Constable. Retinal image analysis: concepts, applications and potential. Progress in retinal and eye research, 25(1):99–127, 2006. [34] C. R Buchanan and E. Trucco. Contextual detection of diabetic pathology in wide-field retinal angiograms. In Engineering in Medicine and Biology Conference, 2008., pages 5437–5440, 2008. [35] E. Trucco, C.R. Buchanan, T. Aslam, and B. Dhillon. Contextual detection of ischemic regions in ultra-wide-field-of-view retinal fluorescein angiograms. In Engineering in Medicine and Biology Society, pages 6739–6742, 2007.