ITM Web of Conferences 17, 03001 (2018) https://doi.org/10.1051/itmconf/20181703001 WCSN 2017
Research and application of heat map system for resource allocation of flood control based on GIS Weijian Li1, Long Xie1, Yong Lei1, Yu Guo1, Xiaoqing Zhou1 1 The Pearl River Hydraulic Reserch Institute, Room 2305, Tianshou Building, Tianshou Road, Tianhe District, Guangzhou City, China
[email protected]
Abstract. Flood control resources are valuable resources for flood control and rescue, providing the flood relief work with the most direct rescue workers, tools as well as equipment. With the continuous development of society and economy, local governments at all levels, especially those of which are seriously affected by flood and waterlogging, have raised higher requirements for the allocation of flood control resources. When disasters such as flood and waterlogging happen, a reasonable allocation of flood control resources can quickly deploy relevant flood control resources for the disaster relief work and play an important role in reducing damage to personnel and property loss to a minimum, which stabilizes and promotes the socioeconomic development. Research of resource allocation of flood control based on GIS (Geographic Information System) is gradually becoming an important technical support for scientific resource allocation. This research focuses on the introduction of the characteristics and advantages of the heat map system based on GIS and its application in resource allocation of flood control. The important role the heat map system based on GIS plays in allocation and management of flood control resources is introduced in the applying case of Guangzhou.
1
Introduction
In the history of mankind, floods occur almost every year, causing countless losses of human, material and financial resources. Traditionally, flood is deemed to be an unavoidable natural disaster to human beings; however, with the progress of science and technology of modern society, people begin to gradually understand flood, using modern means to monitor the occurrence process of the disaster and giving guidance to relevant units to carry out disaster prevention and relief work in a timely manner. The losses of personnel and property can therefore be reduced to a maximum. Valuable to flood control and disaster relief, flood control resources are also resources provided by local governments at all levels on demand according to time and space characteristics of flood, waterlogging and other disasters. In recent years, with the continuous socioeconomic development, urban flood control projects cannot gradually meet
© The Authors, published by EDP Sciences. This is an open access article distributed under the terms of the Creative Commons Attribution License 4.0 (http://creativecommons.org/licenses/by/4.0/).
ITM Web of Conferences 17, 03001 (2018) https://doi.org/10.1051/itmconf/20181703001 WCSN 2017
the requirements for flood control tasks in the new situation while problems such as hardening of cities’ underlying surfaces become increasingly serious, bring more frequent floods and waterlogging. Before a disaster happens, it’s management problem for social governors in terms of how to rationally deploy flood control resources in order to quickly organize professional rescue personnel as well as materials for relief work after a disaster. In this paper, an urban storm water model is established by collecting materials including the relevant rainfall data, urban waterlogging point data and urban river data of the research area; combined with the current spatial distribution characteristic of flood control resources, GIS heat mapping technology is introduced to realize the visualization of flood disaster data and to make scientific suggestions for distribution and disposition of the planned flood control resources. This research takes Guangzhou, China as an example to study the disposition of flood control resources in the jurisdiction of Guangzhou. Located in the south of China Pearl River estuary, Guangzhou is in the subtropical monsoon climate zone with the average annual rainfall being over 1600mm. The Pearl River Delta region where Guangzhou is located is covered with a dense drainage network and the rainfall is abundant, which easily leads to flood, waterblogging, etc. All of these bring make it difficult for the government administrative departments to manage flood control and the relief work. 1.1
A brief introduction of heat map technique based on GIS
GIS, Geographic Information System, is a specific and important spatial information system. Supported by computer hardware and software systems, GIS is a technical system which collects, stores, manages, calculates, analyzes, displays and describes the relevant geographical distribution data for the whole or part of space of the surface of the earth (including the atmosphere). GIS is not only a “tool” that expresses and simulates the realistic spatial world and performs spatial data processing as well as analysis, but also it can be deemed as “resources” dealing spatial problems. Heat map technique based on GIS means to construct a heat map system with spatial information attributes. It is the research achievement formed by the combination of GIS technology and heat mapping technology, being able to provide drawing technique which shows two- and three-dimensional space and is divided according to ranks. Combining spatial distribution of the current flood control, this paper collects and researches data such as those of rainstorm runoff, storm tide and disaster points for waterlogging of Guangzhou city. Therefore, it generates a dynamic configuration map based on spatial information data including flood control rescue teams, flood control materials and flood control equipment to achieve a dynamic update of resources of flood control and an optimized configuration. 1.2
Characteristics of heat map based on GIS
Heat map technique based on GIS is a new technology integrating geographical information collection technology, remote sensing technology, computer graphics technology, software engineering technology and real-time data rendering technology. Its fundamental principles are as follows: to achieve a scientific storage and management of the basic information data of the research content through data collation and processing and to set up a data recording with geographical location information; to dynamically generate a heat map data layer through the position attributes and the hierarchical attributes of the data layer, which are put onto the GIS geographical data layer to form GIS heat map data including position information such as the map layer and the heat map layer. The main characteristics of GIS heat map technique are as follows:
2
ITM Web of Conferences 17, 03001 (2018) https://doi.org/10.1051/itmconf/20181703001 WCSN 2017
First, there are visual effects of a distinct level. The heat map layer generated by information data is actually a data hierarchy map generated in the research scope area. The division of the hierarchy is showed by the changes of color shapes, which leads to an obvious change among different hierarchies to achieve a distinct display of the hierarchical division. Second, there is real spatial location information. The traditional heat map display is based on non-spatial information images generated by graphic images, which is unfavorable to spatial overlay analysis and topology analysis in engineering. Heat map technique based on GIS is based on the spatial geographical coordinates, generating a layer with coordinate position information through attributes of the built-in hierarchical division of the data. This layer can be easily superimposed onto data with any geographical coordinate information to achieve a superimposing analysis for multi-source data and to provide great help to engineering research. Third, there are characteristics of a dynamic generation. Heat map data is a data layer dynamically generated according to some scattered data in the research scope. There is a real-time dynamic update of the layer data according to the hierarchical attributes of the scattered data. 1.3
Problems of resource allocation of flood control
Flood control resources are related to a series of problems of safety issues of flood control, ecological environment protection, social sustainable development and so on. With China’s rapid socioeconomic development, urban flood control projects seem to be particularly vulnerable in the construction of various projects, being unable to meet the requirements for flood control in the new situation; problems such as the increasingly expanding built-up areas, congestion of drainage network, hardening of cities’ underlying surfaces, etc. are becoming more and more serious, which will cause disasters such as flood and waterlogging. At present, most of China’s resources of flood control in different areas are in a stage of labour management. The lack of a scientific and rational planning and management of resources including flood control rescue teams and emergency supplies usually leads to a situation where the relevant rescue teams and materials cannot arrive on the scene when a disaster happens. Based on the above information, it is necessary for management departments of three proofings at all levels to have a more comprehensive, more correct and more scientific management of resources of flood control in order to improve the efficiency and the standard of rescue and relief work of three proofings. The heat map system of resource allocation of flood control based on GIS which provides guidelines for the routine management work of management departments of three proofings is raised therefrom.
2 The application of heat map system based on GIS in resource allocation of flood control The application of GIS heat map system in resource allocation of flood control refers a dynamic generation of a heat map layer according to the disaster class of the disaster type after having an in-depth research of flood types such as storm tide, waterlogging points, etc. in the research area by using spatial information technology and dividing the classes of all types of disasters. This heat map layer reflects the demand for resources of flood control in disaster points and the surrounding areas. According to the demand for resources of flood control , the system will evaluate whether the position for each flood control resource point, staffing and deployment of rescue materials are reasonable or not.
3
ITM Web of Conferences 17, 03001 (2018) https://doi.org/10.1051/itmconf/20181703001 WCSN 2017
2.1
Mechanism research of rainstorm runoff
According to the historical data of vegetation, soil and intensity, distribution as well as time taken of rainstorm of Guangzhou, this paper researches the mechanism of rainstorm runoff in some feature areas such as business zones, old towns, residential areas with low density, mountainous and hilly regions and plain areas with drainage network after combining factors such as buildings of urbanization and the changing of underlying surfaces. Based on the above data, a research on the distribution of an urban disaster is conducted with a single factor being the rainstorm. As the basis of a superimposing working condition, this rainstorm runoff mechanism dynamically generates a disaster heat map under the influence of the rainstorm factor. 2.2
Research on flood and storm tide superimposed on rainstorm
Factors such as the relevant signals including blue, yellow, orange and red rainstorm warning signals issued by Meteorological Observatory and the region areas of the rainstorm warnings are used as a division of rainstorm’s orders of magnitude. By using the rainstorm runoff mechanism of orders of magnitude and superimposing floods and storm tides in different frequencies, this paper analyzes the sphere and the degree of influence of rainstorm waterlogging, floods and storm tides under different stimulated working conditions and constructs the distribution of an urban disaster under the condition that flood and storm tide superimposed on rainstorm. 2.3
A superimposition of other relevant flood’s types of factors
Guangzhou is located in Pearl River estuary in South China. Meanwhile, Nansha District and Panyu District which are all located in the southern area of Guangzhou are typical plain areas because they are covered with a dense drainage network. River dykes play an important role in resisting flood and storm tide. However, when there is a catastrophic flood, situations such as dyke-breaching and dyke-overflowing happen frequently, which makes plain areas suffer from flood disasters. Huadu District and Conghua District are located in the northern area which is a hilly region mainly of uplands. There are many pools of various sizes and around 200 reservoirs. Therefore, when under the conditions such as an extreme weather, lack of construction quality and other unusual factors, dyke-breaching and dyke-overflowing may happen and downstream regions of the reservoirs will suffer from flood. By collecting the above relevant information of each water project, this paper establishes some possible factors causing disasters such as dyke-breaching, dykeoverflowing, breaching of reservoir dams and dam-overflowing. The distribution of an urban disaster based on all kinds of flood conditions is constructed after considering the possibility of each factor that causes disasters. As the basis of a superimposing working condition, this model of the mechanism research dynamically generates a disaster heat map within cities. 2.4
Code generation of heat map and analysis of spatial superimposition
With a synthesis of rainstorm runoff mechanism research, research on on flood and storm tide superimposed on rainstorm and research on other relevant factors of flood, this paper conducts a weighting division of the average disaster-suffering situation of Guangzhou these years and establishes some possible factors based on disaster influence within Guangzhou. These factors are important references for resource allocation of flood control.
4
ITM Web of Conferences 17, 03001 (2018) https://doi.org/10.1051/itmconf/20181703001 WCSN 2017
The factor of possibility of flood impact is a research result based on a working condition of multi-disasters, which has an instructive impact on the frequency of flood occurrence. It is also an achievement of a scientific research on flood. By constructing a dynamic disasteraffected heat map based on the possible factors of a flood disaster, it is possible to visually show the possible disaster situations in each area within Guangzhou; based on data including the basic map data based on GIS, such as geographical basic map, road network layer and flood control resource distribution map, the spatial superposition analysis of dynamic disaster-affected heat map data, flood control resource data and data of road network accessibility are realized. According to the results of the superposition analysis, the data map based on the demand for resources of flood control is dynamically generated. The data heat map fully demonstrates the demand for resources of flood control of different areas within Guangzhou and it is an important reference for flood control rescue teams, flood control materials and flood control equipment configuration for management departments of three proofings. 2.5
Heat map system of resource allocation of flood control
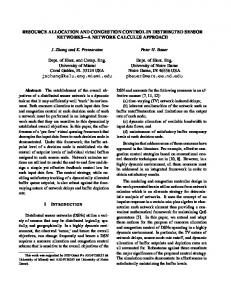
Heat map system of flood resource allocation of flood control is a assistant decision system of resource allocation based on GIS technology. This system uses the B/S architecture model based on the data of possible disaster-affected factors within Guangzhou and the data of the resources of flood control, which facilitates the update and the maintenance of data in the future. The main functions of this system include: a simple map-mode browsing, a dynamic generation of heat map of rainstorm runoff mechanism research, a dynamic generation of research on flood and storm tide superimposed on rainstorm, a dynamic generation of heat map of other flood factors, a dynamic generation of comprehensive factors of disaster-affected possibility, a dynamic generation of heat map of the demand for resources of flood control and function modules including an assistant decision for resource allocation of flood control. The structure chart of the system’s main functions is showed in figure 1. Through the research of this system, the paper constructs a function based on an analysis of possibility of being impacted by flood and provides an important reference for the allocation of resources of flood control in Guangzhou.
Figure. 1. The structure chart of functions of resource allocation of flood control chart of Guangzhou.
5
ITM Web of Conferences 17, 03001 (2018) https://doi.org/10.1051/itmconf/20181703001 WCSN 2017
3
Conclusion
Through the practice, it is proved that the GIS heat map technique has a prospect of being used widely in the management of resources of flood control. And the relevant information of flood disaster, waterlogging disaster, rescue team, rescue tool and rescue equipment can be visualized by GIS heat map technique to achieve an automated evaluation of resources of flood control, the automated management, the scientific decision-making and other functions, which greatly improve standard of decision-making for managerial staff to manage resources of flood control and promote a comprehensive construction of disaster prevention and rescue work.
Acknowledgments. Special fund for science and technology development in 2016 of Department of science and technology of Guangdong Province under Grant No. 2016A020223007.
References 1.
2. 3. 4. 5.
Jia Zhong, Gang Lie.: Research on the Mode of Urban Flood Control Emergency Reserves(In Chinese). Yangtze River, 44(20), 102-106(2013) Juan Li, Miaoyi Li, Ying Long Anrong Dang.: Analysis of multi center city in China based on Baidu thermal map(In Chinese). Data Augmented Design, 1673-8985, 3036(2016) Hongqi Chen, Jiancang Xie, Yirong Shen, Ni Wang.: Research on the Cooperative Inventory Models of Flood Prevention Materials (In Chinese). System engineering theory and Practice, 4, 91-98(2017) Shangwen Xie.: Modernization analysis of storage management of flood control material storage (In Chinese). Heilongjiang Science and Technology of Water Conservancy, 39 (1), 189-190(2011) Jingqi Han.: Modernization of management of storage and storage of flood control materials (In Chinese). Science and Technology Innovation Herald, 16, 116-117(2016)
6