Hindawi Publishing Corporation Mathematical Problems in Engineering Volume 2015, Article ID 624649, 11 pages http://dx.doi.org/10.1155/2015/624649
Research Article Dynamic Programming-Based Energy Management System for Range-Extended Electric Bus Xiaogang Wu, Jingfu Chen, and Chen Hu College of Electrical and Electronics Engineering, Harbin University of Science and Technology, Harbin, China Correspondence should be addressed to Xiaogang Wu;
[email protected] Received 28 August 2014; Accepted 27 September 2014 Academic Editor: Hui Zhang Copyright © 2015 Xiaogang Wu et al. This is an open access article distributed under the Creative Commons Attribution License, which permits unrestricted use, distribution, and reproduction in any medium, provided the original work is properly cited. The heavy computational burden associated with the application of the traditional DP strategy to the energy management of rangeextended electric buses poses a serious problem. On the basis of one Chinese typical urban bus driving cycle, an optimal control strategy is designed according to the SOC consumption trend, which is optimized by the DP algorithm. The dissipative energy and the energy-traction efficiency are our evaluation indices. The energy efficiencies of the powertrain system and components are analyzed by the energy flow diagram method. The results show that when the range-extended electric bus runs 35 Chinese typical urban bus driving cycles, the energy consumption and the energy efficiency of the powertrain system, which are optimized by the traditional DP strategy, can reach 2844.28 MJ and 31.29%, respectively. Compared with the traditional bus, the energy consumption can be reduced by 31.08%. The energy consumption and the energy efficiency of the powertrain system, which are based on one driving cycle optimal strategy, can reach 2857.69 MJ and 31.14%, respectively. The energy consumption is 0.47% higher than that with the traditional DP strategy, but the computation time is reduced by 96.85%.
1. Introduction The transport sector, a major oil consumer and greenhouse gas emitter, accounted for 26% of the world’s energy use and 23% of the energy-related greenhouse gas emissions (GHG) in 2004. Road transportation is responsible for over 90% of these emissions [1–3]. To overcome the resulting air pollution and energy crisis, governments are encouraging automobile manufacturers to develop electric vehicles (EVs) and hybrid electric vehicles (HEVs). However, the battery cycle life and the travel range of such vehicles continue to hinder their development. Therefore, for now, range-extended electric vehicles seem to be the most promising among renewable energy vehicles [4, 5]. Given that the energy required by range-extended electric vehicles is supplied mainly by range extenders and the electric power grid, optimal strategies should be applied to such vehicles’ energy management systems to minimize their energy consumption [6, 7]. At present, these optimal strategies can be classified into three categories [8]: rule-based strategies, modern control theory-based intelligent strategies, and optimal strategies. He et al. [9] presented several rule-based
control strategies such as constant-voltage control, outline control, and online control. Wei et al. [10] devised a modelbased fuel optimal control for HEVs. The rule-based control strategy is easy to understand and realize. However, it lacks any rigorous mathematical basis and it cannot extract the full performance potential of a hybrid system [11]. Schouten et al. [12] and Gong et al. [13] designed control rules for energy management systems by using fuzzy logic [14] and neural network. The methods achieved better results than the traditional rule-based control strategy, but its results still have difference to those achieved with the optimal strategies. The dynamic programming (DP) algorithm is widely used in the optimal strategies. DP is one of the best methods for dealing with constrained nonlinear optimal problems [15]. It is suitable for optimizing the control strategy of an energy management system when the driving cycle is known in advance. Geng et al. [16] and Barsali et al. [17] presented an equivalent consumption minimization strategy based on the DP algorithm. However, this strategy cannot be applied to real-time control because of its heavy computational burden. Given that the rule-based control strategy can be applied easily to real-time control, the DP algorithm can be combined with
2
Mathematical Problems in Engineering Electrical joint
Mechanical joint
Engine
Generator
Electrical joint
Rectifier Power battery
Range extender Mechanical joint
Transmission and main reducer
Traction motor
Electrical joint
Traction motor controller
Figure 1: REEB powertrain system structure.
the rule-based control strategy. The resulting hybrid control strategy would not only have the global optimal feature of DP strategy but also be easily applicable to real-time control. He et al. [18] used an optimal control strategy for a specified driving cycle to control long-distance driving cycle for a plug-in series-parallel hybrid electric bus. The strategy reduces the computational time significantly, while maintaining the desired precision. Chen et al. [19] designed a DP algorithm-based energy management strategy for rangeextended electric vehicles. Then, a rule-based control strategy was designed considering the global optimal solution and driving cycle recognition. Peng et al. [20, 21] considered energy consumption and GHG emissions to design an energy management strategy by using the DP algorithm and presented an adaptive rule-based control strategy based on the DP solution. Bianchi et al. [22] established a rule-based control strategy for HEVs by using the DP strategy. The corresponding simulation result was close to the optimal result. We present a DP and rule-based hybrid control strategy for a range-extended electric bus (REEB) running the Chinese typical urban bus driving cycle. This strategy retains the advantages of the DP and the rule-based strategies, while reducing the computational burden. The energy efficiencies of the range extender, the energy-traction, and the powertrain system are analyzed using the energy flow diagram method.
2. REEB Powertrain System Model 2.1. Powertrain System Structure Analysis. A schematic of the typical REEB powertrain is shown in Figure 1. The powertrain consists of a range extender, battery, traction motor, transmission, and the main reducer. The battery and the range extender provide power to the traction motor through electrical connections. The traction motor drives the wheels directly through the transmission and the main reducer. The entire power system is connected in series. One feature of the REEB is their large battery capacity, which provides greater power to the REEB, thus reducing fossil fuel consumption and emissions [23]. The range extender module of REEB mainly includes an engine, generator, and rectifier. The generator
is mechanically coupled to the output shaft of the engine. The range extender can convert diesel power into electric power for direct use by the traction motor or for charging the onboard battery, thus extending the vehicle’s driving range. Moreover, when the power demand of the bus is higher than what the battery can supply, the range extender provides the insufficient power, thus ensuring dynamic performance. 2.2. Powertrain System Modeling. We establish a backward simulation model considering the features of the DP strategy as well as the objective of analyzing fuel consumption. The relative speed 𝑢𝑟 at each discrete time point (𝑘) can be calculated using the following by the driving cycle data: 𝑢𝑟 (𝑘) =
V (𝑘) , 3.6
(1)
where V is the driving speed (km/h). To fulfill the requirements of the DP strategy, the vehicle’s longitudinal dynamics model is expressed as the following state equation: ̇ = 𝑢𝑟 (𝑘)
1 𝛿 (𝑚V + 𝑚𝑝 ) ×(
1000𝑃req (𝑘) 𝜂𝑇 𝑢𝑟 (𝑘)
(2)
𝑢 (𝑘) − 𝑟 (𝐹𝑓 + 𝐹𝑤 (𝑢𝑟 (𝑘)) + 𝐹𝑖 )) , 𝑢𝑟 (𝑘) where 𝛿 is the conversion coefficient of the vehicle rotation quality, 𝑚V is the bus mass, 𝑚𝑝 is the passenger mass, 𝑃req is the demand power of the transmission, 𝜂𝑇 is the efficiency of the transmission and the main reducer, 𝐹𝑓 is the rolling resistance, 𝐹𝑤 is the air resistance and the function of 𝑢𝑟 , and 𝐹𝑖 is the slope resistance. The parameters of the REEB are shown in Table 1.
Mathematical Problems in Engineering
3
Table 1: Powertrain parameters of range-extended electric bus.
Bus
Motor
Engine Generator and generator controller Power battery
The drive power of the vehicle 𝑃motor is provided by the battery 𝑃bat and/or the range extender 𝑃re , as expressed by the following: 𝑃motor =
𝑃req 𝜂motor
= 𝑃re + 𝑃bat ,
(3)
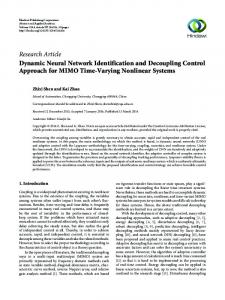
where 𝜂motor is the efficiency of the traction motor. Given the computational burden of the DP strategy, the dynamic characteristics of traction motor are ignored. The 2D look-up table is used for the traction motor model, as shown in Figure 2. Generally, the equivalent battery models include Rint, PNGV, and GNL. The Rint model focuses on the charge/discharge resistance and the open circuit voltage of the battery, and it has a simple structure. What is more, it meets the demand of the DP strategy. Considering the features of the DP strategy, the following form of the state equation is used in the battery model [24]: ̇ =− SOC
𝐼 (𝑘) , 𝑄bat
Torque (Nm)
Size (length × width × height)/mm Bus mass/kg Passenger mass/kg Windward area/m2 Air resistance coefficient 𝐶𝐷 Rolling resistance coefficient 𝑓 Rolling radius 𝑟/m Speed ratio of main reducer 𝑖0 Speed ratio of transmission 𝑖𝑔 Continuous power/kW Peak power/kW Maximum torque/N⋅m Maximum speed/r/min Operating voltage/V Displacement/L Power/kW Rated power/kW Rated torque/N⋅m Capacity Operating voltage/V
0.785 1100 1000 900 0.714 0.728 0.742 0.756 0.771 0.799 0.714 0.728 0.742 800 0.756 0.7710.827 0.898 700 0.799 0.855 600 500 400 0.912 300 200 0.884 0.799 100 0.785 500 2500 1500
× (𝑃motor (𝑘) − 𝑃re (𝑘)))
)
−1
× (2 (𝑅int (SOC) + 𝑅𝑡 ) 𝑄bat ) , where 𝐼 is the battery current, 𝑄bat is the battery capacity, 𝜂SOC is the Coulomb efficiency, 𝑈OCV is the open circuit voltage
0.841 0.813
0.813
3500
4500
5500
Figure 2: Efficiency map of traction motor.
of the battery, and 𝑅int and 𝑅𝑡 are the internal resistance and thermal resistance, respectively. 𝑅int and 𝑈OCV are functions of the SOC. The equivalent circuit of the simplified battery model is shown in Figure 3. As in [25], the charging 𝜂chg and discharging 𝜂dis efficiencies are calculated using the following: 𝑈OCV − 𝐼𝑅dis 1 4𝑅 𝑃bat = (1 + √1 − dis ), 2 𝑈OCV 2 𝑈OCV 𝑃motor (𝑘) − 𝑃re (𝑘) ≥ 0,
2 − (𝑈OCV (SOC) − 4 (𝑅int (SOC) + 𝑅𝑡 ) (4) 1/2
0.785 0.813 0.869 0.869
Speed (r/min)
𝜂dis =
̇ = −𝜂SOC (𝑈OCV (SOC) SOC
11980 × 2550 × 3200 13400 2760 7.83 0.75 0.0076 + 0.00056𝑢𝑎 0.512 6.2 2.18 100 180 860 4500 300∼450 1.9 82/4000 r/min 50 220 180 Ah 350∼460
𝜂chg =
𝑈OCV 2 = , 𝑈OCV − 𝐼𝑅chg (1 + √1 − 4𝑅 𝑃 /𝑈2 ) chg bat OCV
(5)
𝑃motor (𝑘) − 𝑃re (𝑘) < 0, where 𝑅dis and 𝑅chg are the discharging resistance and the charging resistance, respectively.
4
Mathematical Problems in Engineering
Uocv
Rt
ib Torque (Nm)
Rint + −
Figure 3: Equivalent circuit of simplified battery model.
3. DP Strategy and Analysis of Energy Flow Diagram
(6)
where 𝑓 represents (1)–(5). The constraint conditions of the state space are expressed by the following: 𝑃bat
𝑈bus,max (𝑈OCV − 𝑈bus,max ) ∈[ , 𝑅chg 𝑈bus,min (𝑈OCV − 𝑈bus,min ) ], 𝑅dis
4000
220 200 180 160 140 120 100 80 60 40 20
0.908 55 kw 50 kw 0.895 45 kw 0.908 40 kw 35 kw 0.895 30 kw 0.869 25 kw 20 kw 0.869 0.882 15 kw 0.844 0.895 0.882 10 kw 0.819 0.793 0.768 0.743 0.654 0.679 0.705 0.73 0.717 5 kw 0.692 0.6410.59 0.616 0.628 0.666 0.565 0.755 0.781 0.806 0.831 0.857 0.54 0.514 0.603 0.578 0.489 0.438 0.552 0.476 0.908 0.895 0.882 0.869 0.463 0.527 0.451 0.425 0.413 0.502 0.908
0.908
0.882
1400 1600 1800 2000 2200 2400 2600 2800 3000 3200 Speed (r/min)
3.1. DP Strategy-Based Energy Management Strategy. In the horizon [𝑡0 , 𝑡𝑓 ], the state variables of the REEB powertrain system include the SOC of the battery and the bus speed. As the bus speed can be determined from the driving cycle, the state variable is 𝑥(𝑡) = [SOC(𝑡)] . According to the optimal objective of minimum equivalent fuel consumption, the range extender is regarded as the control variable, 𝑢(𝑡) = [𝑃re (𝑡)]. The powertrain system of the REEB in the discrete form is shown as follows: 𝑥̇ = 𝑓 (𝑥 (𝑘) , 𝑢 (𝑘)) ,
482 498 513 528 559 536 544 551 590 597 567 60 65 582574
Figure 4: BSFC map of engine.
Torque (Nm)
The dynamic characteristics of the engine and generator models in the range extender are also ignored to reduce the computational burden of the DP strategy. Their models are the MAPs, which are generated by using the data from the bench tests. Because the generator is mechanically coupled to the output shaft of the engine, the generator and engine are in the same working points. The optimal fuel economy curve of the range extender is developed by the method described in [19], as shown in Figures 4 and 5.
23 30 38 .35926 45 .9 53 .6 61 68 76. 84. 91. 240 99. 107 115 123 130 138 145 153 161 168 176 184 191 199 207 230 55 kw 220 50 kw 214 45 kw 200 40 kw 7.66 15. 3107 23 30. 6115 38. 45. 9130 53. 6138 61. 3145 68. 9153 76. 6161 84. 2168 91. 99. 5184 123 176 35 kw 191 180 199 207 214 245 237 30 kw 160 230 25 222kw 140 20 kw 120 245 230 15 kw 253 100 237 260 268 245 80 10 kw 276 283 60 214 222 230 237 245 253 260 268 276 283 291 322 314 299 337 329 352 5 kw 368 306 345 383 436 467 360 390 40 452 398 375 429 444 413 459 475 490 521 505 429 406 421 20 1000 1500 2000 2500 3000 3500 Speed (r/min)
Figure 5: Efficiency map of generator.
represent the maximum torque and the minimum torque of the traction motor, respectively. The key to the DP strategy is the reasonable cost function. In this paper, the electric power is equivalent to the fuel consumption, and achieving the minimum fuel consumption is regarded as the objective for reducing the fuel consumption and emissions. The cost function 𝐽 is shown as follows: 𝑁
𝐽 = ∑ {𝐶re,𝑘 + 𝑘𝑘 𝐶bat,𝑘 } ,
where 𝐶re,𝑘 is the fuel consumption of the range extender in the 𝑘th state, 𝐶bat,𝑘 is the equivalent fuel consumption of the battery in the 𝑘th state, and 𝑘𝑘 is the coefficient for constraining the SOC. The fuel consumption of the range extender, equivalent fuel consumption of the battery, and 𝑘𝑘 can be calculated as follows:
(7)
𝐶re = 𝑃eng 𝑏𝑒Δ𝑡,
0 ≤ 𝑃re ≤ 𝑃re,max , SOC𝐿 < SOC < SOC𝐻, 𝑇𝑚,min < 𝑇𝑚 (𝑡) < 𝑇𝑚,max , where 𝑈bus,max , 𝑈bus,min , 𝑈OCV , 𝑅chg , and 𝑅dis are battery parameters that represent the maximum voltage, minimum voltage, open circuit voltage, and charging resistance and discharging resistance, respectively. 𝑃re,max denotes the maximum power of the range extender. SOC𝐻 and SOC𝐿 represent the maximum and minimum values of the SOC, respectively. 𝑇𝑚 denotes the traction motor torque; 𝑇𝑚,min and 𝑇𝑚,max
(8)
𝑘=0
− sgn(𝑃bat )
𝐶bat = 𝑃bat (𝜂dis 𝜂chg ) 𝑘𝑘 = 1 −
𝐶re,avg 𝑃re,avg
Δ𝑡,
2𝜇 (SOC − 0.5 (SOC𝐻 − SOC𝐿 )) , (SOC𝐻 − SOC𝐿 ) (9)
where 𝑃eng is the output power of the engine in the 𝑘th state, 𝑏𝑒 is the specific fuel consumption, 𝐶re,avg is the average fuel consumption of the range extender, 𝑃re,avg is the average output power of the range extender, and 𝜇 is the balance
Mathematical Problems in Engineering
5
coefficient required to maintain the SOC within the reasonable range [26]. 3.2. Energy Consumption Analysis Based on Energy Flow Diagram. In this section, the energy conversion process is analyzed from the power grid and the fuel used to the wheels. The energy efficiencies of the powertrain system and components are calculated. The fuel and electric consumption are converted to MJ-equivalent values. The driving power at the wheels 𝑃dem is calculated as follows: 𝑃dem (𝑡) = 𝑃𝑓 (𝑡) + 𝑃𝑤 (𝑡) + 𝑃𝑖 (𝑡) + 𝑃𝑗 (𝑡) = 𝐹𝑓 (𝑡) 𝑢𝑟 + 𝐹𝑤 (𝑡) 𝑢𝑟 + 𝐹𝑖 (𝑡) 𝑢𝑟 + 𝐹𝑗 (𝑡) 𝑢𝑟 .
(10)
The energy at the driving wheels 𝐸dem and the input power of the traction motor 𝐸motor,input can be calculated using (11). According to the method in [19], if we ignore regenerative braking energy, the output torque of the traction motor is also very similar to that in the normal model. Moreover, there is a slight difference in the negative value of the output torque. Therefore, regenerative braking energy is ignored to reduce the computational burden of the DP strategy. 𝐸dem can be obtained by integration when 𝑃dem is positive. Consider 𝐸dem = ∫
𝑃dem (𝑡)>0
𝐸motor,input =
𝐸motor,output 𝜂𝑚 𝑃dem (𝑡)>0
+∫
𝑃bat (𝑡)>0
𝐸𝑏 = ∫
𝑃bat (𝑡)>0
𝑃bat (𝑡) 𝑑𝑡, 1000
3.6 (SOC (𝑡) − SOC (𝑡 − 1)) 𝑄𝑉 (𝑡) 𝑑𝑡, =∫ 1000𝜂chg (𝑡)
This paper focuses on the energy loss during charging and discharging, including charging the battery from the grid, charging the battery from the range extender, and discharging the battery to the traction motor. 𝜂chg,avg is the average efficiency of battery charging, 𝜂chg is the efficiency of battery charging, and 𝜂dis is the battery discharge efficiency. The output energy of the range extender is calculated as follows: 𝐸𝑔 = ∫
𝑃bat (𝑡)