Hindawi Publishing Corporation Mathematical Problems in Engineering Volume 2014, Article ID 389547, 10 pages http://dx.doi.org/10.1155/2014/389547
Research Article Fuzzy-Based Segmentation for Variable Font-Sized Text Extraction from Images/Videos Samabia Tehsin,1 Asif Masood,1 Sumaira Kausar,2 and Fahim Arif1 1 2
MCS, National University of Science & Technology (NUST), Islamabad, Pakistan College of E & ME, National University of Science & Technology (NUST), Islamabad, Pakistan
Correspondence should be addressed to Samabia Tehsin;
[email protected] Received 28 October 2013; Revised 23 December 2013; Accepted 14 January 2014; Published 19 March 2014 Academic Editor: Yi-Hung Liu Copyright © 2014 Samabia Tehsin et al. This is an open access article distributed under the Creative Commons Attribution License, which permits unrestricted use, distribution, and reproduction in any medium, provided the original work is properly cited. Textual information embedded in multimedia can provide a vital tool for indexing and retrieval. A lot of work is done in the field of text localization and detection because of its very fundamental importance. One of the biggest challenges of text detection is to deal with variation in font sizes and image resolution. This problem gets elevated due to the undersegmentation or oversegmentation of the regions in an image. The paper addresses this problem by proposing a solution using novel fuzzy-based method. This paper advocates postprocessing segmentation method that can solve the problem of variation in text sizes and image resolution. The methodology is tested on ICDAR 2011 Robust Reading Challenge dataset which amply proves the strength of the recommended method.
1. Introduction Recently there has been a rapid surge in multimedia reservoirs that raised the need of efficient retrieval, indexing, and browsing of multimedia information. Several methodologies are presented in the literature to retrieve image and video data, which exploit color, texture, shape, and relation between objects, and so forth. However, embedded text in images can be extraordinarily instrumental for data retrieval as visual texts in multimedia communicate information regarding news headlines, title of movie, trade-name of products, summaries of sports contest, date and time of events, and so forth. Such information can be influential for the understanding and retrieval of images or videos. Text implanted in images may be categorized in two classes, namely, caption text and scene text. Caption text is imposed over the image in the editing process for example news headings and match summary/score. It is also referred to as artificial text or superimposed text, whereas scene text is an actual part of the scene, that is, brand name of the product during commercial break, text on sign-board, name plate and text visible on dresses or product, and so forth. One of the key challenges posed to the text detection process is to deal with text size variations. The text variation
may be classified in two types: firstly, the variation of spatial resolution of images and secondly the variation of font sizes within an image. This paper focuses on the above mentioned problem in text detection and provides viable solutions for both categories of the problem. The rest of the paper is ordered as follows. Section 2 highlights some related work of the field. Section 3 introduces the proposed method to segment text in images. Section 4 presents the dataset used and results of text segmentation algorithm. Section 5 provides some concluding remarks.
2. Literature Review A variety of techniques for text extraction have appeared in the recent past [1–6]. Comprehensive surveys can be traced explicitly in [7–9]. These techniques can be categorized into two types mainly with reference to the utilized text features, that is, region-based and texture-based methods [10]. Texture-based methods pertain to textural properties of the text, distinguishing it from the background. These techniques mostly use Gabor filters, Wavelet, Fast fourier transform, Spatial variance, and so forth. This approach further uses machine learning methods such as support
2 vector machine (SVM), multilayer perceptron (MLP), and adaBoost [11–15]. Region-based methods use distinct region features to extort text content. This methodology deals with the color dissimilarity of the text and its surrounding pixels. Procedures based on color, edge, and connected components are frequently exercised in this category [16–19]. These techniques typically work in the bottom up fashion by initially segmenting the small regions and lately grouping the potential text regions. Region-based methods are generally composed of three modules: (1) segmenting the image into small regions which aims at segregating the character regions from its background, (2) merging and grouping of small regions to form words and sentences, and (3) differentiating between text and nontext objects. Segmentation identifies the occurrence of different regions in the image but does not recognize the relation between these regions. It is substantial to merge the characters of a word to form a text object, because most of the text detection techniques work on group of characters and it is very difficult to detect the isolated character [20, 21]. This grouping can utilize the pixel level features or can exploit the high level features. Presently, few pixel level merging methods are introduced in the literature pertaining to text detection. Dilation is the most commonly used merging technique [22– 26], wherein the dimensions of the morphological operator intrinsically characterize the range of the homogeneous segmented regions. Consequently, hefty text blocks are tending to oversegmentation, whereas diminutive text areas are possibly skipped. Fixed size of the structuring element can only materialize for limited spatial resolution and small range of font sizes. Besides, size of the structuring element should be dependent upon the size of the text but usually has the fixed value which cannot deal with the variation in resolution of image and size of text. Some methodologies in literature utilize pyramid approach to solve this problem and extend the range of text sizes for detection [23, 27, 28]. This highly increases the computational requirements or demands for parallel processing mechanisms. Object level merging is more close to human vision and deals with the objects and regions instead of pixels. It connects the potential character objects to form the text strings. Hence, the grouping and merging are dependent upon some high level features which gives better performance. Wolf and Jolion [29] used disparity in heights and positions of the connected component to merge the characters. Minetto et al. [27] developed a grouping step, based on the space between the two text areas relative to their height. Pan et al. [30] built component relation using minimum spanning tree. This text detection method merges the characters into words using shape and spatial difference. Gonzalez and Bergasa [31] suggested that characters of the same word should have several similar characteristics, for instance, stroke size, altitude, position, adjacency, and constant interletter and interword spacing. Shi et al. [32] used the graph model to merge the neighboring regions to form text strings. The adjoining nodes for each node are those ones that persuade the certain conditions based upon difference in color, position, width
Mathematical Problems in Engineering ratio, and height ratio. Character candidates are linked into pairs in Yao et al. [33] method. If two regions have similar stroke widths (ratio between the mean stroke widths is fewer than 2.0), matching sizes (ratio between their characteristic scales does not surpass 2.5), and similar colors and are closely placed (distance between them is less than two times the sum of their characteristic scales), they are tagged as a couple. Subsequently, a greedy hierarchical agglomerative clustering approach is exercised to combine the pairs into candidate chains. Though these features are defined by strict boundaries in the existing techniques, the relation between the neighboring characters is not crisp. It is principally inequitable to declare a character as a neighbor if its distance to height ratio is 1.50 or less, whereas the same verdict gets void, if the ratio turns to even 1.51. The parameters to define the proximity of potential character should have been diffused instead of crisp logic. Thus, there is a need to architect a merging process in which the rules of inference are formulated in a general way, utilizing diffused categories. There is a requirement to frame a system which gives some weight to each of the features used for measuring the degree of neighborhood. Moreover, the similarity obtained by the currently reported features mostly does not correspond to human perception. Human perception of propinquity, similar heights, and similar color cannot be fully expressed using discrete and rigid boundaries or thresholds. These linguistic variables can be better defined by the fuzzy logic.
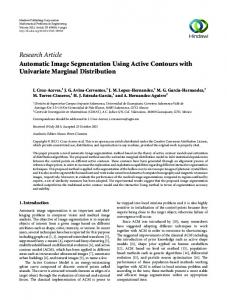
3. Methodology Component extraction or segmentation is the procedure of dividing a digital image into multiple fragments, called superpixels [34, 35]. The objective of segmentation is to reduce the computational complexity of the under process image and make its representation easier to analyze. Image segmentation is classically used to trace objects and boundaries in images. In particular, image segmentation is the process to label the pixels of image, where the pixels with same labels share some common characteristics such as color, intensity, and texture and; moreover, edge detection is a basic instrument used in most image processing applications to obtain sharp alteration in intensity of the region boundaries. Proposed segmentation method consists of two processes: splitting and merging. Splitting is performed by the traditional region-based segmentation techniques, whereas merging is based on the novel fuzzy-based method. Figure 1 provides the architecture of the proposed work. 3.1. Splitting. There exists sharp transition between the text and its background. Edge detection is the budding segmentation tool for text images because sharp intensity transition is the common feature in all the text objects. Exploiting this feature, edge detection along with the connected component labeling is used for segmentation in the proposed methodology, where Sobel edge detection technique is used for edge detection, and image dilation is applied to connect the broken edges.
Mathematical Problems in Engineering
3
Original image
Feature extraction Edge detection Fuzzification Dilation Fuzzy inference engine Association Defuzzification Splitting Fuzzy merging
Segmented image
Figure 1: Architecture of the proposed method.
ΔHt i,j
Posi
Ht j
ΔPosi,j Ht i
Posj (a)
(b)
Δd (c)
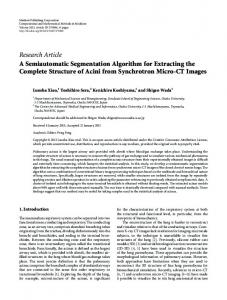
Figure 2: Factors fed into the fuzzy system: (a) height, (b) position, and (c) distance.
Adaptive size of the dilation operator is calculated in consonance with the resolution of the image, which ranges between 3 and 5% of the width of the image. Dilation is performed prior to the fuzzy merging just to minimize the computational efforts. Proposed fuzzy merging method can work without this morphological operation. 3.2. Fuzzy Merging. Succeeding section explains the fuzzy merging process.
Let 𝐼 be the input image and 𝑅 the set of all the regions of 𝐼, extracted by the above mentioned method. Let 𝐼 = {𝑅1 , 𝑅2 , 𝑅3 , . . . , 𝑅𝑚 }, and 𝑚 is the total number of regions in the image 𝐼. The problem of merging process can be defined using the graph theory. Let 𝐺 denote the undirected graph and 𝑉(𝐺) = 𝑅 represent the vertices of the graph 𝐺. Edges of the graph 𝐺 are 𝐸(𝐺) = {(𝑅𝑖 , 𝑅𝑗 ) ∈ 𝑅𝑥𝑅 | 𝑖 ≠ 𝑗}. These edges show the probability of joining two vertices. Initially, ∀𝑒 ∈ 𝐸(𝐺) are set
4
Mathematical Problems in Engineering
to null. This probability 𝑝𝑖.𝑗 can be calculated by fuzzy logic and based upon the four factors. Four factors considered are explained later in the paper. Fuzzy-based methods assign gradual membership value to the objects, to join with other text instances, which are measured as degrees in [0, 1]. This gives the flexibility to connect the object based on more than one feature, depending upon the different membership values of all the parameters. 3.2.1. Feature Extraction. The merging of character candidates relies on number of factors. Four features are extracted for the decision of joining objects as words or sentences. These features are color, height, position, and distance. Color. Color is taken as the parameter to join the two text objects. Color of the characters of a single word or sentence is mostly the same. If the colors of two text objects are similar, then these objects can be the candidates to merge. In order to get the degree of similarity, difference between the two colors is calculated. Lab color coding is used to describe the color of the object. Unlike RGB and CMYK, Lab color coding approximates the human vision system. Δ𝐸 is described in the 𝐿∗ 𝐶∗ ℎ∗ color space with differences in lightness, chroma, and hue calculated from 𝐿∗ 𝑎∗ 𝑏∗ coordinates. Difference of two colors having coordinates (𝐿∗1 , 𝑎1∗ , 𝑏1∗ ) and (𝐿∗2 , 𝑎2∗ , 𝑏2∗ ) can be defined as
Δ𝐸 = √ (
2
2
2 ∗ Δ𝐶∗ Δ𝐻𝑎𝑏 Δ𝐿∗ ) + ( 𝑎𝑏 ) + ( ). 𝐾𝐿 𝑆𝐿 𝐾𝑐 𝑆𝑐 𝐾𝐻𝑆𝐻
Δ𝐿∗ = 𝐿∗1 − 𝐿∗2 , 𝐶1∗ = √𝑎1∗ + 𝑏1∗ , 2
2
∗ Δ𝐶𝑎𝑏 = 𝐶1∗ − 𝐶2∗ , ∗ ∗ − Δ𝐿∗ − Δ𝐶∗ Δ𝐻𝑎𝑏 = √Δ𝐸𝑎𝑏 𝑎𝑏 2
2
2
∗ , = √Δ𝑎∗ + Δ𝑏∗ + Δ𝐶𝑎𝑏 2
2
Δ𝑎∗ = 𝑎1∗ − 𝑎2∗ , Δ𝑏∗ = 𝑏1∗ − 𝑏2∗ , 𝑆𝐿 = 1, 𝑆𝐶 = 1 + 𝐾1 𝐶1∗ , 𝑆𝐻 = 1 +
𝐾2 𝐶1∗ ,
𝐾2 = 0.015. (2) ∗ Δ𝐻𝑎𝑏
presents the arithmetic Geometrically, the amount mean of the chord lengths of the equal chroma circles of the two colors. Height. Difference of heights is the second input parameter for fuzzy system. Only objects with similar heights should be merged because characters of the same word or sentence have the same or similar heights. Difference of heights of two objects is measured as follows: Ht𝑖 − Ht𝑗 , (3) ΔHt𝑖,𝑗 = Ht𝑖 where Ht𝑖 and Ht𝑗 are the heights of 𝑖th and 𝑗th objects, respectively. Position. Position of the two objects should be the same for merger. This merging process is proposed for horizontal text only as most of the caption text is horizontally aligned. This can be expanded to other directions by considering position at different angles. Consider Pos𝑖 − Pos𝑗 , (4) ΔPos𝑖,𝑗 = Ht𝑖 where Pos𝑖 and Pos𝑗 are the bottom coordinates of bounding boxes of 𝑖th and 𝑗th objects, respectively.
where 𝑥𝑛 (1) and 𝑥𝑛 (2) are the left and right coordinates of bounding box of 𝑛th object. Figure 2 explains the height, position, and distance phenomena pictorially.
𝐶2∗ = √𝑎2∗ + 𝑏2∗ , 2
𝐾1 = 0.045,
Distance. Characters of the same word or sentence are placed closely. The distance between characters varies with the variation in font size and is highly dependent upon the heights of the characters. Distance (Δ𝑑) between two regions in an image is calculated by min (𝑥𝑖 (1) − 𝑥𝑗 (2) , 𝑥𝑗 (1) − 𝑥𝑖 (2)) (5) , Δ𝑑 = Ht𝑖
Here,
2
(1)
𝐾𝐿 = 1,
2
3.2.2. Fuzzification. This step gets the inputs and decides the degree to which suitable fuzzy sets belong by means of membership functions. The input has to be a crisp numerical value bounded to the universe of discourse of the input variable and the output is a fuzzy degree of membership in the qualifying linguistic set. Fuzzification of the input refers to either a table lookup or function estimation. Let the inputs to the fuzzy system be represented in the vector notation: 𝑥∗ = [𝑥1∗ 𝑥2∗ 𝑥3∗ 𝑥4∗ ] = [Δ𝐸 ΔHt ΔPos Δ𝑑] ,
(6)
Mathematical Problems in Engineering
5
where 𝑥∗ belonging to 𝑅4 represents real value points. We define symmetric Gaussian function and sigmoid function for the input. The symmetric Gaussian function is defined by two parameters 𝜎 and 𝑐:
rule-based inference with union combination, min implication, min operator for 𝑡-norm, and max operator for 𝑠-norm: Ru(1) : IF Δ𝐸 is 𝐴1 and ΔHt is 𝐵1 and ΔPos is 𝐶1 and Δ𝑑 is 𝐷1 THEN 𝑦 is 𝑍2 ;
𝜇𝐵𝑓 (𝑥2 ) = 𝑒−(1/2)((𝑥2 −𝑥2
2
(𝑒)
)/𝜎1(𝑒) )
(𝑓)
)/𝜎2 )
𝜇𝐴𝑒 (𝑥1 ) = 𝑒−(1/2)((𝑥1 −𝑥1
,
(𝑓) 2
(𝑔) 2
−(1/2)((𝑥3 −𝑥3 (𝑔) )/𝜎3 )
𝜇𝐶𝑔 (𝑥3 ) = 𝑒
𝜇𝐷ℎ (𝑥4 ) = 𝑒−(1/2)((𝑥4 −𝑥4
(ℎ)
2
)/𝜎4(ℎ) )
,
Ru(2) : IF Δ𝐸 is 𝐴2 and ΔHt is 𝐵1 and ΔPos is 𝐶1 and Δ𝑑 is 𝐷1 THEN 𝑦 is 𝑍2 ; (7)
,
or ΔPos is 𝐶3 or Δ𝑑 is 𝐷3 THEN 𝑦 is 𝑍1 ;
,
Ru(4) : IF Δ𝐸 is 𝐴1 and ΔHt is 𝐵2
where 𝑒 = 1, 2; 𝑓 = 1, 2; 𝑔 = 1, 2; and ℎ = 1, 2 represent the number of fuzzy sets. 𝑥1 (𝑒) , 𝑥2 (𝑓) , 𝑥3 (𝑔) , and 𝑥4 (ℎ) represent the (𝑓) (𝑔) means of fuzzy sets, where 𝜎1(𝑒) , 𝜎2 , 𝜎3 , and 𝜎4(ℎ) represent the variances of fuzzy sets. Third membership function of all the inputs exhibits a progression from miniature start that advances and reached a culmination over time. Sigmoid function is used to express this phenomenon. Consider
𝜇𝐴𝑠 (𝑥1 ) = 𝜇𝐵𝑡 (𝑥2 ) = 𝜇𝐶𝑢 (𝑥3 ) = 𝜇𝐷V (𝑥4 ) =
1 + 𝑒−𝑎𝑠 (𝑥1 −𝑐𝑠 )
,
1 , 1 + 𝑒−𝑎𝑡 (𝑥2 −𝑐𝑡 ) 1 + 𝑒−𝑎𝑢
Ru(5) : IF Δ𝐸 is 𝐴1 and ΔHt is 𝐵2 and ΔPos is 𝐶2 and Δ𝑑 is 𝐷1 THEN 𝑦 is 𝑍2 ; Ru(6) : IF Δ𝐸 is 𝐴1 and ΔHt is 𝐵1 and ΔPos is 𝐶2 and Δ𝑑 is 𝐷1 THEN 𝑦 is 𝑍2 ;
and ΔPos is 𝐶1 and Δ𝑑 is 𝐷2 THEN 𝑦 is 𝑍2 , (10) (8)
, (𝑥 −𝑐 ) 3
𝑢
1 1+
and ΔPos is 𝐶1 and Δ𝑑 is 𝐷1 THEN 𝑦 is 𝑍2 ;
Ru(7) : IF Δ𝐸 is 𝐴1 and ΔHt is 𝐵1
1
1
Ru(3) : IF Δ𝐸 is 𝐴3 or ΔHt is 𝐵3
𝑒−𝑎V (𝑥4 −𝑐V )
,
where 𝑠 = 3; 𝑡 = 3; 𝑢 = 3; and V = 3 represent the fuzzy set’s number. 𝑎𝑠⋅⋅⋅V and 𝑐𝑠⋅⋅⋅V are the model parameters to be fitted. The following function is used to map 𝑥∗ belonging to 𝑅4 into fuzzy set 𝐴𝐵𝐶𝐷: 𝜇𝐴𝐵𝐶𝐷 (𝑥1 , 𝑥2 , 𝑥3 , 𝑥4 ) = 𝜇𝐴 (𝑥1 ) ∗ 𝜇𝐵 (𝑥2 ) ∗ 𝜇𝐶 (𝑥3 ) ∗ 𝜇𝐷 (𝑥4 )
(9)
= min (𝜇𝐴 (𝑥1 ) , 𝜇𝐵 (𝑥2 ) , 𝜇𝐶 (𝑥3 ) , 𝜇𝐷 (𝑥4 )) . Minimum 𝑡-norm operator (∗) is used for fuzzification. 3.2.3. Product Inference Engine. Multiple inputs and single output fuzzy rule-base is employed for the current merging problem. Product inference engine (PIE) makes use of fuzzy rule base and linguistic rules. PIE encompasses individual
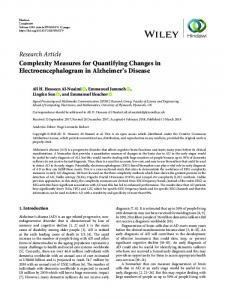
where (𝐴1 , 𝐴2 , 𝐴3 ), (𝐵1 , 𝐵2 , 𝐵3 ), and (𝐶1 , 𝐶2 , 𝐶3 ) are the input fuzzy membership functions for the same, similar, and different, (𝐷1 , 𝐷2 , 𝐷3 ) are the membership values for minimum, average, and maximum and (𝑍1 , 𝑍2 ) are the output membership functions corresponding to Not join and join. Triangular curve function is used as output membership function that can be defined by 0 { { { { { { 𝑦𝑚 − 𝑎𝑧 𝜇𝑍 (𝑦𝑚 ) = { 𝑏𝑧 − 𝑎𝑧 { { { { { 𝑐𝑧 − 𝑦𝑚 { 𝑐 − 𝑏𝑧
𝑦𝑚 ≤ 𝑎𝑧 OR 𝑐𝑧 ≤ 𝑦𝑚 𝑎𝑧 ≤ 𝑦𝑚 ≤ 𝑏𝑧
(11)
𝑏𝑧 ≤ 𝑦𝑚 ≤ 𝑐𝑧 .
More compactly, it can be expressed as
𝜇𝑍 (𝑦𝑚 ) = max (min (
𝑦𝑚 − 𝑎𝑧 𝑐𝑧 − 𝑦𝑚 , ) , 0) . 𝑏𝑧 − 𝑎𝑧 𝑐𝑧 − 𝑏𝑧
(12)
The parameters 𝑎𝑧 and 𝑐𝑧 define the feet of the triangle and the parameter 𝑏𝑧 defines the peak. Figure 3 shows different membership functions used in the system.
6
Mathematical Problems in Engineering
Similar
Same 1
Different Degree of membership
Degree of membership
Same 1 0.8 0.6 0.4
0.6 0.4 0.2
0
0 5
10
Different
0.8
0.2
0
Similar
0
15
0.2
0.4
0.6
Color (a)
Same 1
1.2
(b)
Similar
Minimum 1
Different
Average
Maximum
0.8 Degree of membership
0.8 0.6 0.4 0.2
0.6 0.4 0.2 0
0 0
0.5
1.5
1
0
1
0.5
2.5 2 Distance
1.5
Position (c)
3
(d)
True
False 1 Degree of membership
Degree of membership
1
0.8
Height
0.8 0.6 0.4 0.2 0 0
0.2
0.4
0.6
0.8
1
Join (e)
Figure 3: Membership functions: (a) color, (b) height, (c) position, (d) distance, and (e) output.
3.5
4
Mathematical Problems in Engineering
7
PIE can be fully defined by
Table 1: Comparison of proposed work with other techniques.
𝜇𝑍 (𝑦𝑚 ) =
max
{𝑒,𝑓,𝑔,ℎ,𝑠,𝑡,𝑢,V,𝑧}
{ sup min (𝜇𝐴𝐵𝐶𝐷 (𝑥1 , 𝑥2 , 𝑥3 , 𝑥4 ) , 𝑥𝜖𝑋
𝜇𝐴𝑖 (𝑥1 ) 𝜇𝐵𝑖 (𝑥2 ) , 𝜇𝐶𝑖 (𝑥3 ) ,
(13)
3.2.4. Defuzzification. Defuzzification is the mapping of fuzzy values into the real-world values. Center average fuzzifier (CAD) is used as the weighted average of the centers of fuzzy sets as it provides a reasonable approximation: 𝑛
𝑟 𝑦(𝑐) 𝜔𝑛(𝑐) ∑𝑐=1
𝑛
𝑟 ∑𝑐=1 𝜔𝑛(𝑐)
,
(14)
where 𝑦(𝑐) and 𝜔𝑛(𝑐) are the center and height of the output fuzzy sets. CAD is chosen because it is computationally less expensive and has more accuracy and continuity when compared to other defuzzifiers [36].
4. Results and Experiments Dataset of ICDAR 2011 Robust Reading Competition, Challenge 1: “Reading Text in Born-Digital Images (Web and Email),” is applied in this research, wherein the dataset comprises 102 images of test and 420 images of training sets. The above dataset possesses vast variation in font size, resolution, background complexity, and font type. However, ICDAR dataset is recognized as the most widely used benchmark for text detection. The ranking metric used for the text segmentation task is accurate. Accuracy of segmentation can be defined as 𝑁
No. of correctly segemented objects . Acc = ∑ Total number of objects 𝑖=1
Recall
Precision
Harmonic mean
Textorter with fuzzy merging Textorter [37] TH-TextLoc∗
73.75 69.62 73.08
85.12 85.83 80.51
79.02 76.88 76.62
∗
𝜇𝐷𝑖 (𝑥4 ) , 𝜇𝑍 (𝑦𝑚 )) } .
∗ 𝜔𝑚 = 𝑦𝑚 =
Method
(15)
In the text detection and localization problem, isolated character is also considered as under segmentation. Proposed method obtained 90.7% accuracy for segmentation of text objects. Comparison of the segmentation results with and without fuzzy merging can be viewed in Figure 4. Segmentation without fuzzy merging is tested for adaptive and fixed size structuring elements. Achieved results show that fuzzy merging has a very effective role in segmentation for text detection. In order to prove the practicability of the proposed segmentation method, fuzzy merging is added as the post segmentation process in textorter [37], which is the best technique in ICDAR Robust Reading Competition 2011 [38], whereby the results justify a major improvement in the detection rate of textorter. It is also factual that many isolated characters are not detected as text by textorter, as these are not merged as a complete word. The ranking metric used
Stood second in ICDAR Robust Reading Competition 2011 [38].
for the text localization task is the harmonic mean which is computed according to the methodology proposed in [39]. It is a combination of two measures: precision and recall. Table 1 shows the comparison of results for different text detection methods. Figure 5 shows the superiority of the proposed method. Results show that fuzzy merging really enhances the segmentation process for text detection. Different combinations for input and output membership functions are tested, where the results show that the combination testified in the proposed methodology ensures the best outcome. Gaussian, triangular, sigmoid, trapezoidal, and bell-shaped are commonly used membership functions. These functions are tested for making different combinations of fuzzy inference engine. Gaussian, triangular, and sigmoid functions are defined in Section 3.2.2. Bell-shaped function can be defined as 𝜇𝐴 (𝑥) =
1 1 + |(𝑥 − 𝑐) /𝑎|2𝑏
.
(16)
The comprehensive bell function can be defined using three parameters 𝑎, 𝑏, and 𝑐, and here the parameter 𝑏 is mostly positive, whereas parameter 𝑐 traces the middle of the curve. The trapezoidal curve is a function of a vector “𝑋” and is dependent upon four scalar parameters 𝑎, 𝑏, 𝑐, and 𝑑: 0, { { { 𝑥−𝑎 { { , { { { {𝑏 − 𝑎 𝜇𝐴 (𝑥) = {1, { { 𝑑−𝑥 { { { {𝑑−𝑐, { { {0,
𝑥