Hindawi Publishing Corporation e Scientific World Journal Volume 2014, Article ID 847930, 14 pages http://dx.doi.org/10.1155/2014/847930
Research Article QoS Measurement of Workflow-Based Web Service Compositions Using Colored Petri Net Hossein Nematzadeh,1 Homayun Motameni,1 Radziah Mohamad,2 and Zahra Nematzadeh1 1 2
Department of Computer Engineering, Islamic Azad University Sari Branch, Sari, Iran Faculty of Computing, Universiti Teknologi Malaysia, 81310 Skudai, Johor, Malaysia
Correspondence should be addressed to Hossein Nematzadeh;
[email protected] Received 31 March 2014; Accepted 8 June 2014; Published 3 July 2014 Academic Editor: Xiaoting Rui Copyright © 2014 Hossein Nematzadeh et al. This is an open access article distributed under the Creative Commons Attribution License, which permits unrestricted use, distribution, and reproduction in any medium, provided the original work is properly cited. Workflow-based web service compositions (WB-WSCs) is one of the main composition categories in service oriented architecture (SOA). Eflow, polymorphic process model (PPM), and business process execution language (BPEL) are the main techniques of the category of WB-WSCs. Due to maturity of web services, measuring the quality of composite web services being developed by different techniques becomes one of the most important challenges in today’s web environments. Business should try to provide good quality regarding the customers’ requirements to a composed web service. Thus, quality of service (QoS) which refers to nonfunctional parameters is important to be measured since the quality degree of a certain web service composition could be achieved. This paper tried to find a deterministic analytical method for dependability and performance measurement using Colored Petri net (CPN) with explicit routing constructs and application of theory of probability. A computer tool called WSET was also developed for modeling and supporting QoS measurement through simulation.
1. Introduction Composition of web services could be categorized in four major groups. One of these major groups is called workflowbased web service composition (WB-WSCs) in which most of the specification of QoS is neglected except performance and reliability [1]. WB-WSC includes eflow [2, 3], polymorphic process model (PPM) [4, 5], and BPEL [6–8]. Quality of service (QoS) which refers to nonfunctional parameters is important to be measured since the customers’ requirements to a composed web service should be achieved. To do so, Colored Petri net (CPN) was extended and enhanced for further deterministic dependability and performance measurement. Even for BPEL, the background researches reveal that most of the QoS measurement methods were on performance and reliability [9, 10]. Studying the literature also reveals that three main specifications of Petri net and its extensions make them capable in modeling and evaluation of WB-WSCs; Petri nets have graphical notation; Petri nets’ states could be shown explicitly, and there are many available techniques to evaluate Petri nets [11–16]. Therefore, explicit CPN was
selected to evaluate WB-WSCs in this research. The explicitly of CPN is in using split/join transitions in case of conflict or concurrency. In order to measure the QoS firstly explicit CPN was defined and enhanced to include new routing constructs called PICK split/join. Then the components of WB-WSCs were mapped to explicit CPN using a given transformation table. Finally, deterministic QoS measurement was done in terms of availability, security, maintainability, reliability, dependability, and performance for WB-WSCs. The QoS measurement was done both analytically and experimentally using simulation. Firstly, the analytical formulas were developed based on theory of probabilities (independent and dependent probabilities) and geometric distribution; then, a case tool called WSET was also developed to apply simulation and find the experimental results. The experimental results supported and complied with the developed analytical formulas. The organization of the remaining parts of the paper is as follows: in Section 2, the definition of CPN was provided and followed by enhancement in CPN routing construct. Then, a transformation table from WB-WSCs to CPN with explicit
2
The Scientific World Journal
routing constructs was given. Next, Section 3 explained how dependability and performance can be calculated deterministically and analytically using CPN with explicit routing constructs. Then, Section 4 introduced WSET for simulation and proposed illustrative examples. Finally, the paper concluded with related discussions and future work on Section 5.
2. Transforming WB-WSCs to CPN In this paper CPN was defined explicitly for the purpose of workflow modeling in web service compositions as a 𝑁 = (𝑃, 𝑇, 𝐹, 𝑊, 𝐶, 𝑀0 , 𝑆, 𝜏), where (i) 𝑃 is a set of places. Places are shown using circles inside CPN which are responsible for collecting tokens; (ii) the set of transitions 𝑇 is divided into two subsets: 𝑇𝑖 and 𝑇𝑡 defining the set of immediate and timed transitions, respectively. Immediate transitions fire immediately once they are enabled whereas timed transitions fire after a random enabling time in [𝛼, 𝛽] in which 𝛼 is the minimum and 𝛽 is the maximum time assigned to each transitions. Formally 𝑇𝑖 ∪ 𝑇𝑡 ∈ 𝑇; (iii) 𝐹 is a set of arcs known as a flow relation which are shown using arrows. 𝐹 ⊆ (𝑃 × 𝑇) ∪ (𝑇 × 𝑃), that is, any two transitions either 𝑇𝑡 or 𝑇𝑖 , cannot be linked directly to each other. They need a place between; (iv) 𝑊 : 𝐹 → N, N = 1, 2, 3 . . . is a set of arc weights, which assigns to each arc 𝑓 ∈ 𝐹. In this research, the weights of all arcs were N = 1 denoting one token is consumed from a place by a transition or alternatively, one token is produced by a transition and put into each place; (v) 𝐶 = {𝐶1 , 𝐶2 , 𝐶3 , . . . , 𝐶𝑘 } is the finite set of color. The CPN in this research contains distinguished colored tokens which could be identified by their ids. Each id is a nonnegative integer. Arcs and transitions can carry and fire 𝐶; (vi) 𝑀0 : 𝑃 → 0 is an initial marking, where for each place 𝑝 ∈ 𝑃, there are 0 ∈ N tokens. There is a source transition (𝑇0 ) which is responsible to fire new tokens periodically with distinguished ids into the CPN; (vii) 𝑆 : 1 → N, N = 1, 2, 3 . . . assigns an integer number to any timed transition which specifies the size of that transition. Any transition could be considered as an array of transitions in this definition. The concept of size helps to model the concept of web service instances. At any time two different users can approach one web service simultaneously. This, for example, could be achieved if a transition has a size of two; (viii) 𝜏 → [𝛼, 𝛽] assigns each timed transition a deterministic period of time. This gives a delay to each timed transition which helps to calculate the overall performance of a token when it reaches final place(s).
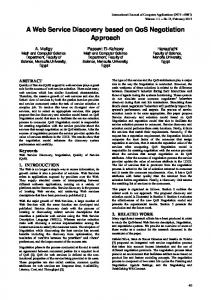
The guard in timed transitions is always true (timed transitions fire any nonnegative integer id as colored tokens) and the expression attached to the arcs was defined in a way that any arcs could carry any nonnegative integer id as colored tokens. All of the CPN places can have data values of integers. 2.1. Enhancement in CPN Routing Constructs. Generally there are two ways to model systems using Petri nets: implicit modeling and explicit modeling. If there exists a situation (triggers or external application, . . .) in the system that leads making decision occurs as late as possible, then implicit modelling will be used. When making decision to select a route in CPN that is clear then explicit modeling would be selected. For explicit modeling researchers usually use AND split/join transitions for concurrency and OR split/join transitions for conflict (exclusive OR). The new building block called PICK split/join was proposed in this research to model the concept of inclusive OR explicitly. PICK split selects one or more routes from many routes in contrast with traditional OR split which selects exactly one route from many routes. Application of inclusive OR usually occurs while having several services in the form of checkboxes as in generic node in eflow. The firing rule of PICK split/join was given in the following. The schematic block also was given in Figure 1. (i) A PICK split is said to be enabled if the input place 𝑝 of split transition contains at least one token. (ii) Based on the routing rules inside PICK split, outcoming arcs should be fired. The choice is based on workflow attributes; it is a deterministic choice. PICK split can skip any of three transitions (𝑇1 , 𝑇2 , 𝑇3 ) in transitions’ pool, using a boolean variable like need. The term “transitions’ pool” refers to number of transitions that potentially could be selected. 2.2. Mapping from WB-WSCs to CPN. A global explicit transformation model from WB-WSCs (eflow, PPM, and BPEL) to CPN was given in this section and depicted in Figure 2. Basic service node in eflow, primitive activities of BPEL, and activities and subprocesses of PPM were transformed to a transition in CPN. It is important to mention that BPEL does not support the concept of inclusive OR. Using the transformation model of Figure 2, the final CPN model would be free choice and well structured. By the term free choice it was meant that there is not any confusion in CPN and well structuredness refers to using AND join transitions for AND split, OR join transitions for OR split, and PICK join transitions for PICK split in synchronization [17]. Figure 2 clearly showed how primitive services and structured services can be transformed into the related CPN model. Structured services are inclusive OR, exclusive OR, concurrency, loop (repeat/while), or sequential activities. Generally parallel routing of web services (executing all routes) is shown with AND split transition and its synchronization is shown using AND join transition. Exclusive conditional routing/XOR (executing exactly one route from many) is shown with OR split transition and its synchronization is shown using OR
The Scientific World Journal
3 Transitions pool
T1 T2
CPN PICK split
T3
PICK join
Transition T1 : skip if need.t1 = false Transition T2 : skip if need.t2 = false Transition T3 : skip if need.t3 = false
Figure 1: The Schematic of PICK split/join with three transitions in generic pool.
Any simple service like an ordinary service for “bill payment” Generic operations in PPM, primitive activities in BPEL, event nodes in eflow
Conflict; switch-XOR
Repeat
Concurrency; AND
While
Pick; selection of one or more
Sequential activities
Figure 2: Explicit transformation of WB-WSCs to CPN routing constructs.
join transition. Conditional routing/OR (executing at least one route from many) is shown with PICK split and its synchronization is shown with PICK join.
3. Dependability Measurement Reliability is the probability of the WB-WSC system to carry out its functional requirements failure-free for a specified period of time and under stated conditions. Reliability can be assessed by calculating the commitment ratio of a service by finding the percentage a certain service could commit in a specified period of time. Security is the probability of the WB-WSC system to provide authenticated users or services with access to the services under certain authorization. Authentication and authorization referred to exclusivity. Not only exclusivity is a matter of concern in security but also the method which is used for encrypting data is a key metric in security of a service in a WB-WSC. It is
possible to specify methods for measuring exclusivity and data encryption method through the supporting party [18]. Maintainability is the probability of the WB-WSC to recover itself in a specified time (t) in case of failure [19]. The fault tolerance methods comprising error detection and error discovery techniques used in the services of WB-WSC are a key factor in determining maintainability. Availability in WB-WSC means both exclusivity and accessibility. Only legitimate users and parties should access the service in WB-WSC and the service that is accessed should be usable. Accessibility ensures accessing usable services. Usability was shown by the term “at hand” in Figure 3. One way to assess the accessibility is to calculate the percentage of time the service becomes deliverable within the determined time [20]. Dependability is in the top of the hierarchy. The more reliable, secure, maintainable, and available the WB-WSC is, the more dependable it is [21]. Since reliability, security, maintainability, and availability have direct impact on dependability, the average of the four already defined quality attributes was defined as dependability in WB-WSCs. Supporting parties can manage and monitor the correctness of the metrics in Figure 3 that the service provider claims. The existence of a supporting party guarantees the level of service for service users from service providers. This could be done by updating WSLA service definition and service obligation. Based on the metrics and the related discussions above and the definition of quality attributes in the literature [22, 23], the overall dependability conceptual model based on the key features of each parameter was given in Figure 3 represented in UML 2.0. 3.1. Analytical Calculation Process. Transitions in CPN could either success or fail to fire. In this view transitions led to two outcomes: 1 for success and 0 for failure. In an uncertain view, a probability of success rate could be assigned to each transition through testing. Assuming 0.98 as a success rate of the transition 𝐶 means that transition 𝐶 would be able to fire successfully 98 times in 100 times. So, the failure rate would be 0.02 whereas 0.98 + 0.02 = 1. Through this strategy the success rate of each of the metrics in Figure 3 can be
4
The Scientific World Journal
Dependability
Determines
Reliability
Maintainability
Availability
Security
Metric
Accessibility
Strength of fault tolerance
Strength of authorization method
The ratio of being at hand
Strength of authentication method
Commitment ratio
Strength of cryptography
Exclusivity
Figure 3: Dependability conceptual model.
calculated via a third supporting party. The probability of success and failure was determined in (1) as follow: 𝑃 (success) =
the number of success , 100
the number of failure 𝑃 (failure) = . 100
(1)
In which 𝑃(success) + 𝑃(failure) = 1. Knowing the metrics, the quality parameters in Figure 3 can be calculated. The calculated metrics assigned to CPN transitions were independent. Regarding reliability, surely the commitment ratio of transition A does not depend on the commitment ratio of transition B. However, the composition of transitions may affect the quality calculation as follows. (A) Sequential Transitions. Assuming the CPN in Figure 4(a) has two sequential transitions with the quality metrics of 𝑄1 and 𝑄2 , respectively, the new quality value (𝑄(new) at the output place of transition with 𝑄2 ) was calculated through the multiplication of 𝑄1 and 𝑄2 by 𝑄(old) in (2) where 𝑄(old) is the calculated quality inside CPN (𝑄(old) is increased with successive multiplication in CPN). This is because 𝑄1 does not depend on 𝑄2 ; therefore, based on the independent theory of probability, the overall quality would be the multiplication of 𝑄1 by 𝑄2 . In addition, the performance of CPN using sequential transitions in Figure 4(a) can be calculated as in (3) where Rt1 and Rt2 are the average response times of current transitions. It is important to mention that the initial value of 𝑄(old) and Per(old) (at the beginning of CPN) was set to one and zero, respectively. Always at the end of calculation of each quality calculation equation, 𝑄(new)
and Per(new) should be assigned to 𝑄(old) and Per(old), respectively, until reaching the end place of CPN. Consider 𝑄 (new) = 𝑄 (old) × 𝑄1 × 𝑄2 ,
(2)
Per (new) = Per (old) + Rt1 + Rt2 .
(3)
(B) Conflict (Exclusive OR). Figure 4(b) illustrated a part of CPN with OR split/join blocks of transition. Generally, the quality value inside OR split/join block can be calculated through summation of multiplication of probability of firing (PF) of each outcoming arc in OR split by its respective quality value as shown in (4) and Figure 4(b). Consider 𝑄 (new) = 𝑄 (old) × [(PF1 × 𝑄1 ) + (PF2 × 𝑄2 )] .
(4)
Split/join transitions are nonblocking so they do not have any impact in the overall performance of the CPN. If a maximum and minimum time for the timed transitions could be identified and also the probability of firing of each outcoming arc of split transitions could be specified, the performance would be calculated deterministically using the average time and probability of firing. Assuming the average response time for transition with 𝑄1 and 𝑄2 is Rt1 = 6 and Rt2 = 8, respectively, in Figure 4(b); the token inside CPN (in the input place of OR split) has the average response time of 𝑛 = 12; OR split has the probability of firings of PF1 = 0.6 and PF2 = 0.4 (PF1 + PF2 = 1). The quality value, which here is the performance in the output place of OR join, will be calculated as 12 + (0.6 × 6) + (0.4 × 8) = 18.8 using (5) in which Per(new) means new performance and Per(old) means old performance. Consider Per (new) = Per (old) + (PF1 × Rt1 ) + (PF2 × Rt2 ) .
(5)
The Scientific World Journal
5
Q2 , Rt2
Q1 , Rt1
PF1
Q1 , Rt1
PF2
Q2 , Rt2
CPN
CPN Q(new) = Q(old) × Q1 × Q2
Q(new) = Q(old) × [(PF1 × Q1 ) + (PF2 × Q2 )]
Per(new) = Per(old) + Rt1 + Rt2
Per(new) = Per(old) + (PF1 × Rt1 ) + (PF2 × Rt2 )
(a)
(b)
Q1 , Rt1
PF1 CPN
PF1 = 1
Q1 , Rt1
PF2 With dependent PFs:
Q2 , Rt2 2𝑛 −1
Q(new) = Q(old) × ∑ i =1 [max(A i ) × PFi ]
CPN
2𝑛 −1
Q2 , Rt2 PF2 = 2 Q(new) = Q(old) × min(Q1 , Q2 )
Per(new) = Per(old) + ∑ i =1 [max(A i ) × PFi ]
With independent PFs:
Per(new) = Per(old) + max(Rt1 , Rt2 )
Q(new) = Q(old) × M Per(new) = Per(old) + M Where M is in (9)
(c)
(d) Q, Rt Q, Rt
q
CPN
CPN
p
Q(new) = Q(old) × Q(1/p−1)
p = 1 − q; q = probability of loop occurrence
Per(new) = Per(old) + Rt × (1/p − 1)
p = 1 − q; q =probability of loop occurrence
q p
(e)
Figure 4: Quality calculation process on CPN routing constructs using theory of probability.
(C) Concurrency. Regarding AND split transitions, PFs for all outcoming arcs are one; therefore, the quality value inside AND split/join transitions is the minimum of quality values inside AND split/join block. Likewise, 𝑄(new) was calculated through multiplication of min (𝑄1 , 𝑄2 ) by 𝑄(old) as shown in (6) and Figure 4(c). Since the quality value was intended to be calculated in the worst case, the minimum of (𝑄1 , 𝑄2 ) were chosen. Consider 𝑄 (new) = 𝑄 (old) × min (𝑄1 , 𝑄2 ) .
(6)
However, in performance calculation of AND split/join, the maximum time of transitions between AND split and AND join is considered because performance was intended to be calculated in the worst case. Therefore the overall performance of Figure 4(c), with Rt1 = 6 and Rt2 = 8, would be calculated as 12 + Max((1 × 6), (1 × 8)) = 20, using (7) as follows: Per (new) = Per (old) + Max (Rt1 , Rt2 ) .
(7)
(D) Selection of One or More (Inclusive OR). Two approaches were identified in prediction of the behavior of PICK split/join blocks: (1) using dependent PFs for PICK split and (2) using independent PFs for PICK split. Figure 4(d) showed the average quality value calculation in case of having PICK split/join blocks of transition with dependent PFs. In Figure 4(d), 𝐴 is a set that has all subsets of set 𝐶 except Ø, so it had 2𝑛 − 1 members. 𝐴 𝑖 is the 𝑖th member of 𝐴, PF𝑖 is the 𝑖th member of PF, PF is the set of probability of firing for each member of 𝐴, and 𝐶 is a set of all quality values between PICK split/join. Hence, in Figure 4(d), 𝐴 = {(𝑄1 ), (𝑄2 ), (𝑄1 , 𝑄2 )}, 𝐶 = {𝑄1 , 𝑄2 }, and assuming probability of firings of PF = {0.4, 0.25, 0.35} (PFs are dependent), then the quality value inside PICK split/join would be 𝑄 = (0.4 × 𝑄1 ) + (0.25 × 𝑄2 ) + (0.35 × min(𝑄1 , 𝑄2 )) accordingly. The minimum was used to calculate the quality between PICK split/join transitions in the worst case. Therefore the 𝑄(new) is the summation of
6
The Scientific World Journal
multiplication of 𝐴 𝑖 by its respective PF𝑖 multiplied by 𝑄(old) as shown in 2𝑛 −1
𝑄 (new) = 𝑄 (old) × ∑ [min (𝐴 𝑖 ) × PF𝑖 ] .
(8)
𝑖=1
As a second way of calculation of the quality parameter inside PICK split/join, independent probability of firings could be assigned to each outcoming arc of PICK split. For example, in Figure 4(d), two probabilities of 75% and 60% could be assigned to PF1 and PF2 , respectively (the sum of PF1 and PF2 is not necessarily 1). In implementation view, for each output arc of PICK split, a random number in [1, 100] would be generated. If the random generated number is in the range of the probability of the path then that path will be selected. In this case in Figure 4(d), PICK split will not fire with the probability of 10% = (1 − 75%) × (1 − 60%). Thus, PICK split transition should refire to send out all existing tokens. Using independent probabilities, the average quality value inside PICK split/join block can be calculated as (9) where 𝑛 is the number of transitions between PICK split/join. Consider 𝑀:
The probability of occurring all 2𝑛 − 1 cases , 1 − The probability of repeating the experiment
𝑀: (PF1 × (1 − PF2 ) × 𝑄1 + PF2 × (1 − PF1 ) × 𝑄2
(9)
+ PF1 × PF2 × min (𝑄1 , 𝑄2 ))
(E) Loop. For quality calculation inside loop, geometric distribution in theory of probability was used. In geometric distribution, parameter 𝑝 is a geometric distribution parameter where the range of 𝑝 is 0 < 𝑝 ≤ 1. Now if the probability in which OR split fires token inside loop is known as 𝑞, then 𝑝 could be simply calculated as 𝑝 = 1 − 𝑞.
Using the probability mass function in (14), the exact number of (𝑘 − 1) times OR split transition fires a certain token inside loop can be calculated as follows: (1 − 𝑝)
𝑀: (PF1 × (1 − PF2 ) × Rt1 + PF2 × (1 − PF1 ) × Rt2 (11)
Per (new) = Per (old) + 𝑀. The total performance inside PICK split join block also can be calculated using dependent PFs as in (12) where 𝐴 is a set that has all subsets of set 𝐶 except Ø, so it had 2𝑛 −1 members. 𝐴 𝑖 is the 𝑖th member of 𝐴, PF𝑖 is the 𝑖th member of PF, PF is the set of probability of firing for each member of set 𝐴, and 𝐶 is a set of all response time values between PICK split/join. Consider 2𝑛 −1
Per (new) = Per (old) × ∑ [max (𝐴 𝑖 ) × PF𝑖 ] . 𝑖=1
(12)
(14)
(15)
Nevertheless, assuming 𝑞 = 0, then 𝑝 = 100%, the average time the token can be fired inside loop through OR split is calculated as 1/100% = 1. When 𝑞 = 0, then 1/𝑝 should be zero. Thus, (15) should change to (16) to alleviate this problem. Consider (16)
Generally the deterministic quality value of loop (repeat/ while) can be calculated using (17) where Q is the amount of quality value inside loop. Consider
(10)
In case of using PICK split/join with independent PFs (assuming PF1 = 60%, PF2 = 50%) and with Rt1 = 6 and Rt2 = 8, the overall performance would also be calculated as 12 + (5.8/0.8) = 12 + 7.25 = 19.25 through (9) and (11) as follows:
−1
𝑘: 1, 2, 3 . . . .
1 − 1. 𝑝
Since the quality value was intended to be calculated in the worst case, minimum of (𝑄1 , 𝑄2 ) was selected. In addition, the 𝑄(new) calculation in Figure 4(d) changes as follows:
× (1 − [(1 − PF1 ) × (1 − PF2 )]) ,
×𝑝
1 . 𝑝
−1
+ PF1 × PF2 × min (Rt1 , Rt2 ))
𝑘−1
However, since the deterministic calculation was intended in this research, the mean geometric distribution was used as in (15) to find the average time a certain token can be fired inside loop through OR split. Consider
× (1 − [(1 − PF1 ) × (1 − PF2 )]) .
𝑄 (new) = 𝑄 (old) × 𝑀.
(13)
𝑄(1/𝑝−1) .
(17)
Thus, the overall quality value of a token after passing a loop block diagram can be calculated as (18) and also was illustrated in Figure 4(e). Consider 𝑄 (new) = 𝑄 (old) × 𝑄(1/𝑝−1) .
(18)
In which 𝑝 = 1 − 𝑞 and 𝑞 = probability of loop occurrence. Obviously, the quality of each transition was calculated based on the metrics for each parameter. For example, if the intended quality is security then 𝑄 = strength of authorization method × strength of authentication method × strength of cryptography. In implementation of loop, a random number is generated in OR split block. If the random number is in the range of 𝑞 (probability of loop occurrence), the token will be fired inside loop through OR split transition. In addition, the performance of CPN using loop in Figure 4(e) can be calculated as in (19) where Rt in (19) is the average response time of loop. Consider Per (new) = Per (old) + Rt × ( 𝑝 = 1 − 𝑞;
1 − 1) , 𝑝
𝑞 = probability of loop occurrence.
(19)
The Scientific World Journal
7
(a) Random generator = new Random(); double x1 = generator.nextDouble(); if(x1< 0.75) // ←PF 1 { fire(T1); // The function fire(); fires the selected transition } double x2 = generator.nextDouble(); if(x2< 0.6) // ←PF 2 { fire(T2); // The function fire(); fires the selected transition } (b) Random generator = new Random(); double x = generator.nextDouble(); if(x< 0.75) // ←PF 1 { fire(T1); // The function fire(); fires the selected transition } x = generator.nextDouble(); if(x< 0.6) // ←PF 2 { fire(T2); // The function fire(); fires the selected transition } (c) Random generator = new Random(); for(int i=0; i < n; i++) { double x = generator.nextDouble(); if (x< P[i]) fire(T[i]); } Algorithm 1: PICK split firing rules (a): for two outcoming arcs, (b): for two outcoming arcs and more memory saving, and (c): generalized for 𝑛 outputs.
It is important to mention that using dependent PFs, the characteristic of inclusive OR was changed to exclusive OR. This is not handy especially when the number of outcoming arcs of PICK split is increased. Assuming 5 members for set 𝐶 yields 31 members for set 𝐴 and PF. The advantage of considering independent PFs is easier calculation and simpler implementation. The implementation concept of PICK split using independent probabilities of firings was shown for given two outcoming arcs (PF1 = 0.75 and PF2 = 0.6) in Algorithm 1(a). Algorithm 1(a) was modified with more memory savings in Algorithm 1(b) and was generalized in Algorithm 1(c).
4. Simulation and Illustrative Examples Web service evaluation tool, WSET, was developed by java programing to support explicit and deterministic QoS measurements of WB-WSCs experimentally. Using WSET the WB-WSC designer can first generate the intended eflow, PPM, and BPEL. Then, WSET converts the WB-WSC to CPN for intended QoS measurement, namely: performance, reliability, availability, security, maintainability, and dependability.
Regarding the QoS measurement, based on the time of 𝑇0 (source transition) and final time (the entire time the CPN should be simulated) which is specified by the user, the CPN simulation is done by WSET. The public method Token () included attributes for QoS measurement which are initiated when the public method is called in each run of WSET. As the colored tokens pass the transitions of CPN the quality values will be computed accordingly and at the end of simulation the amount of each quality value in end places of CPN will be aggregated and averaged. The data structure that is mostly used in WSET was stack. All the places of CPN have the first in first out queue in order to keep the colored tokens. Source transition in CPN which is responsible to fire tokens inside the system also uses first in first out queue. In order to detect the routing constructs of CPN (split/join transitions), a first in last out queue is associated with a token. 4.1. ECS. Electronic certificate service, (ECS), was a sample project implemented in the center of issuing of electronic certificates in Iran ministry of commerce in which its eflow was illustrated in Figure 5 and the relevant CPN was given in Figure 6. The user commences preregistration process
8
The Scientific World Journal
Get user info
User email = .ir
User email != .ir
Check user email from .ir domain provider
Send an email to the user, contains request to come and get certificate
.ir user email != true
.ir user email = true Send certificate by certificate provider to operator dashboards
Get certificate from certificate provider and send it to operator dashboards
Select mode = immediate
Inquiry national code from civil registration provider
Send certificate request to certificate provider in a pending mode
National code != true Send an error email to user
Select mode != immediate
National code = true Inquiry post code from post provider Certificate type services
Send an error email to user
Send a successful email to user
Post code != true Post code = true
Send application to operator dashboards
Figure 5: Eflow of ECS.
through entering personal information, national code, post code, and email. In case of success in (user info collection, user email domain verification, national code verification, and postcode verification), a verification email would be sent to the user in which the user would be asked to send back the necessary documents for issuing certificate. Then, the filled application would be sent to operator dashboards. The operator will do the definitive registration by selecting a certain certificate from the certificate pool (SSL, secure email, digital signature). Next, operator will select the definitive
certificate issuance mode (immediate or pending). To notify the user regarding the certificate issuance, an email would be sent to the user contains a request which implies to come and receive the certificate. Table 1 shows the result of WSET for measuring performance, reliability, and availability of the eflow; based on the given inputs PICK split/join was calculated based on the independent probabilities of outcoming arcs. According to Table 1 the minimum and maximum time for transition 𝑇0 is 10 and 30, respectively. This means that on the average each (10 + 30)/2 = 20 units of
The Scientific World Journal
9 T0 T15
End place
T14
T13
T1
T12
T2 End place
T10
T11
T9 End place
T6
T3
End place
T8
T7
T5
T4
Figure 6: CPN of eflow of ECS.
time each colored token can enter the CPN through 𝑇0 . Using 20000 units of time for final time, the approximate number of colored tokens can enter the CPN can be calculated as 20000/20 = 1000. Final time refers to the simulation period. A web service is modeled by a transition however its instance was modeled by the concept of size which was assumed 10 for each timed transition. This means that any timed transition can service to 10 colored tokens simultaneously. In other words there will be no queues for 10 colored tokens in the input place of a transition with the size of 10. The metrics in Table 1 (min time, max time, CR, SAM, SAM(2), and BH) can be calculated and managed by supporting parties. The responsibility of supporting parties is to guarantee the levels of service (quality of service) that the service provider provides for its customer. Regarding the calculation of commitment ratio one of the strategies that the supporting party can apply is to run the special service at least 100 times with different test cases to check the percentage the special service commits in a given period of time. That would be the commitment ratio for reliability calculation. The rest of the metrics can also be calculated using the same strategy. Also supporting third parties can propose these levels of service in web service level agreement, so by fetching the WSLA of each web service by service users this information could be achieved. Figure 7 also shows how
Figure 7: Generation of ECS using WSET.
WSET generates ECS. Likewise, Figure 8 shows WSET QoS measurement results after transformation the initial ECS to the relative CPN using Figure 2. As it is clear in Figure 8, WSET gives extra information besides the intended QoS. WSET also shows how many colored tokens have been fired to the CPN through 𝑇0 and how many of them could reach to the final queues based on the final time which was assumed to be 20000. With 20000 for final time, 1003 colored tokens have been fired to the CPN through the source transition 𝑇0 which had minimum
10
The Scientific World Journal Table 1: Quality evaluation of eflow using WSET.
Transition 𝑇0 𝑇1 𝑇2 𝑇3 𝑇4 𝑇5 𝑇6 𝑇7 𝑇8 𝑇9 𝑇10 𝑇11 𝑇12 𝑇13 𝑇14 𝑇15
Minimum time
Maximum time
CR
SAM
10 30 100 2 5 99 2 4 99 3 4 99 1 2 100 3 4 99 1 2 100 2 3 100 2 3 100 3 4 99 3 4 99 2 4 99 2 4 99 3 5 99 2 4 99 2 3 99 PICK split probability of firings OR split probability of firings in order of appearance in Figure 6 Size of transitions 𝑇1 to 𝑇15 Final time Reliability Availability Performance
SAM(2)
BH
100 100 98 100 100 99 99 99 100 100 99 99 100 100 99 100 99 100 99 100 99 100 99 100 99 100 99 99 99 97 98 100 30-50-30 (30-70), (5-95), (5-95), (5-95), (30-70) 10 20000 93.98% 82.09% 24.86 (units of time)
100 100 99 98 100 98 100 100 100 100 100 100 100 99 98 100
CR: commitment ratio, SAM: strength of authorization method, SAM(2): strength of authentication method, and BH: the ratio of being at hand (usability ratio).
Figure 8: QoS measurement of ECS using WSET based on the given input.
time of 10 and maximum time of 30. Likewise, WSET could identify the number of tokens which have not reached to the final queues because of time limitation which was specified by final time. The experimental result in Figure 8 could also be calculated using analytical formulas in Section 3.1. In fact the nondeterministic behavior of CPN was predicted deterministically provided that the probability of firings and the metrics for intended quality attributes were given and the explicit view in CPN (using split/join transitions) was considered.
4.2. UTSP. Universal telecommunication service provisioning (UTSP) process is a famous PPM-based multienterprise process which was illustrated in Figure 9(a) and the CPN was shown in Figure 9(b). The top process starts when a customer requests a universal telecommunication services by providing the information via a web browser through exchanging information activity. For verification of information and creation of the corresponding record, order service activity is performed. Next, the top process continues with a combination of four subprocesses. After all selected subprocessess are completed an activity is performed to create a single bill. Finally, the care for customer activity informs the establishment of the requested universal service and verifies if it meets the customer needs. Table 2 shows the result of WSET for measuring performance, maintainability and security of the entire PPM based on the given inputs. Final time was assumed 5000, size of transitions was assumed 10 and independent probability of firing was used for PICK split transition. Based on the minimum and maximum time of 𝑇0 1000 tokens (5000/5) will be fired approximately through 𝑇0 to the CPN on the average. 4.3. DES. Data entry service (DES) is an orchestration service that is used for monitoring entered data. Such a service can be used in any data collection process. The relevant
The Scientific World Journal
11 Local exchange service provider Provide local exchange service Long distance service provider
Exchange info
Provide long distance service
Order service
Care for customer
Bill
Wireless service provider Universal service provider Provide wireless service
Universal service provider
Internet service provider Provide internet service (a)
T3 T0
T1
T2
T7
T4
T8
T5
End place
T6 (b)
Figure 9: (a) PPM of UTSP and (b) CPN for PPM of UTSP.
Table 2: Quality evaluation of PPM using WSET. Transition 𝑇0 𝑇1 𝑇2 𝑇3 𝑇4 𝑇5 𝑇6 𝑇7 𝑇8
Minimum Time
Maximum Time
Strength of fault tolerance
Strength of authorization method
Strength of authentication method
2
8
100
100
100
99 99 98 97 97 99 100 99
99 100 99 99 98 98 100 100
4 8 3 6 12 16 10 18 8 13 8 15 3 6 2 4 PICK split probability of firings Size of transitions 𝑇1 to 𝑇8 Final time Maintainability Security Performance
BPEL of a possible DES was given in Figure 10(a) and its CPN was given in Figure 10(b). First, initial and essential data were inserted through invoking essential data entry service. Then, for retrieval from central database and to do some further analysis, the inserted data was sent to fac¸ade layer which is responsible for managing services and in parallel to common layer and data access layer. Then to find a possible history from the inserted data the fetch data from database service was invoked. In case of no history the complemental data entry service was invoked and the
98 100 99 99 98 99 100 100 30-10-20-80 10 5000 95.50% 94.35% 30.53 (units of time)
Strength of cryptography 100 100 100 99 99 99 99 100 100
additional data were saved and also was assigned true using assign optional data. Finally a service would send all data to email query. Suppose that the BPEL designer/modeler wants to calculate the dependability, reliability, availability, security, maintainability and performance of the given BPEL based on the inputs in Table 3. Here, the final time was assumed 20000, size of transitions were assumed 10, and dependent probabilities of firing were used and adjusted for OR split outcoming arcs in which 30% of time fetch data from data base service was invoked.
12
The Scientific World Journal Invoke essential data entry service
End place
Invoke send to façade layer service
T0
T10
Receive request for data entry
Invoke send to data access layer service
Invoke send to common layer service
T1 T2
T9
User has history =? Yes
T3
No
Invoke fetch data from database service
Invoke complemental data entry service
T7
Assign optional data additional data = true T6
T8
T5
T4
Invoke send data to email query service
Reply data entry := acknowledged
(a)
(b)
Figure 10: (a) BPEL of DES and (b) CPN for BPEL of DES.
5. Discussion Generally what have been done in this research was QoS measurement of WB-WSCs. ECS, UTSP, and DES were selected for evaluation. Then evaluation was done with the help of WSET. WSET can be initiated with arbitrary number of colored tokens and at the end the average result regarding QoS of WB-WSCs complied with the deterministic formulas calculated in Section 3.1 analytically. QoS depends on the customer’s view. Business should try to provide good quality regarding the customers’ requirements to a composed web service. Through this research it was shown how this quality can be calculated numerically using the theory of probability including dependent probabilities, independent probabilities, and geometric distribution for a WB-WSC. Instead of using fuzzy terms like the dependability of the BPEL is good or the availability is satisfactory, now it can be said that the
dependability is almost 90% and the availability is approximately 81%. In this way the terms good and satisfactory were defuzzified and even between two good results the better one can be chosen. It is clear that we are looking for “just enough” [24] level of quality in WB-WSCs as a softwarebased system. There is a balance between web services cost, schedule, and the expected level of quality. But at least we can predict the overall QoS in a web service composition to see if it meets the customer needs or not. Of course for having more qualified WB-WSCs, more qualified web services should be used which could increase the service cost and the delivery schedule. WSET supported the QoS measurement result experimentally and proved the analytical formulas. Using WSET, WB-WSC designer/modeler can also generate web service compositions with nested structured activities. It was also mentioned how supporting third parties can calculate the needed metrics and attach them to the
The Scientific World Journal
13 Table 3: Quality evaluation of BPEL using WSET. 𝑇0
Transitions
𝑇1
Minimum Time Maximum Time Commitment ratio Strength of fault tolerance Strength of authorization method Strength of authentication method Strength of cryptography The ratio of being at hand (Usability ratio)
10 2 30 4 100 100 100 100 100 100 100 100 100 100 100 99 OR split probability of firings Size of transitions 𝑇1 to 𝑇10 Final time Maintainability Reliability Security Availability Dependability Performance
𝑇2
𝑇3
𝑇4
𝑇5
𝑇6
𝑇7
6 10 99 99 99 98 99 99
5 10 99 100 99 99 99 99
6 12 98 100 99 99 99 99
5 14 99 100 99 99 99 99
6 10 97 100 99 98 98 99
𝑇8
8 2 14 4 99 99 99 100 98 100 98 100 98 100 99 99 30-70 10 20000 97.34 92.88 88.01 81.48 89.93 50.72 (units of time)
𝑇9
𝑇10
5 8 99 99 99 99 99 99
2 4 100 100 100 100 100 99
Table 4: Comparison of literature methods and proposed method. QoS Measurement
Scope in WB-WSCs
Type of PN
Case Tool
YES dependability, reliability, maintainability, security, availability, and performance
Eflow, PPM, BPEL
Explicit CPN
YES
Only performance and reliability
BPEL
NO
Dong et al., 2009 [6]
Only performance
BPEL
Chen et al., 2009 [9] Song et al., 2009 [7]
Only reliability Only performance
BPEL BPEL
Implicit SPN Implicit SPN Implicit PN Implicit TPN
Method Proposed method Zhong and Qi, 2006 [8]
WSLA of each web service. In this way each metric could also be found by fetching the related WSLA. The technique proposed in this research could be used only if the probability of firings in OR split/PICK split is known by the developer or web service composer. In fact this yields explicit modeling in CPN in which split transitions could be used. The reason three different cases were selected was that first, neither all the structured activities could not be shown in one example nor all the QoS was intended in all the cases. Regarding WSET a questionnaire and the case tool were sent to the experts in the field. The questionnaire contained 6 questions regarding the functionality of WSET on its user-friendliness, WB-WSC generation and conversion to CPN, QoS measurement, usefulness, novelty of the tool, and originality of the tool. The experts were asked to give 1 to 4 to the questions which one resembled weak, two resembled satisfactory, three resembled good, and four resembled excellent. WSET received the average result of 3.31 from 4 in which the average result on user-friendliness was 3, WBWSC generation and conversion to CPN received 3.5, QoS measurement received 3.5, usefulness received 2.8, originality
NO NO NO
received 3.8 and the novelty of the tool received 3.3. The related works in WB-WSCs testing and evaluation are not much on eflow and PPM. However, there are researches on BPEL testing. But the majority of Petri net based researches on evaluation of BPEL had limitations as stated in Table 4. One of the main limitations of the previous works was that eflow could not be validated based on quality parameters since eflow has the concept of generic node in which in CPN it could be mapped to PICK split/join which was introduced in this research. Through this research the following major achievements were obtained: (a) enhancement of routing constructs in explicit CPN with PICK split/join transition, (b) deterministic analytical QoS measurement of WBWSCs, (c) developing WSET as a case tool for modeling and experimentally measuring QoS of WB-WSCs.
14
The Scientific World Journal Currently, there are four directions for future works: (a) applying implicit methods in modeling and QoS measurement of WB-WSCs where decision making cannot be shown explicitly and split/join transitions cannot be used in the modeling, (b) evaluation of other workflow-based systems such as UML activity diagram and BPMN using the analytical formulas and modeling methods of this research, (c) congestion detection in WB-WSCs using the concept of size in CPN transitions, (d) calculation of dependability using a nonlinear function.
Conflict of Interests The authors declare that there is no conflict of interests regarding the publication of this paper.
References [1] G. H. Tabatabei, M. Nasir, and S. Ibrahim, “A comparative evaluation of state-of-the-art approaches for web service composition,” in Proceedings of the IEEE 3rd International Conference on Software Engineering Advances (ICSEA ’08), pp. 488–493, IEEE, Silema, Malta, October 2008. [2] F. Casati and M. Shan, “Event-based interaction management for composite E-services in eFlow,” Information Systems Frontiers, vol. 4, no. 1, pp. 19–31, 2002. [3] H. Nematzadeh and R. Mohamad, “Towards validation of E-services composition: transforming eflow to petri-nets,” in Proceedings of the 9th Annual International Conference on Software Engineering Research and Practice (SERP ’10), pp. 514– 521, Las Vegas, Nev, USA, July 2010. [4] H. Nematzadeh, R. Mohamad, and H. Motameni, “Transforming polymorphic process model to petri net: A formal way for validating workflow-based web service composition,” in Proceedings of the IEEE 2nd International Conference on Software Engineering and Service Science (ICSESS ’11), pp. 316– 321, Beijing, China, July 2011. [5] H. Schuster, D. Georgakopoulos, A. Cichocki, and Z. Baker, “Modeling and composing service based and reference processbased multi-enterprise processes,” in Advanced Information Systems Engineering, B. Wangler, Ed., pp. 247–263, Springer, Berlin, Germany, 2000. [6] Y. Dong, Y. Xia, Q. Zhu, and R. Yang, “A stochastic approach to predicting performance of web service composition,” Journal of Computers, vol. 4, no. 6, pp. 485–493, 2009. [7] W. Song, X. Ma, C. Ye, W. Dou, and J. Lu, “Timed modeling and verification of BPEL processes using time Petri nets,” in Proceedings of the 9th International Conference on Quality Software (QSIC ’09), pp. 92–97, Jeju, republic of Korea, August 2009. [8] D. Zhong and Z. Qi, “A petri net based approach for reliability prediction of web services,” in Proceedings of the on the Move to Meaningful Internet Systems Workshops (OTM ’06), R. Meersman, Ed., pp. 116–125, Springer, Berlin, Germany, 2006. [9] L. Chen, Z. Shao, G. Fan, and H. Ma, “A method for analyzing and predicting reliability of BPEL process,” Journal of Software, vol. 4, no. 1, pp. 11–18, 2009.
[10] D. Bruneo, S. Distefano, F. Longo, and M. Scarpa, “QoS assessment of WS-BPEL processes through non-Markovian stochastic Petri nets,” in Proceedings of the 24th IEEE International Parallel and Distributed Processing Symposium (IPDPS '10), pp. 1–12, Atlanta, Ga, USA, April 2010. [11] H. Motameni, A. Movaghar, I. Daneshfar, H. Nematzadeh, and J. Bakhshi, “Mapping to convert activity diagram in fuzzy UML to fuzzy petri net,” World Applied Sciences Journal, vol. 3, no. 3, pp. 514–521, 2009. [12] H. Nematzadeh, “Modeling activity diagram to colored petri net for validation and verification of nonfunctional parameters,” Tech. Rep., Universiti Teknologi Malaysia, Skudai, Malaysia, 2008. [13] H. Nematzadehm, S. Deris, H. Maleki, and Z. Nematzadeh, “Evaluating reliability of system sequence diagram using fuzzy Petri net,” International Journal of Recent Trends in Engineering, vol. 1, pp. 142–147, 2009. [14] W. Tan, Y. Fan, and M. Zhou, “A petri net-based method for compatibility analysis and composition of web services in business process execution language,” IEEE Transactions on Automation Science and Engineering, vol. 6, no. 1, pp. 94–106, 2009. [15] T. Yoo, B. Jeong, and H. Cho, “A Petri Nets based functional validation for services composition,” Expert Systems with Applications, vol. 37, no. 5, pp. 3768–3776, 2010. [16] C. R. V´azquez and M. Silva, “Stochastic continuous petri nets: an approximation of Markovian net models,” IEEE Transactions on Systems, Man, and Cybernetics A: Systems and Humans, vol. 42, no. 3, pp. 641–653, 2012. [17] W. M. P. Van der Aalst, “The application of Petri nets to workflow management,” Journal of Circuits, Systems and Computers, vol. 8, no. 1, pp. 21–66, 1998. [18] J. Cardoso, A. Sheth, J. Miller, J. Arnold, and K. Kochut, “Quality of service for workflows and web service processes,” Journal of Web Semantics, vol. 1, no. 3, pp. 281–308, 2004. [19] M. Perepletchikov, C. Ryan, K. Frampton, and Z. Tari, “Coupling metrics for predicting maintainability in service-oriented designs,” in Proceedings of the 18th Australian Sof tware Engineering Conference, pp. 329–338, Melbourne, Australia, April 2007. [20] Q. A. Liang, H. Lam, L. Narupiyakul, and P. C. K. Hung, “A rulebased approach for availability of Web service,” in Proceedings of the IEEE International Conference on Web Services (ICWS '08), pp. 153–160, Beijing, China, September 2008. [21] A. Aviˇzienis, J. Laprie, B. Randell, and C. Landwehr, “Basic concepts and taxonomy of dependable and secure computing,” IEEE Transactions on Dependable and Secure Computing, vol. 1, no. 1, pp. 11–33, 2004. [22] Y. Chen, WS-mediator for improving dependability of service composition [Degree of Doctor of Philosophy], Newcastle University, Newcastle upon Tyne, UK, 2008. [23] F. Xiao-Ning, Q. Liu, and Z. Wang, “A web service composition modeling and evaluation method used Petri net,” in Advanced Web and Network Technologies and Applications, J. Li, Ed., pp. 905–911, Springer, Berlin, Germany, 2006. [24] J. D. Musa, Software Reliability Engineering, McGraw-Hill, New York, NY, USA, 1998.
Journal of
Advances in
Industrial Engineering
Multimedia
Hindawi Publishing Corporation http://www.hindawi.com
The Scientific World Journal Volume 2014
Hindawi Publishing Corporation http://www.hindawi.com
Volume 2014
Applied Computational Intelligence and Soft Computing
International Journal of
Distributed Sensor Networks Hindawi Publishing Corporation http://www.hindawi.com
Volume 2014
Hindawi Publishing Corporation http://www.hindawi.com
Volume 2014
Hindawi Publishing Corporation http://www.hindawi.com
Volume 2014
Advances in
Fuzzy Systems Modelling & Simulation in Engineering Hindawi Publishing Corporation http://www.hindawi.com
Hindawi Publishing Corporation http://www.hindawi.com
Volume 2014
Volume 2014
Submit your manuscripts at http://www.hindawi.com
Journal of
Computer Networks and Communications
Advances in
Artificial Intelligence Hindawi Publishing Corporation http://www.hindawi.com
Hindawi Publishing Corporation http://www.hindawi.com
Volume 2014
Computational Intelligence & Neuroscience
Volume 2014
Advances in
Artificial Neural Systems
International Journal of
Computer Games Technology
Hindawi Publishing Corporation http://www.hindawi.com
Volume 2014
Hindawi Publishing Corporation http://www.hindawi.com
Advances in
Advances in
Software Engineering
Computer Engineering Volume 2014
Hindawi Publishing Corporation http://www.hindawi.com
Volume 2014
Hindawi Publishing Corporation http://www.hindawi.com
Volume 2014
Hindawi Publishing Corporation http://www.hindawi.com
Volume 2014
International Journal of
Biomedical Imaging International Journal of
Reconfigurable Computing
Advances in
Robotics Hindawi Publishing Corporation http://www.hindawi.com
Journal of
Human-Computer Interaction
Journal of
Volume 2014
Hindawi Publishing Corporation http://www.hindawi.com
Electrical and Computer Engineering Volume 2014
Hindawi Publishing Corporation http://www.hindawi.com
Volume 2014
Hindawi Publishing Corporation http://www.hindawi.com
Volume 2014
Hindawi Publishing Corporation http://www.hindawi.com
Volume 2014